Hello everyone,
This weekend, I will select an asset and conduct a thorough analysis. I will share this analysis with you here, including stop-loss (SL), entry, and exit prices.
If you have an asset that you would like me to analyze, feel free to send me a DM or drop a comment here. I can only analyze one asset per weekend.
Of course, this is not financial advice but is intended purely for entertainment. My primary goal is to provide this as educational material, which does not mean that I won't personally execute these trades.
Today, I have chosen:
Tesla (Ticker: TSLA)
Options Data (Greeks)
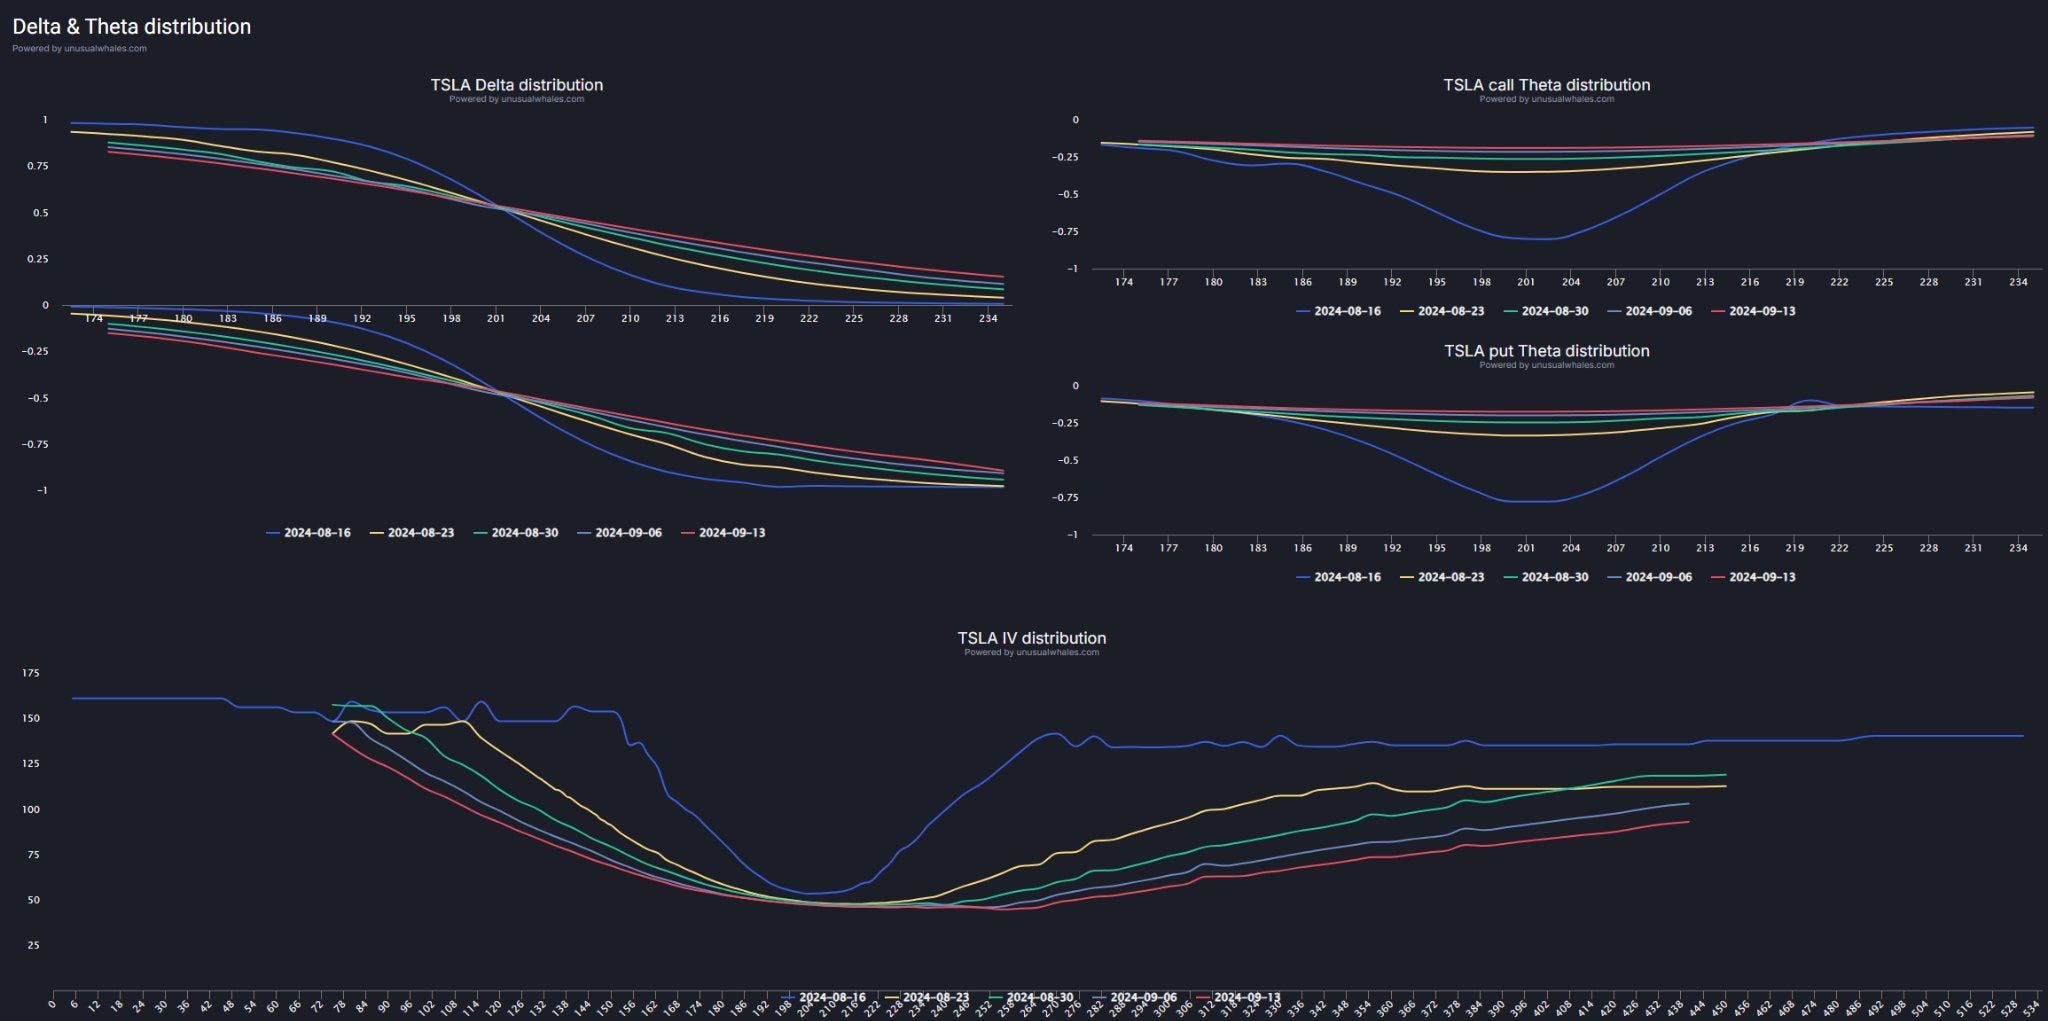
TSLA Delta Distribution
Delta measures the sensitivity of the option price to changes in the underlying asset, in this case, Tesla stock.
Interpretation:
For shorter expiration dates (August 16, 2024), Delta shows a steeper transition from positive to negative values, indicating higher sensitivity to price changes.
Longer expiration dates (up to September 13, 2024) show a flatter Delta curve, indicating lower sensitivity and thus lower risk.
This means that options expiring soon are more responsive to price movements, while longer-term options are more stable.
TSLA Call Theta Distribution
Theta measures the time decay of an option—how much value the option loses as the expiration date approaches.
Interpretation:
Call options lose the most value when the strike price is around 204 to 210, especially for options expiring on August 16, 2024.
The closer the expiration date, the higher the time decay (Theta), which is typical since options with a short time to expiration lose value more quickly.
Options with later expiration dates (e.g., August 30, 2024) show a slower rate of value decline, indicating a slower time decay.
TSLA Put Theta Distribution
This graph shows the time decay for put options.
Interpretation:
Similar to calls, the time decay for puts is greater for shorter expiration dates.
The value loss is particularly significant at strike prices of 198 to 210, suggesting that market participants consider these strike prices especially risky.
Options with longer expiration dates (e.g., September 6, 2024) show a more stable trend.
TSLA IV (Implied Volatility) Distribution
IV measures the expected volatility of the option. Higher IV means the market expects larger price movements.
Interpretation:
Implied volatility is significantly higher for short-term options (August 16, 2024), indicating that the market expects significant price movements for Tesla in the near future.
As the expiration date increases, IV decreases, meaning the market expects less volatility in the long term.
This distribution shows that traders anticipate high fluctuations in the short term and are willing to pay higher premiums for it.
Summary:
Short-term options: Both Delta and Theta show that short-term options are sensitive to price movements and lose value quickly, amplified by high IV. This suggests that significant price movements are expected in the coming days/weeks.
Longer-term options:
Longer-term options are less volatile and lose value more slowly, making them more stable but less profitable for short-term speculation.
Potential Opportunities:
Traders might consider short-term strategies, especially if they expect strong price movements, to take advantage of high IV and sensitive Delta/Theta values.
Long-term investors could benefit from the lower IV and more stable Theta of longer-term options if they prefer less risky bets on Tesla's long-term development.
Options Data (Max Pain)
Max Pain at 210:
The "Max Pain" point at 210 suggests that at this price, the majority of options would expire worthless, resulting in the largest loss for option holders and the greatest gain for option writers.
Distribution of Put and Call Pain Levels:
Put Pain (red):
Most put options appear to be concentrated in the range of 75 to 180, indicating that many investors are betting on falling prices. If the price stays above these levels, these puts lose their value.
Call Pain (green):
On the other hand, we see a significant increase in call options between 220 and 450, especially at higher strike prices. This means that many traders are betting on rising prices. If the price remains below these levels, these calls expire worthless.
Implications for the Price:
Price Drift Toward 210:
Since the Max Pain is at 210, there is a possibility that TSLA’s price could move toward this level as the expiration date approaches. This would cause many calls and puts to expire worthless, which would be beneficial for option writers.
Trading Strategies Based on Max Pain:
Short Straddle or Strangle: Traders might consider opening a short straddle or strangle position around the Max Pain level (210) to profit from the expected sideways movement.
Conservative Call or Put Purchases: If one expects a movement away from the Max Pain point (e.g., due to fundamental events), it might be wise to buy puts below 210 or calls above 210, depending on the expected direction of the price movement.
Summary:
The Max Pain analysis suggests that TSLA’s price could move toward 210 by the expiration on August 30, 2024, causing the greatest financial pain for option holders. Traders could use this information to adjust their positions accordingly, either by hedging their current positions or by taking new positions that would benefit from a move toward or away from the Max Pain point.
Price Chart Analysis (CCI, OBV, ROC, CMF)
Price Movement and Volume
Price:
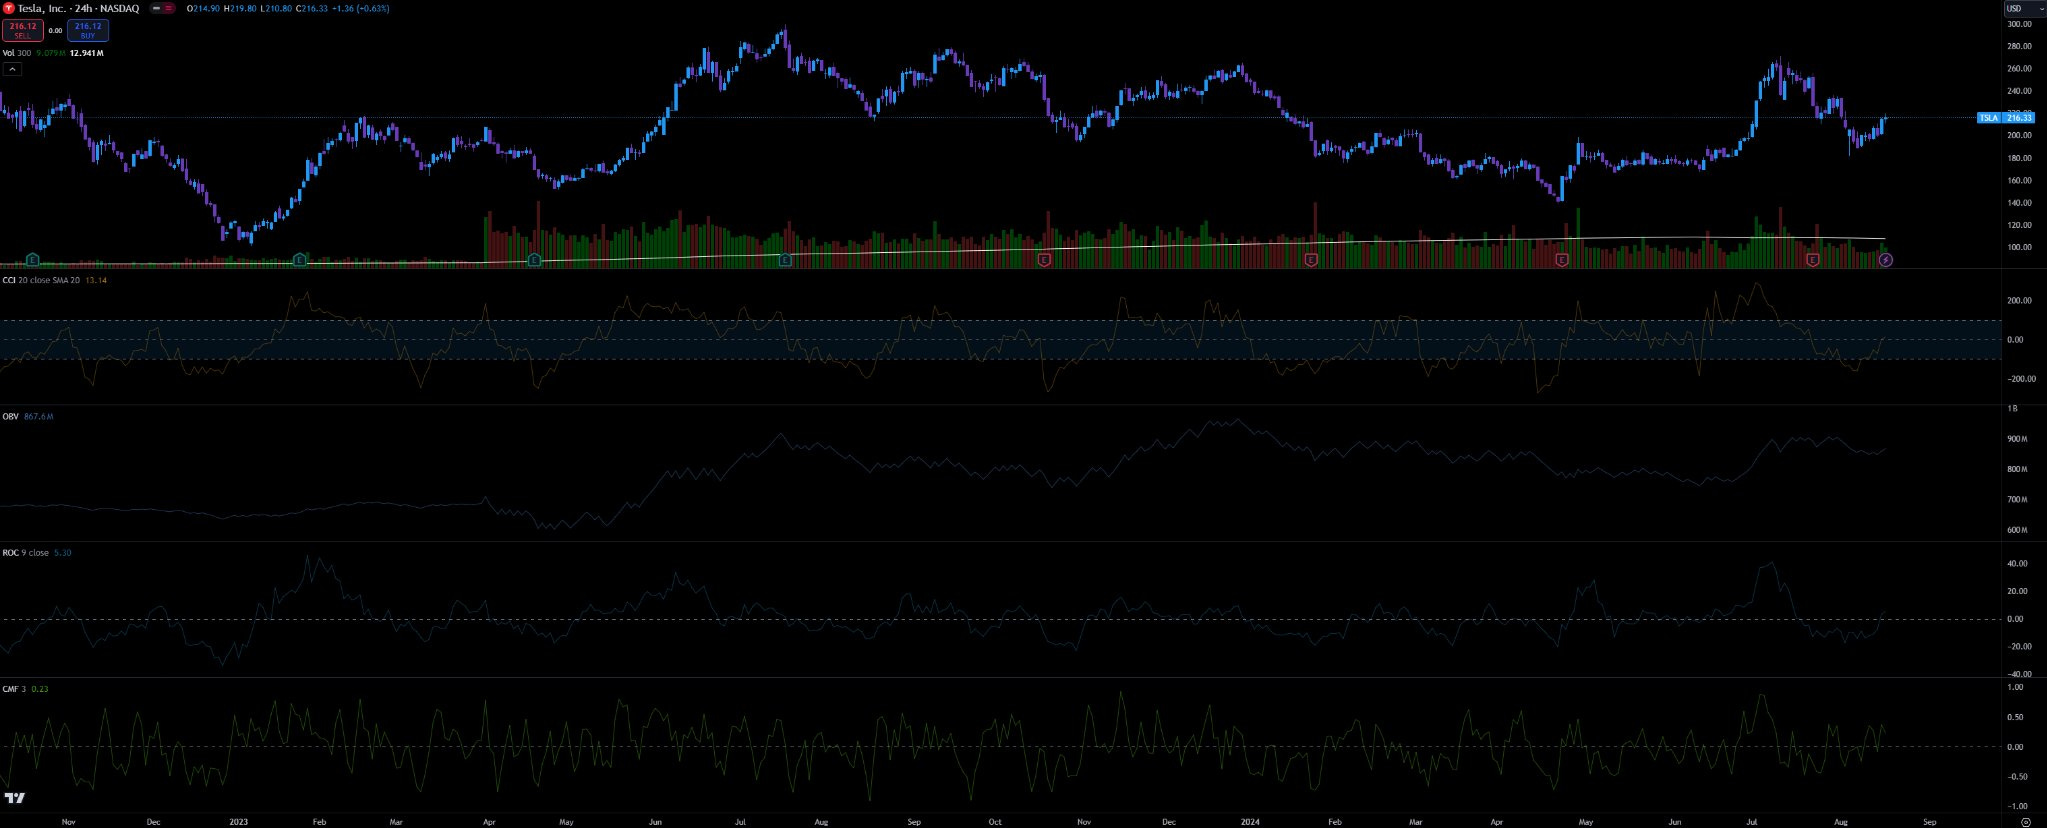
Tesla stock is currently trading at around $216.33. There has been a recovery from a low point, but the price remains below the highs from early 2023.
In recent months, the price seems to have been in a downward movement, with several lower highs and lower lows, indicating a continuing correction or downtrend.
Volume:
The volume has not shown significant spikes up or down. Steadily high volume could mean that market participants continue to trade actively, but without a clear direction.
Commodity Channel Index (CCI)
Current CCI Value:
The CCI is at 13.14, indicating that the stock is currently neither overbought nor oversold.
Interpretation:
The CCI has recovered from an oversold area, indicating that the stock has recently undergone a recovery phase. It could be an early sign of an upcoming upward movement, but the value is still close to the neutral zone.
On-Balance Volume (OBV)
Current OBV Value:
The OBV is at 867.6M.
Interpretation:
The OBV is trending sideways, suggesting that there is no clear trend in volume distribution. This could indicate a consolidation phase, where neither buyers nor sellers dominate.
Rate of Change (ROC)
Current ROC Value:
The ROC is at 5.30, indicating a slight positive price change.
Interpretation:
A positive ROC indicates that the price has increased recently. However, the value is not very high, meaning that the strength of the trend is not yet pronounced. It could be a temporary recovery unless a significant positive ROC value is reached.
Chaikin Money Flow (CMF)
Current CMF Value:
The CMF is at 0.23.
Interpretation:
A positive CMF value indicates that money is flowing into the stock, which is a bullish signal. It suggests that buying activity may be outweighing selling activity. A sustained positive CMF could indicate further price increases.
Summary
Trend: Tesla remains in a downtrend, but there are signs of a potential recovery or consolidation, especially if the CCI and CMF continue to rise.
Volume and Momentum: The volume is stable, while the OBV is trending sideways. Momentum, as measured by the ROC, shows a slight improvement, but there are no clear signs of a strong trend reversal yet.
Trading Strategy: Traders might consider a short-term upward movement as long as the CMF remains positive and the ROC continues to rise. For long-term investments, it would be advisable to wait for a clearer signal of a trend reversal, particularly a confirmation by the OBV and stronger price movements.
Price Chart Analysis (Stoch RSI, RSI)
Stochastic RSI (Stoch RSI)
Current Value:
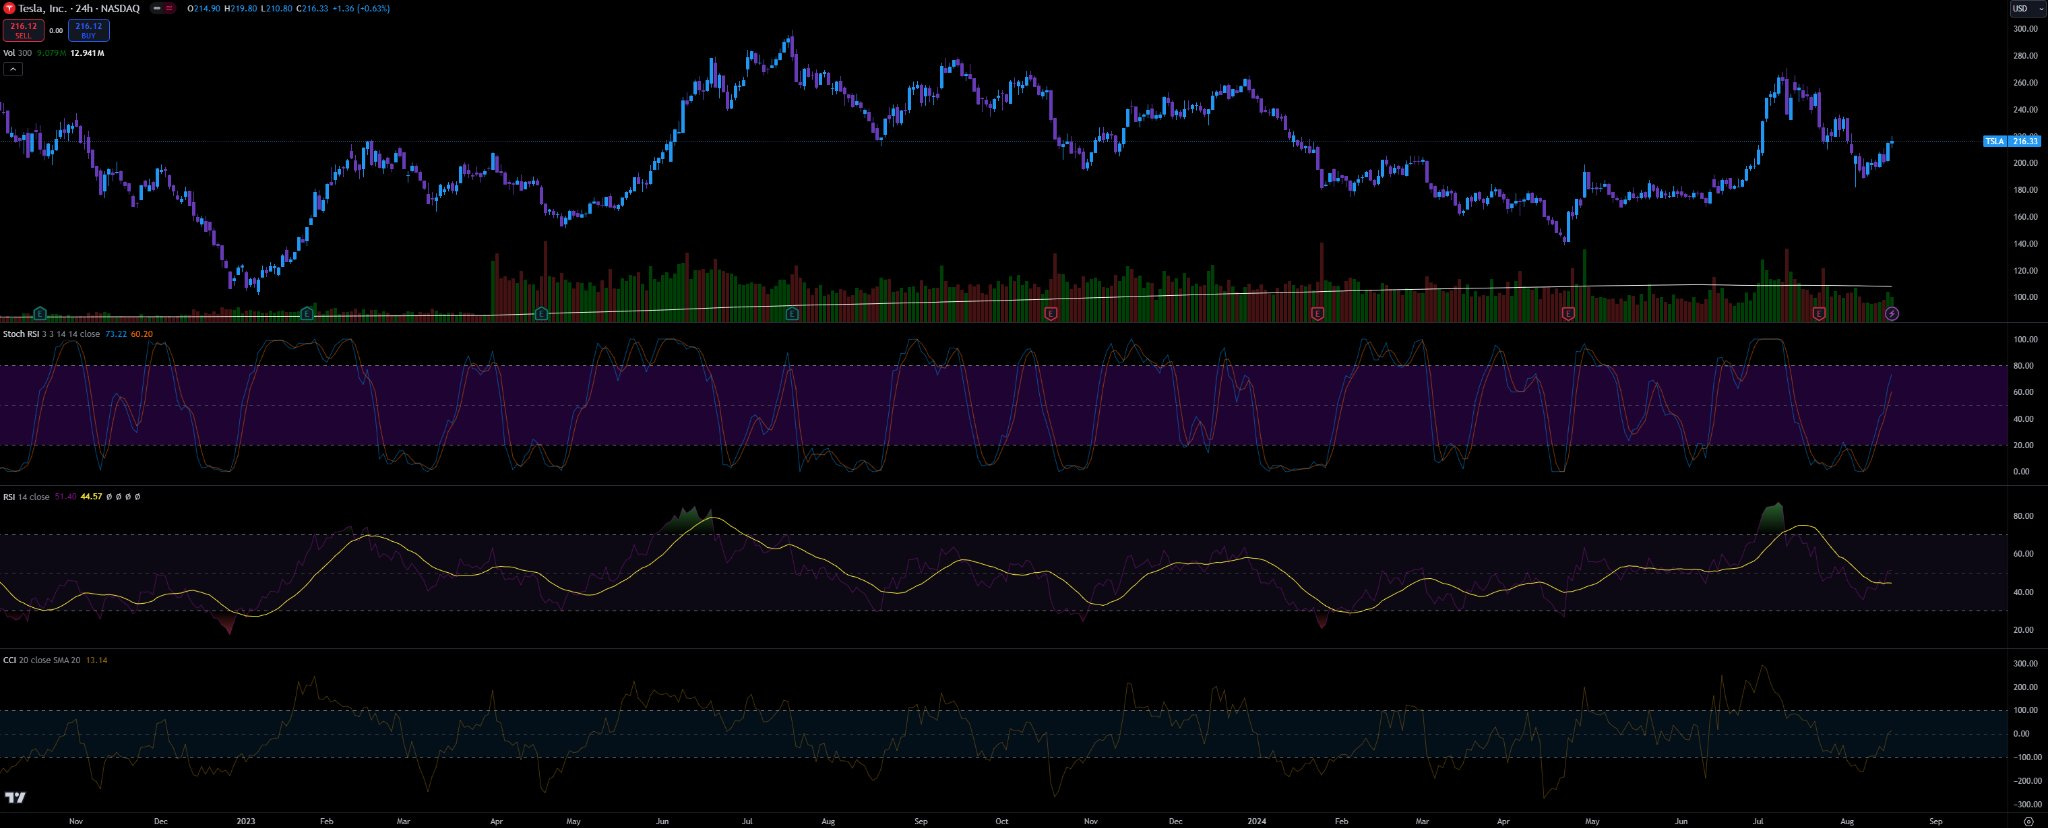
The Stoch RSI is at 73.22 with a signal at 60.20.
Interpretation:
The Stoch RSI is an indicator that shows overbought or oversold conditions based on the RSI. A value above 80 indicates an overbought condition, while a value below 20 indicates an oversold condition.
The current value near 73 suggests that Tesla is approaching the overbought zone but is not there yet. There is potential for a short-term upward movement before a possible correction sets in.
Relative Strength Index (RSI)
Current Value:
The RSI is at 51.40, with an SMA of 44.57.
Interpretation:
An RSI value around 50 indicates a neutral zone, where neither overbought nor oversold conditions are present. This shows that the market for Tesla is not overheated and does not exhibit strong upward or downward momentum.
The RSI SMA is slightly lower, indicating that the RSI has tended to increase in recent periods, which could be a sign of a gradual recovery.
Summary of Technical Analysis:
Trend and Momentum: The Tesla chart shows that the price is in a consolidation phase, with no clear overbought or oversold signals. The RSI and Stoch RSI show neutral to slightly bullish tendencies.
Market Conditions: The market seems to be stabilizing, with potential for short-term upward movements, as suggested by the Stoch RSI. Since the RSI is still neutral, a continuation of sideways movement or a slight recovery could occur.
Trading Strategy:
Traders might speculate on a short-term recovery as long as the Stoch RSI continues to rise and the RSI remains neutral to slightly bullish.
Price Chart Analysis (EMA Ribbon)
EMA Ribbon Overview
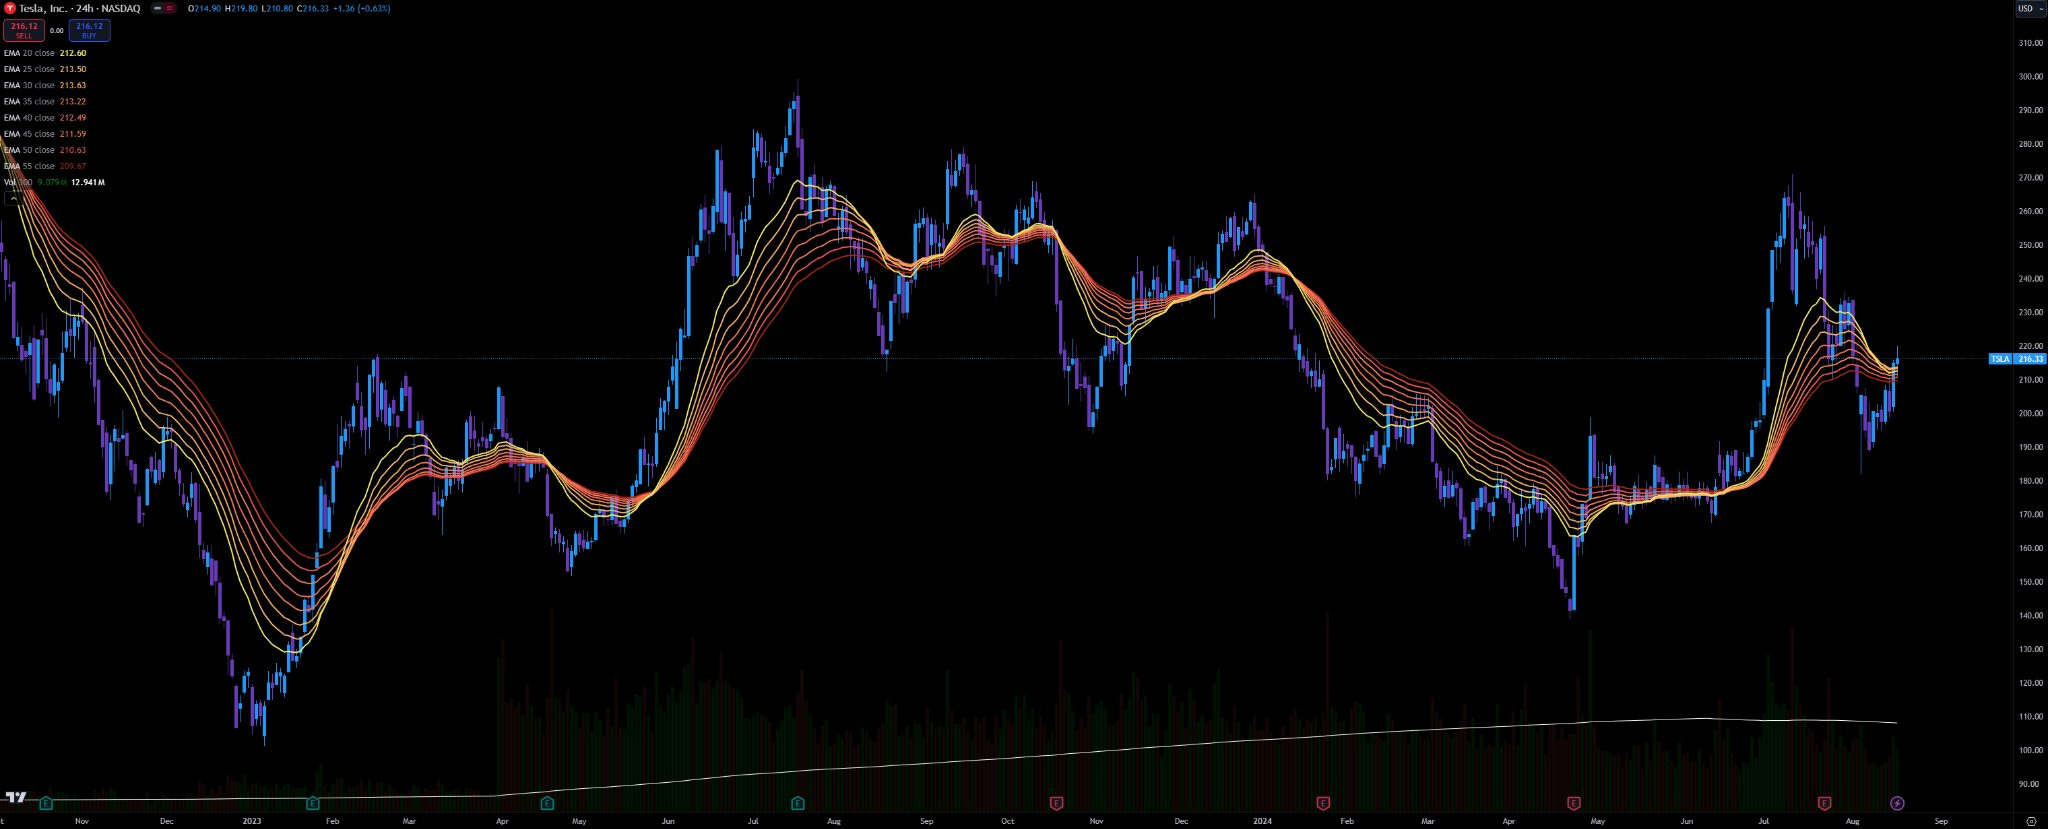
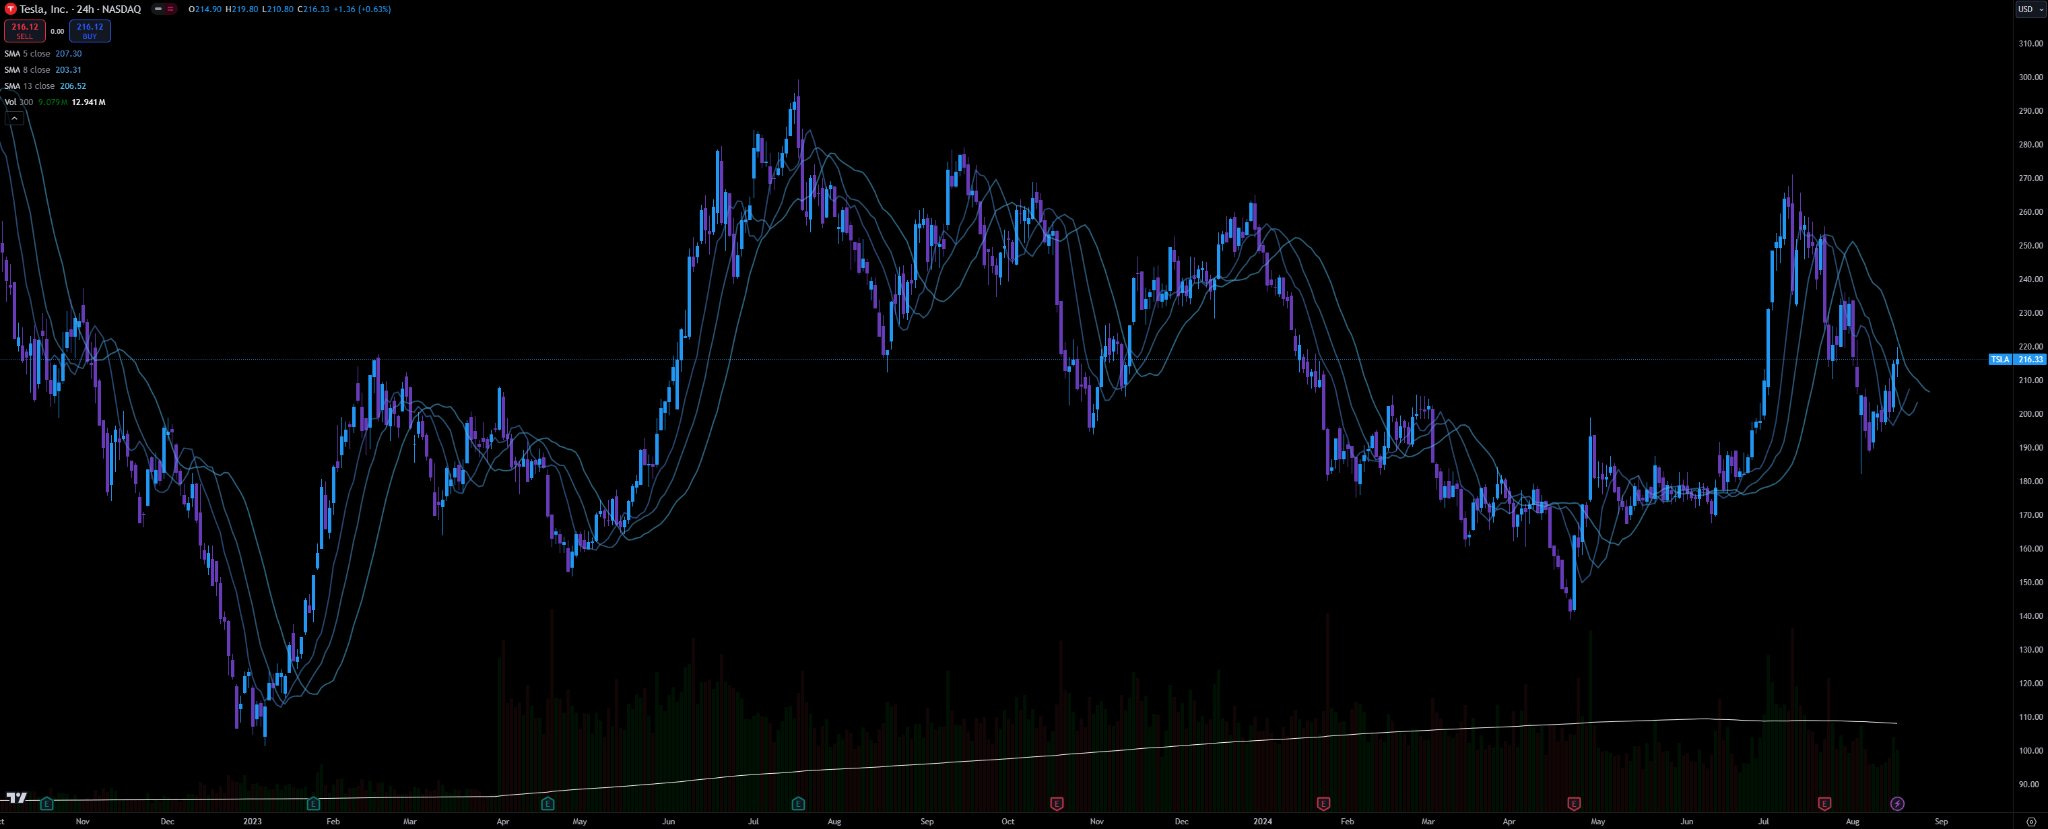
The EMA Ribbon consists of several EMAs (Exponential Moving Averages) that range from shorter to longer time periods (e.g., EMA 20 to EMA 50).
The bands of the EMA Ribbon show the relative position of the shorter to the longer EMAs, which is useful for identifying the current trend strength and direction.
Trend Assessment
Current Price:
The current price of TSLA is around $216.33 and is just above the EMAs, particularly above the shorter EMAs (EMA 20, 30).
Position of the EMAs:
The EMAs are slightly tilted upwards, which could indicate a potential recovery or the beginning of an uptrend.
Crossovers and Bands
Bullish Signals:
When the shorter EMAs (e.g., EMA 20 and 30) cross above the longer EMAs from below, this typically signals a bullish trend. In the current scenario, this process seems to be underway, indicating a potential continuation of the upward movement.
Bearish Signals:
Conversely, a crossover of the shorter EMAs below the longer EMAs would be a bearish signal, which is not currently the case.
Support and Resistance Zones
Support:
The lower bands of the EMA Ribbon (especially EMA 50 and EMA 60) could serve as strong support zones if the price falls.
Resistance:
The upper bands of the EMA Ribbon could act as potential resistance, particularly if the price attempts to break above the upper EMAs (e.g., EMA 20).
Conclusion
Current Situation:
Tesla is showing signs of stabilization above the EMA Ribbons, indicating a possible recovery or the beginning of an uptrend. As long as the price remains above the shorter EMAs and the EMA Ribbon bands are pointing upwards, this trend could continue.
Potential Trades:
Traders might consider taking long positions upon confirmation of the uptrend (e.g., through further crossovers of the EMAs upwards). Stop-loss positions could be placed below the longer EMAs to protect against sudden price drops.
Observation:
It is important to monitor the price movement in relation to the EMA Ribbon. A significant drop below the lower EMAs could be a warning signal for a trend reversal.
Price Chart Analysis (SMA)
SMA 5, SMA 13, and SMA 50
SMA 5 (short-term):
This short-term moving average responds quickly to price changes and is a good indicator of short-term trends.
SMA 13 (medium-term)
The SMA 13 provides a slightly smoothed view of the trend and is often used as an indicator of mid-term market direction.
SMA 50 (long-term)
The SMA 50 is an important indicator of the longer-term trend direction.
Current Positions:
The price is slightly above the SMA 5 and SMA 13, indicating possible short-term support.
The SMA 50 is below the current price, indicating long-term support.
Crossovers
If the SMA 5 crosses the SMA 13 or SMA 50 from below, this is interpreted as a bullish signal.
Conversely, a crossover from above to below would be a bearish signal.
Bollinger Bands
Bollinger Bands consist of a middle band (usually an SMA) and two outer bands that are typically two standard deviations away from the middle band.
Volatility:
The width of the Bollinger Bands indicates market volatility. Narrower bands suggest lower volatility, while wider bands indicate higher volatility.
Current Price Position Relative to the Bands:
TSLA's current price is in the middle of the Bollinger Bands, indicating neutral market sentiment.
A breakout above the upper band could signal an overbought condition, while a breakout below the lower band could indicate an oversold condition.
Summary and Conclusion
Trend Assessment:
Short-term:
Tesla appears to find support from the SMA 5 and SMA 13. A rise above these levels, especially if the price moves above the upper Bollinger Band, could be a bullish signal.
Long-term: The SMA 50 continues to show support, and as long as the price remains above it, the long-term uptrend may stay intact.
Volatility and Price Movements:
The current position within the Bollinger Bands suggests a phase of consolidation. A move above or below the bands could signal the next significant movement.
Trading Strategy:
Traders might wait to see if the price shows a clear direction within the Bollinger Bands before opening a position. A breakout from the bands combined with a moving average crossover could provide a strong trading signal.
Hedges should be considered, especially if the price tests the middle Bollinger Bands.
Final Trade Report for Tesla (TSLA)
Summary of Analysis
Technical Analysis:
Price Level:
The current price is $216.33.
Trend:
In the short term, the price has moved above the shorter moving averages (SMA 5 and SMA 13), indicating a possible continuation of the short-term uptrend. The longer-term SMA 50 is below the current price, still indicating support and an intact long-term trend.
Indicators:
The Stochastic RSI shows that the price is near the overbought zone but still has upward potential. The RSI is neutral, indicating that there is still room for movement. The Bollinger Bands show a consolidation phase with potential breakout opportunities.
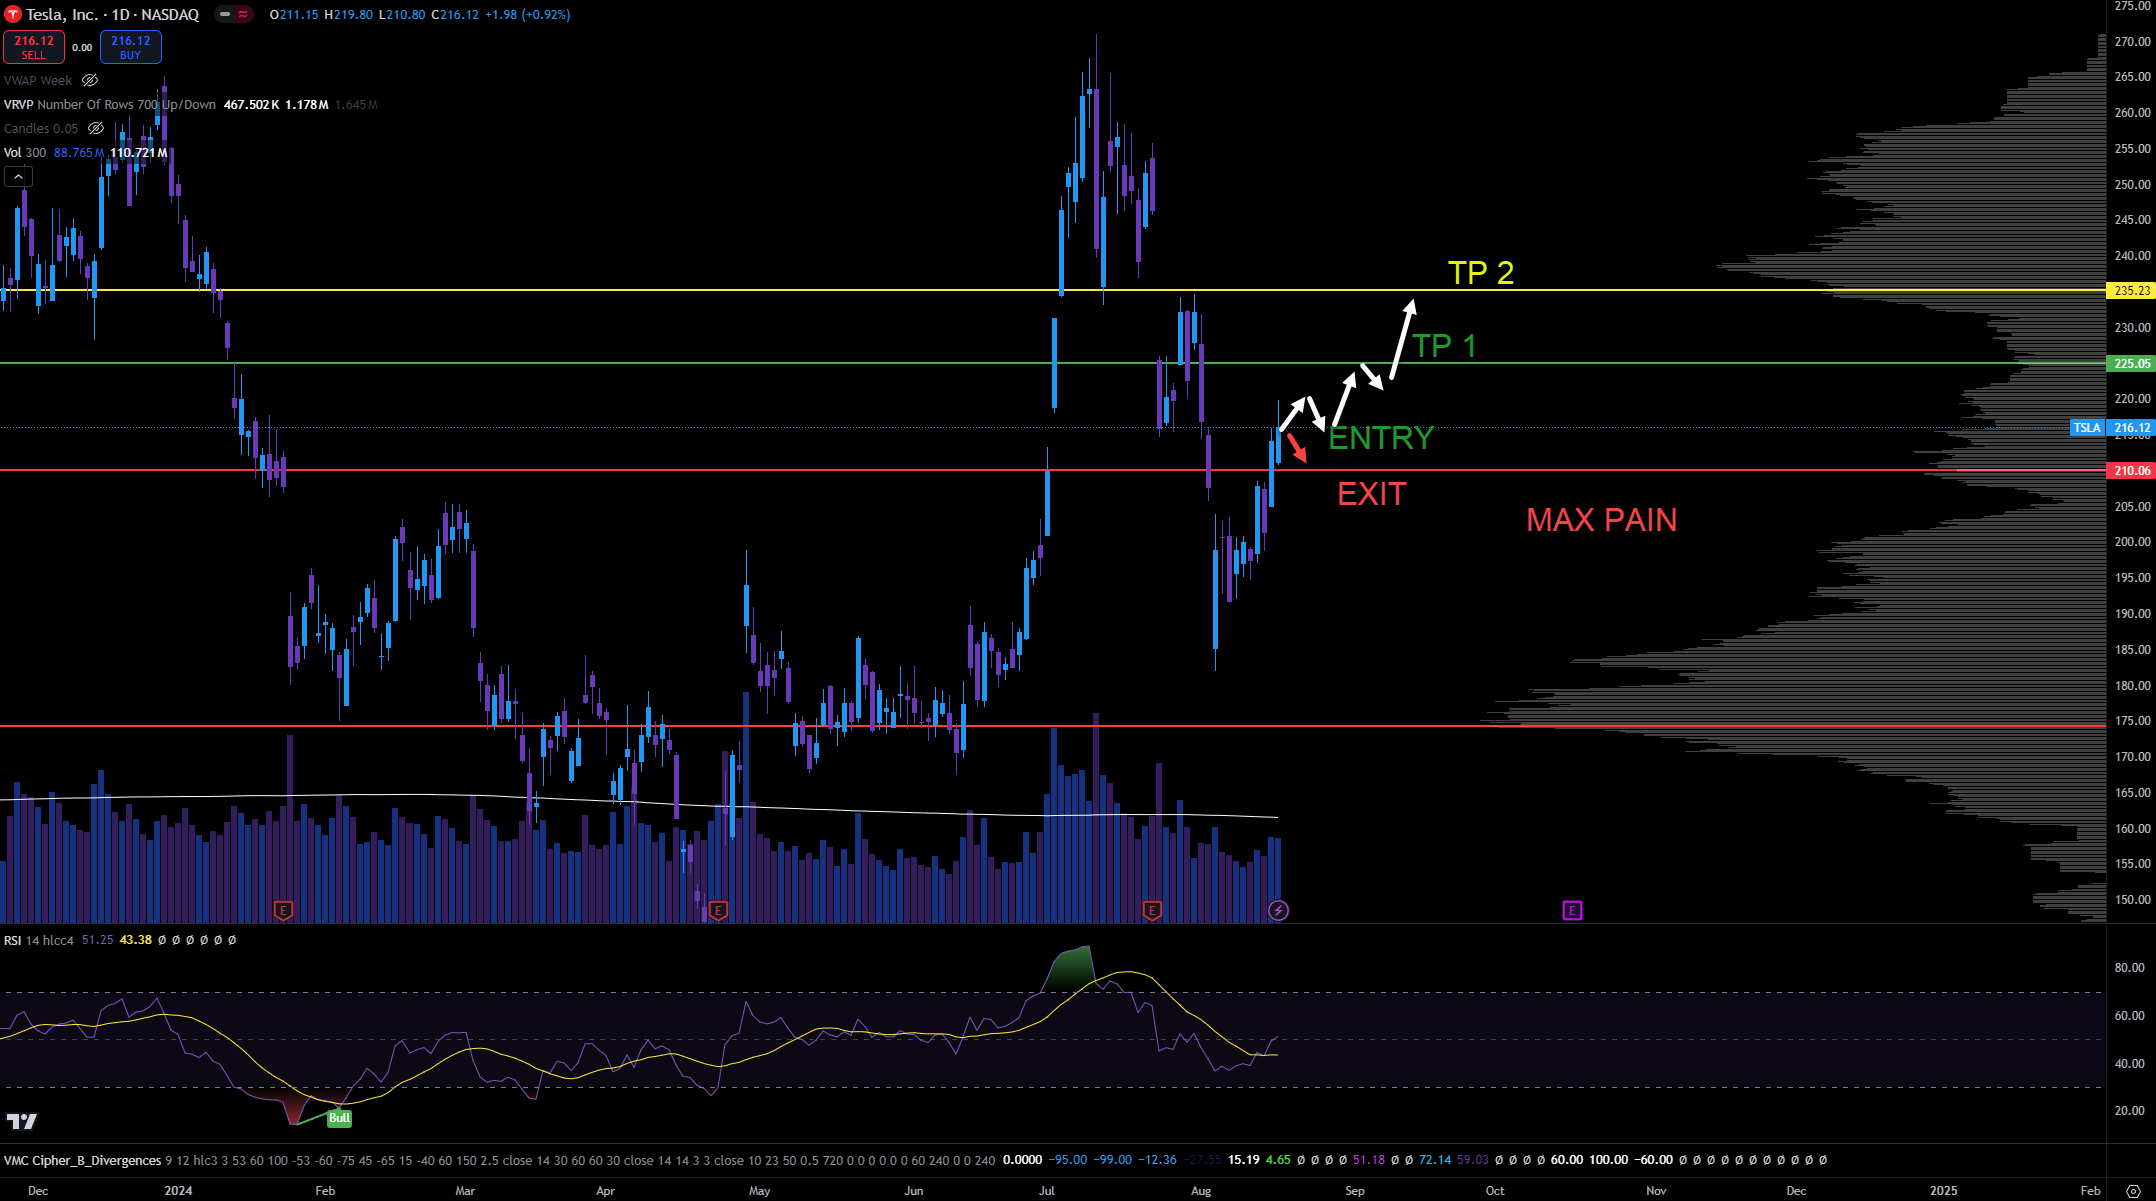
Max Pain: The Max Pain point for the expiration date on August 30, 2024, is at $210. This could become a magnet for the price if no significant moves above the current price occur.
My Personal Trading Strategy:
Trade Type:
Short-term Swing Trade (Long Position)
Entry Price:
$216.50
Based on the current price, which is slightly above the moving averages, and the neutral RSI. This represents an entry point if the market suggests a continuation of the recovery.
Exit Price:
First Target:
$228.00
This is near the upper Bollinger Band and an area that has served as resistance in previous price movements.
Second Target:
$235.00
This would be an optimistic target if the price breaks the resistance at $228 and the positive momentum continues.
Stop-Loss:
$209.00
This stop-loss is just below the Max Pain level of $210 and the SMA 50. Falling below this level would signal the risk of further downward pressure.
Risk Management:
Position Size: Risk a maximum of 1-2% of your total portfolio on this trade.
Risk-Reward Ratio: The risk-reward ratio is about 1:2 if the first target is reached, and 1:3 if the second target is reached.
Monitoring:
Monitor the price closely, especially as it approaches the upper Bollinger Band (around $228). If the price strongly trends in this direction, it may be wise to partially take profits or move the stop-loss upward to lock in gains.
Optional Adjustments:
If the price reaches the Max Pain level of $210 and there are no signs of an immediate recovery, it might be wise to close the trade to limit losses.
Potential:
The TSLA price could make a 5% to 8% gain in the next two weeks before it starts to approach the Max Pain level at $210. In case we see a breakout at $228, I would consider a move to $235 (VPOC), which could trigger a strong bullish momentum, allowing the TSLA price to rise even higher.
Conclusion:
This trade takes advantage of the current technical signals and market environment to profit from a short-term upward movement. The risk management ensures that potential losses are limited while leaving enough room for gains. The target prices are based on potential resistance zones supported by technical indicators.
Final Trade Report for Tesla (TSLA) Considering the Vumanchu Cipher B+ Divergences Indicator
Summary of Analysis
Price Level:
The current price is $216.33.
Trend:
The price has moved above the key moving averages and indicates a possible short-term upward movement. The long-term uptrend remains intact as long as the price stays above the SMA 50.
Vumanchu Cipher B+ Divergences Indicator
Current Signals:
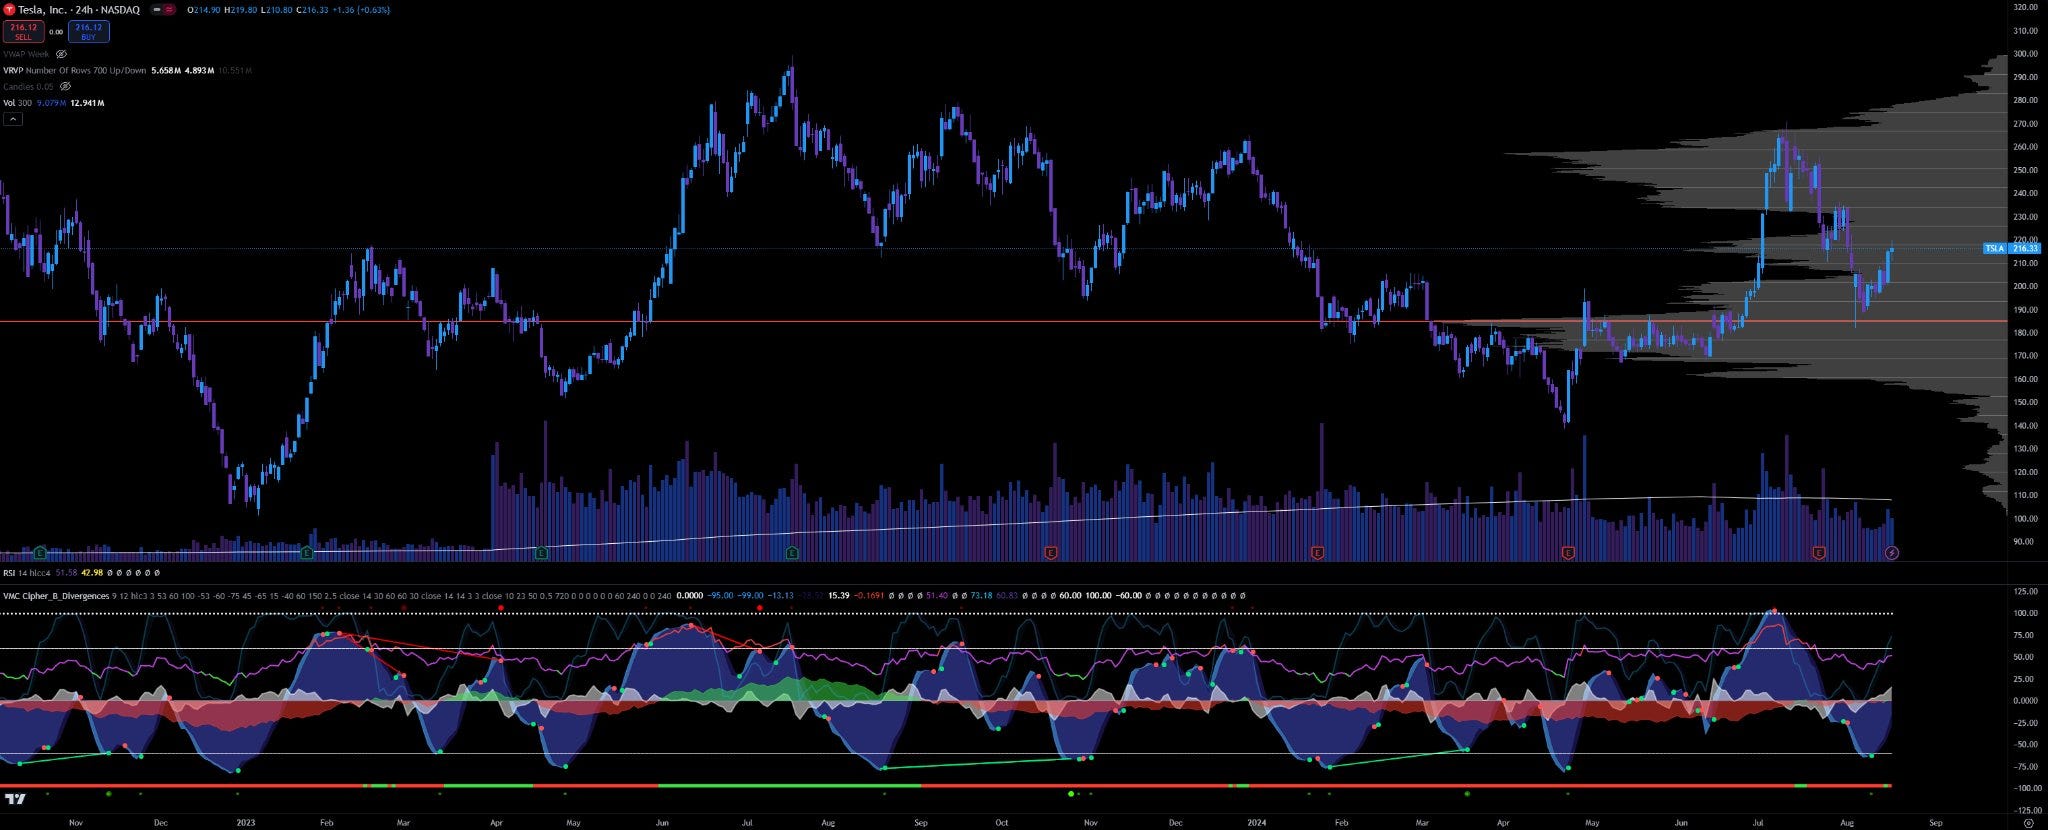
The indicator shows a positive divergence at recent lows, suggesting that the price may be at a turning point. There are green circles and diverging lines indicating a bullish movement.
Market Sentiment:
The indicator supports the assumption that a recovery is more likely, as positive divergences are visible in recent periods.
Recommended Trading Strategy
Trade Type:
Short-term Swing Trade (Long Position)
Entry Price:
$216.50
The entry point is slightly above the current price. This price is recommended based on the positive signals from the Vumanchu Cipher B+ Divergences Indicator and overall market sentiment.
Exit Price:
First Target: $228.00
This is near the upper Bollinger Band and corresponds to an area that has served as resistance in previous price movements.
Second Target: $235.00
This would be an optimistic target if the price breaks through the resistance at $228 and the positive momentum continues.
Stop-Loss: $209.00
This stop-loss is just below the Max Pain level of $210. Falling below this level would signal the risk of further downward pressure.
Vumanchu Cipher B+ Divergences Indicator Signals
Monitoring:
Pay special attention to new divergences or signals generated by the indicator. If bearish signals (red circles or divergences) appear, consider reviewing the position and possibly implementing an early exit strategy.
Link (TradingView) to the Indicator
https://tradingview.com/script/Msm4SjwI-VuManChu-Cipher-B-Divergences/
Recommendation for Using the Indicator Based on My Personal Experience
Day Trading: Use the 15-minute time frame.
If your goal is to trade for a whole week without short-term swing trades, use the 1-hour time frame.
Divergences
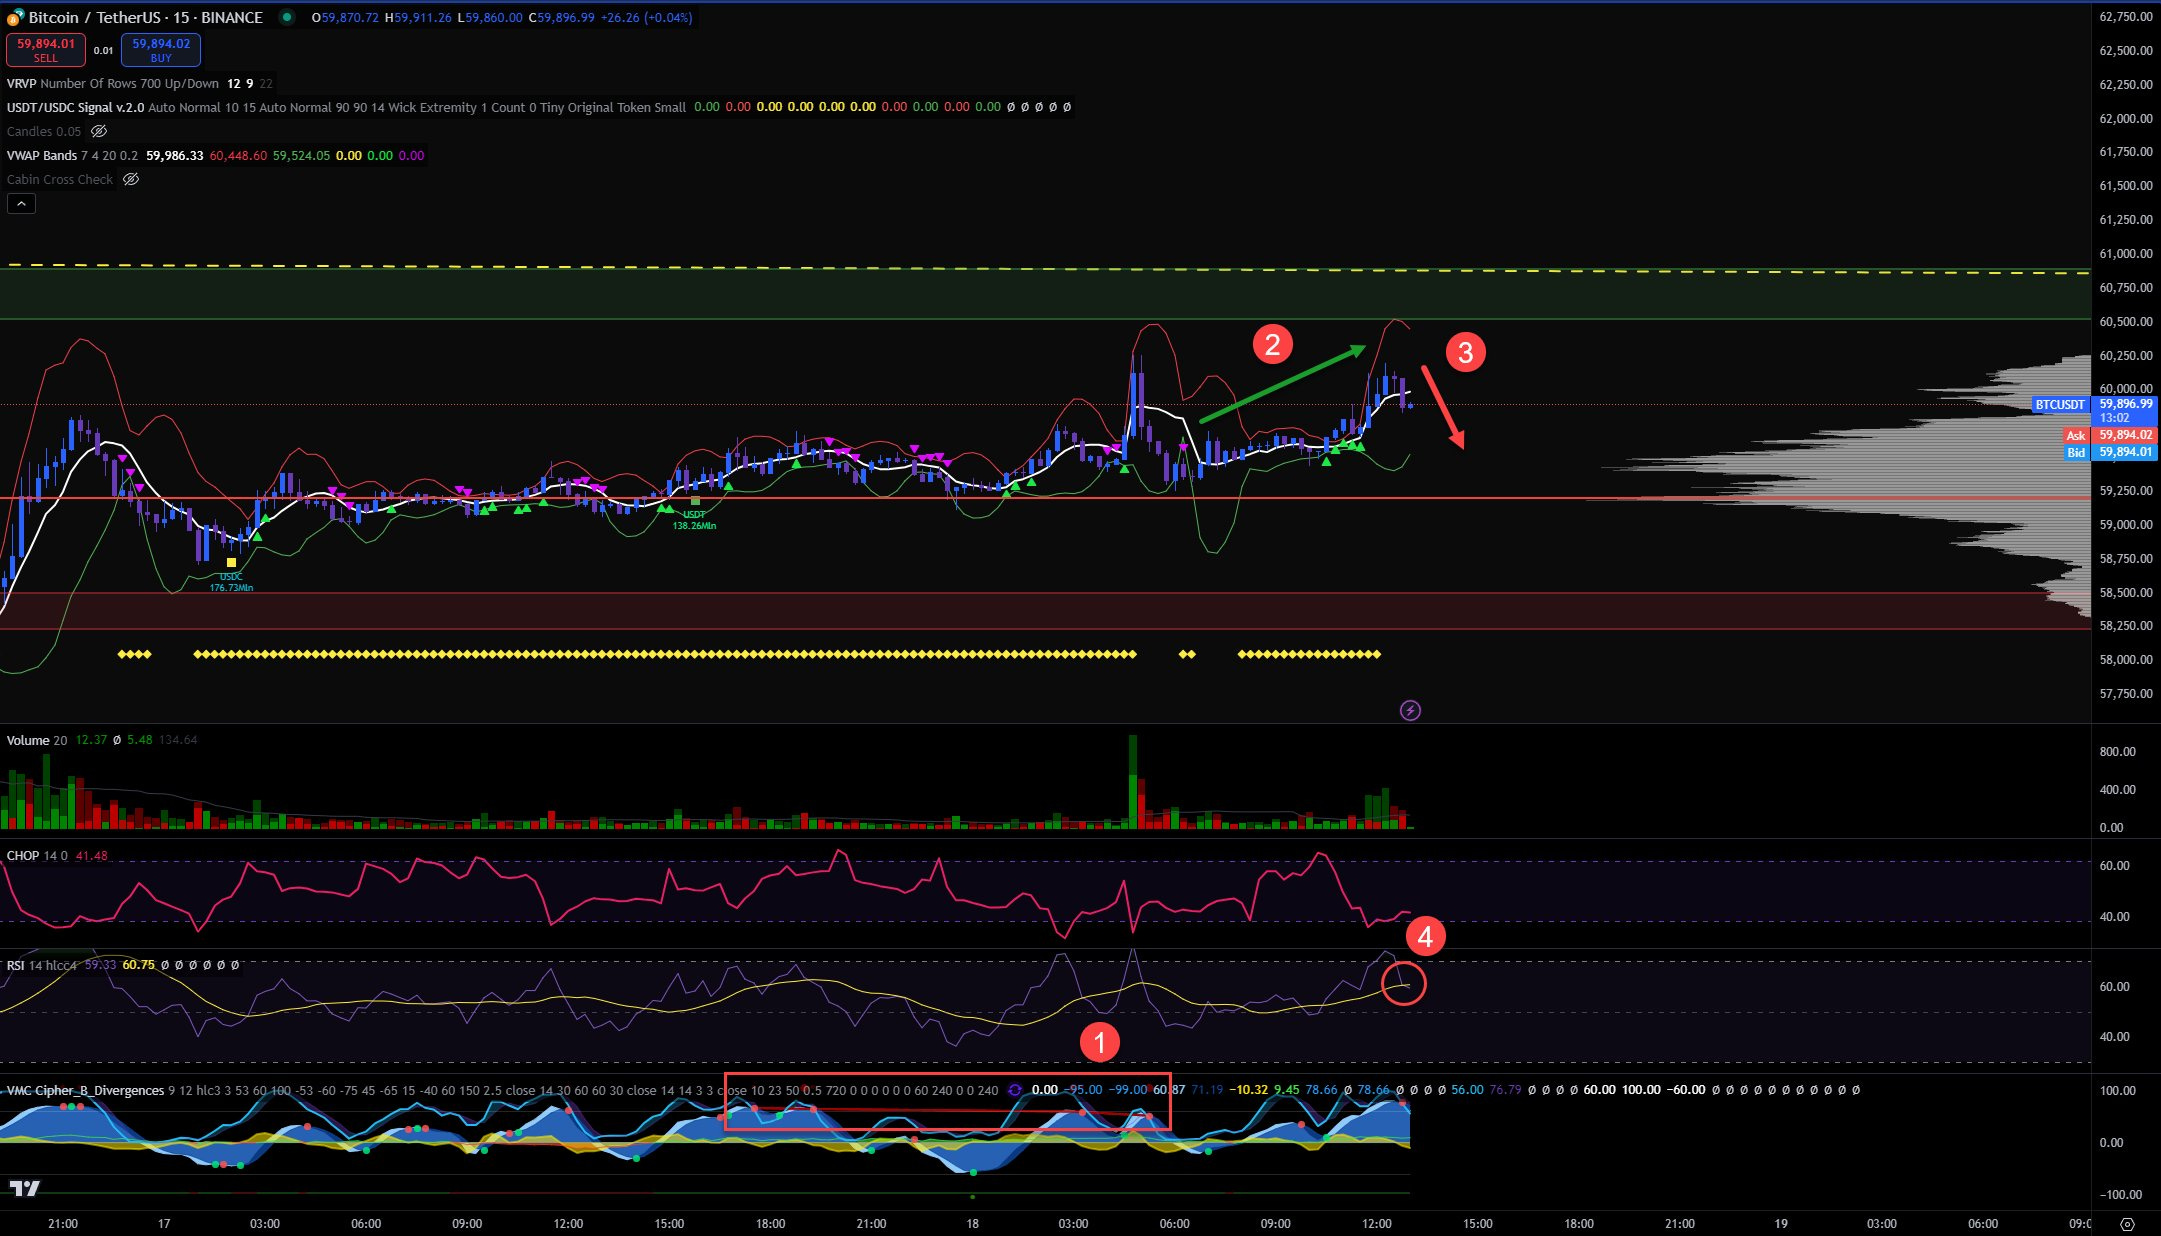
Divergences will not affect the price immediately. Usually, the price makes another leg up or down before a reversal. When I'm looking for a reversal trade and I see a divergence, I typically wait for a better opportunity. I'll show you how I trade such divergences with a current example using BTC.
Here we see the Bitcoin chart on the 15-minute time frame. The indicator showed me a divergence a few hours ago, but the price remained consistently above the 15-minute VWAP. Therefore, I patiently waited for a short trade. The divergence helps me identify a potential future trend.
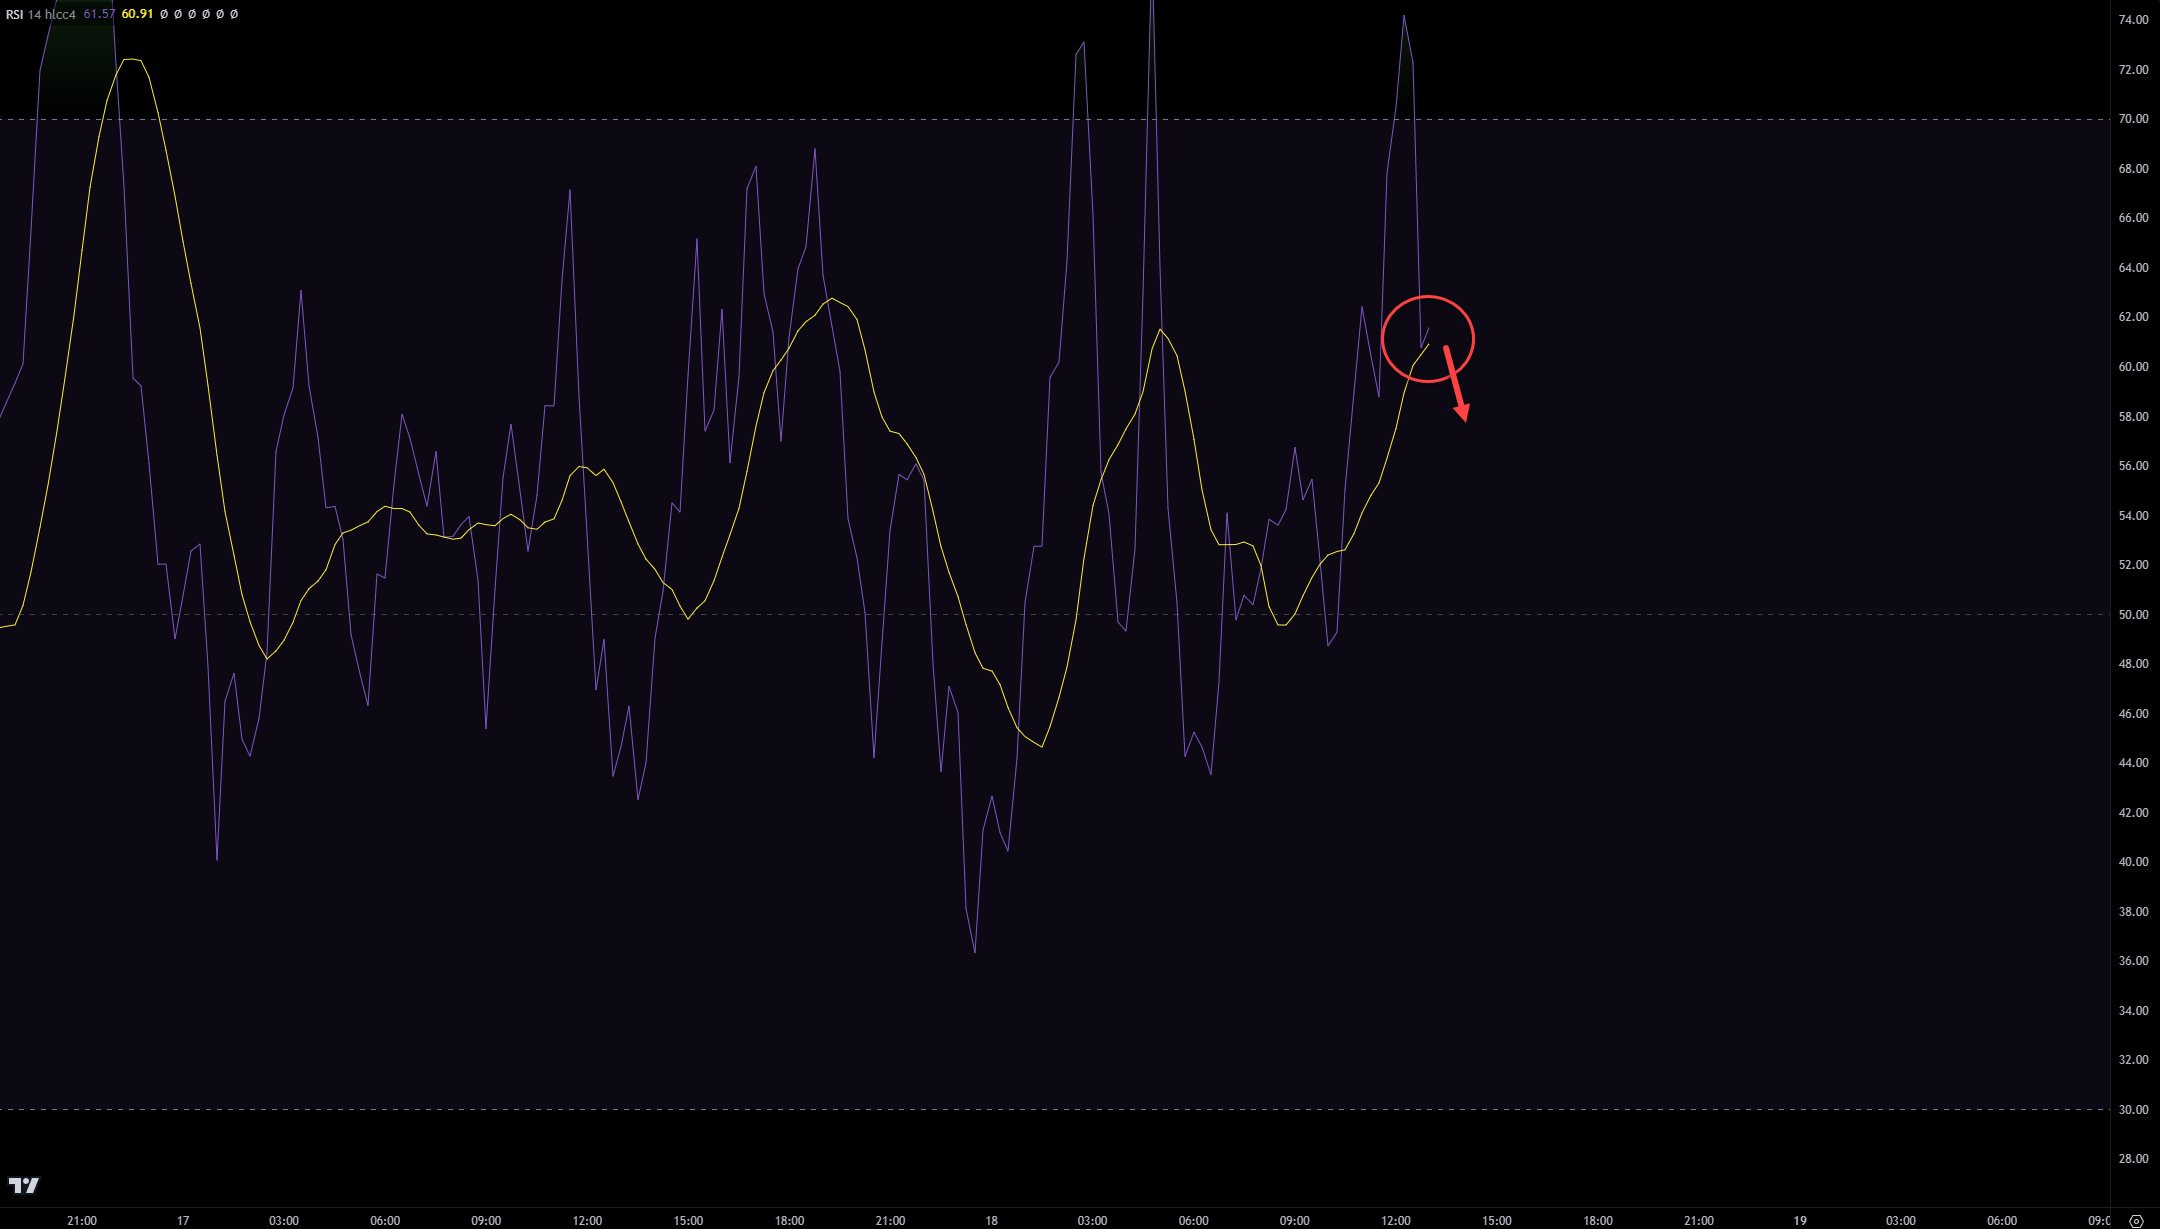
The price is now below the VWAP, so I'm entering a short position with an initial amount of funds. However, I’m not going all-in until the RSI crosses below the SMA. When that happens, I will allocate the rest of my budget for this operation into the position.
The combination of these indicators in this sequence has brought me good results. This is not financial advice, just for entertainment purposes, as I'm sure you understand. 😉



Just to mention, I will close my TSLA trade at $228. In my opinion, we will see some downward movement at $228. Usually, traders will try to retest the resistance there before that. Next weekend I present the next opportunity. 😉
It was a good trade. I'm currently long on TSLA with a Call Option at a $225 strike price. If we can push further towards $228, I'll be able to make a good cashout.