Comprehensive Bitcoin Options, Futures, and Spot Market Analysis – Highlights and 24-Hour Forecast
BTC Options Market Signals Mixed Sentiment: Lower Volatility Expectations Amidst Bearish Bias
1. BTC ATM IV (Greeks.Live)
Introduction: The At-The-Money Implied Volatility (ATM IV) measures the market's expectation of future volatility for at-the-money options, indicating the general sentiment around Bitcoin's future price movement.
Today's Data Analysis:
1 day: ATM IV is at 42.49%, showing a 6.09% decrease from the previous day and a 23.53% drop from one month ago.
1 week: ATM IV is 49.06%, down by 3.72% compared to yesterday, indicating a 10.30% decrease over the past month.
1 month: 51.65% ATM IV with a modest drop of 1.28% over the last day and 3.84% down over the past month.
Conclusion: ATM IV is consistently decreasing across all time frames, indicating reduced expectations for large price movements in the near term, possibly due to consolidation or market stabilization.
2. 25 Delta Skew (Greeks.Live)
Introduction: 25 Delta Skew reflects the difference between the implied volatilities of out-of-the-money calls and puts. It highlights the sentiment bias towards puts or calls, often signaling hedging activity.
Today's Data Analysis:
1 day: 25D Skew is -3.97%, indicating a 0.41% rise from the previous day but still reflecting a bearish sentiment.
1 week: 25D Skew is -6.47%, decreasing by 2.65%, showing a bearish bias and increased put demand.
Conclusion: The negative skew reflects a stronger bias towards downside protection (puts), with the market more concerned about price drops. The sentiment remains bearish in the short term.
3. BTC IV Skew (Greeks.Live)
Introduction: IV Skew tracks the relationship between implied volatility across different strike prices. A steeper skew can suggest market expectations for more volatility in either direction (upward or downward).
Today's Data Analysis:
The IV skew demonstrates that lower strike prices (out-of-the-money puts) have higher implied volatilities compared to higher strike prices (out-of-the-money calls), reflecting increased demand for downside protection.
Conclusion: The IV Skew remains downward sloping, reinforcing the bearish sentiment in the market with traders looking to hedge against potential price drops.
4. Historical Volatility (HV) (Greeks.Live)
Introduction: Historical Volatility (HV) measures the actual volatility observed in the past over various time frames. This is important to compare against implied volatility to gauge market expectations versus reality.
Today's Data Analysis:
1 day: HV is at 44.42%, dropping significantly by 14.14%.
1 week: HV sits at 54.70%, decreasing by 2.45%, showing a gradual reduction.
Conclusion: The decline in historical volatility indicates the actual price movements are becoming less volatile, aligning with the decline in implied volatility across all time frames. This could suggest a phase of lower volatility ahead.
5. BTC ATM Volatility Term Structure (Greeks.Live)
Introduction: The volatility term structure shows the implied volatility at different expiration dates. This is important to see if the market expects more volatility in the near or distant future.
Today's Data Analysis:
The structure is upward-sloping, with shorter-term volatility lower than the long-term. The term structure shows expectations for volatility to increase over time, with a peak around the end of 2024 (Nov-Dec).
Conclusion: The market expects an increase in volatility over the long term, possibly anticipating major events or macroeconomic changes towards the end of the year.
6. Option Flow (Greeks.Live)
Introduction: The option flow gives insight into the trading volumes and sentiment, showing whether traders are buying or selling calls/puts, thus indicating bullish or bearish biases.
Today's Data Analysis:
The option flow in the past 24 hours shows significant activity in call buys (20.79%) and call sells (20.81%), along with 16.32% in put sells.
Conclusion: The balanced flow between call buys and sells indicates mixed sentiment in the market, with traders equally betting on upward movements or protecting against downside risk.
7. BTC Options Open Interest By Expiration (As Of: 2024/09/12) (Greeks.Live)
Introduction: Open interest reflects the total number of outstanding option contracts at different expirations, giving an idea of liquidity and market interest.
Today's Data Analysis:
2024/12/29: This expiration date sees the highest open interest, with calls representing 30.97% and puts 27.72%.
Conclusion: The open interest suggests significant focus on end-of-year expirations, potentially driven by expectations of major market-moving events or hedging strategies during this period.
8. BTC Option Trade Volume (Greeks.Live)
Introduction: Trade volume tracks the total number of options traded, giving insight into market activity and whether options traders are more bullish or bearish.
Today's Data Analysis:
Significant trade volume activity is observed, with higher buy interest during specific times of the day, particularly around midday trading sessions.
Conclusion: The high trade volumes suggest active participation and growing liquidity in the Bitcoin options market. However, no clear directional bias is visible from the volume alone.
9. BTC VRP (Greeks.Live)
Introduction: Volatility Risk Premium (VRP) measures the difference between implied and realized volatility, indicating whether options are overpriced or underpriced relative to actual price movements.
Today's Data Analysis:
The VRP is fluctuating, currently showing a near-zero level, which indicates that implied volatility and realized volatility are in line with each other.
Conclusion: A neutral VRP suggests that the options market is currently pricing volatility in line with actual market behavior, with no significant overpricing or underpricing.
10. Strategy Flows (Laevitas.ch)
Introduction: Strategy flows offer a detailed look at the types of option strategies being executed in the market, such as spreads, straddles, or custom strategies.
Today's Data Analysis:
The most popular strategy today is a custom strategy with 872 contracts, followed by a call roll-up/forward strategy with 750 contracts.
Conclusion: The custom and roll-up strategies indicate traders are adjusting their positions, likely in anticipation of changes in price volatility in the coming days or weeks.
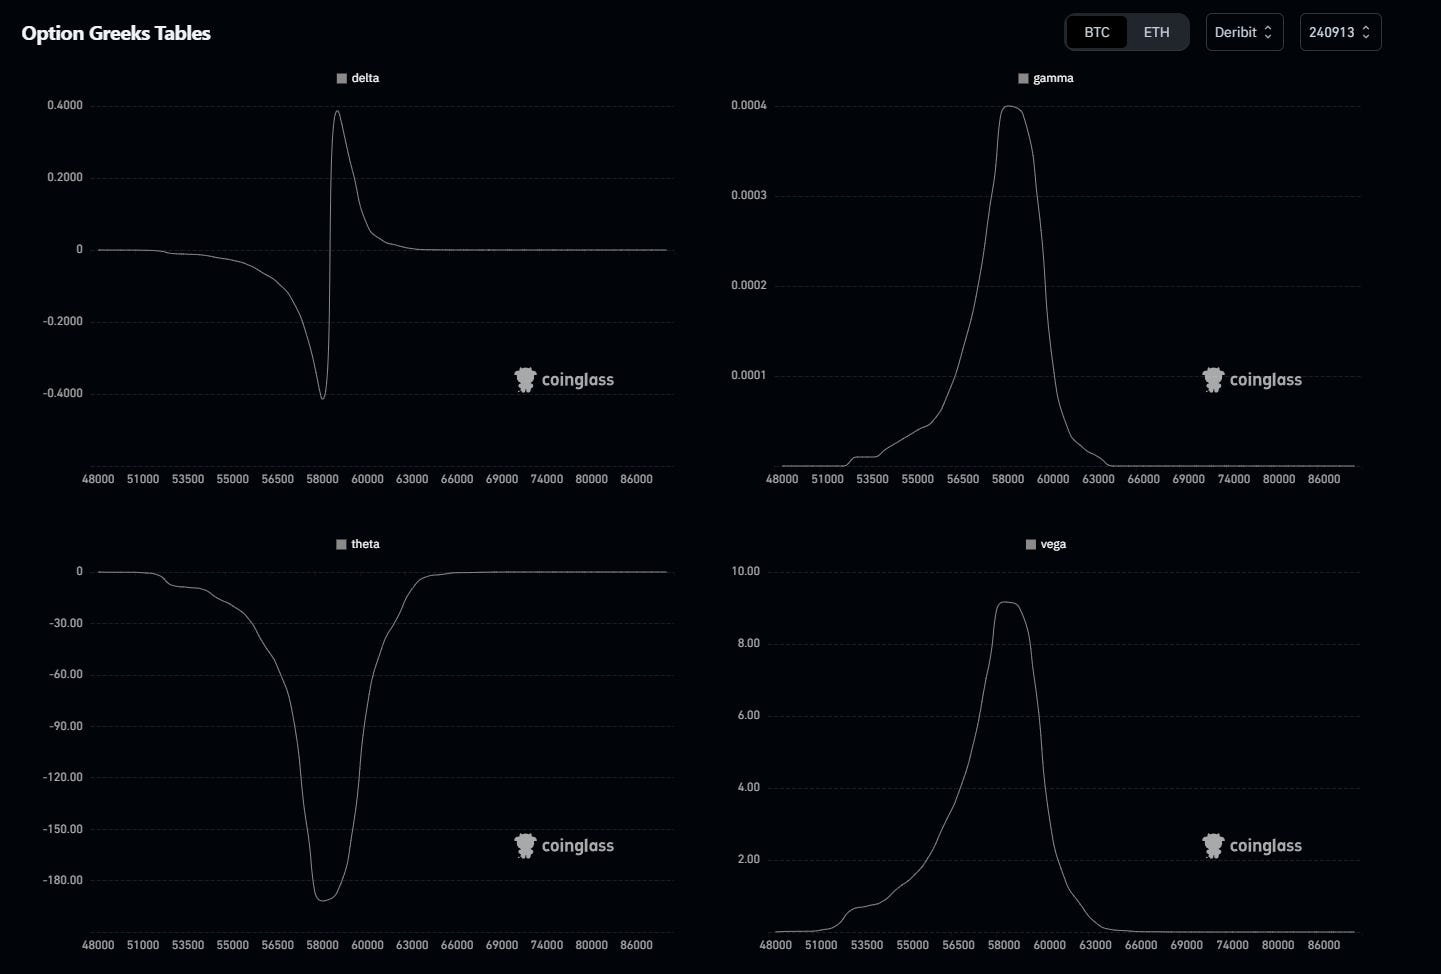
11. Greeks (Coinglass)
Introduction: Option Greeks measure the sensitivity of the option price to various factors such as underlying price, volatility, and time decay.
Today's Data Analysis:
Delta is near-zero, indicating that many option positions are balanced and neutral.
Gamma and Vega are showing significant spikes, suggesting traders are expecting sharp price movements and are positioning accordingly.
Conclusion: The elevated Vega and Gamma suggest the market is bracing for larger-than-expected price swings, but the neutral Delta implies no immediate directional bias.
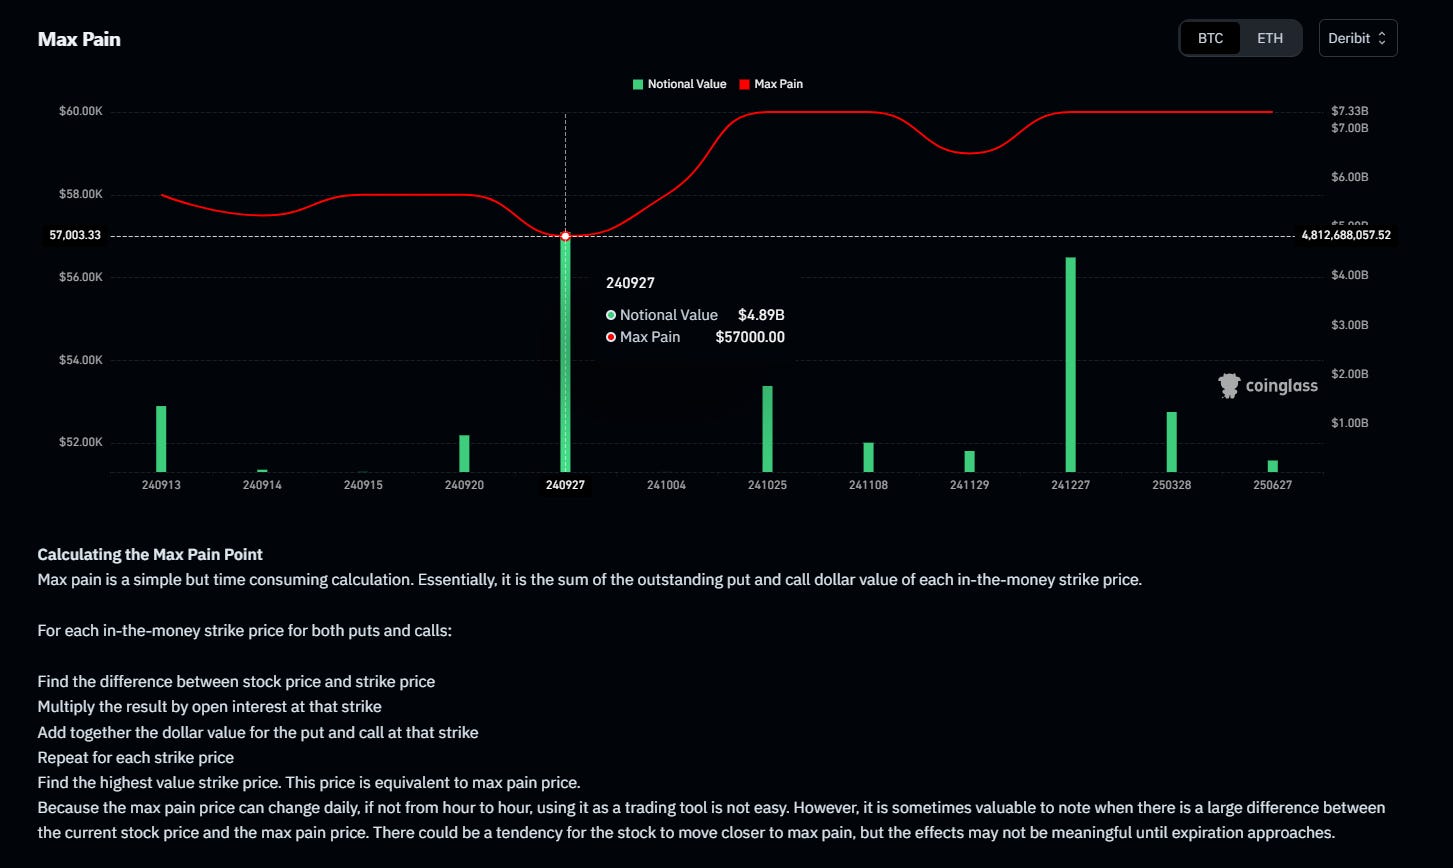
12. Max Pain (Coinglass)
Introduction: The Max Pain theory states that option sellers will try to manipulate the underlying price to maximize their profits by expiration, by keeping the price near the point where the greatest number of options expire worthless.
Today's Data Analysis:
The max pain point for September 27 is at $57,000, with a total notional value of $4.89 billion.
Conclusion: Max pain at $57,000 suggests option sellers might have an incentive to keep the price near this level as expiration approaches, limiting large price swings away from this point.
Today's Options Data Summary:
Overall, today's options data suggests a mixed sentiment in the market with slightly bearish undertones. ATM IV and HV are declining, indicating reduced volatility expectations, while the skew metrics continue to favor downside protection. Options open interest and flows suggest more activity around end-of-year expirations, with some positioning for volatility spikes.
Possible Impact on the Market in the Next 24 Hours:
In the short term, the market may experience reduced volatility and some consolidation, with no immediate signs of sharp directional moves.
Possible Impact on the Market by the End of the Week:
By the end of the week, any potential market-moving events could cause volatility to increase. However, based on current data, the market seems more likely to remain stable or experience minor downside corrections.
Sentiment Evaluation:
Bearish/Bullish Sentiment Score: 4/10
The overall market sentiment is leaning bearish, with skew metrics showing a preference for put options and downside protection.
BTC Futures Market Analysis: Key Levels Around $57,000 - Whale Activity Signaling Potential Moves
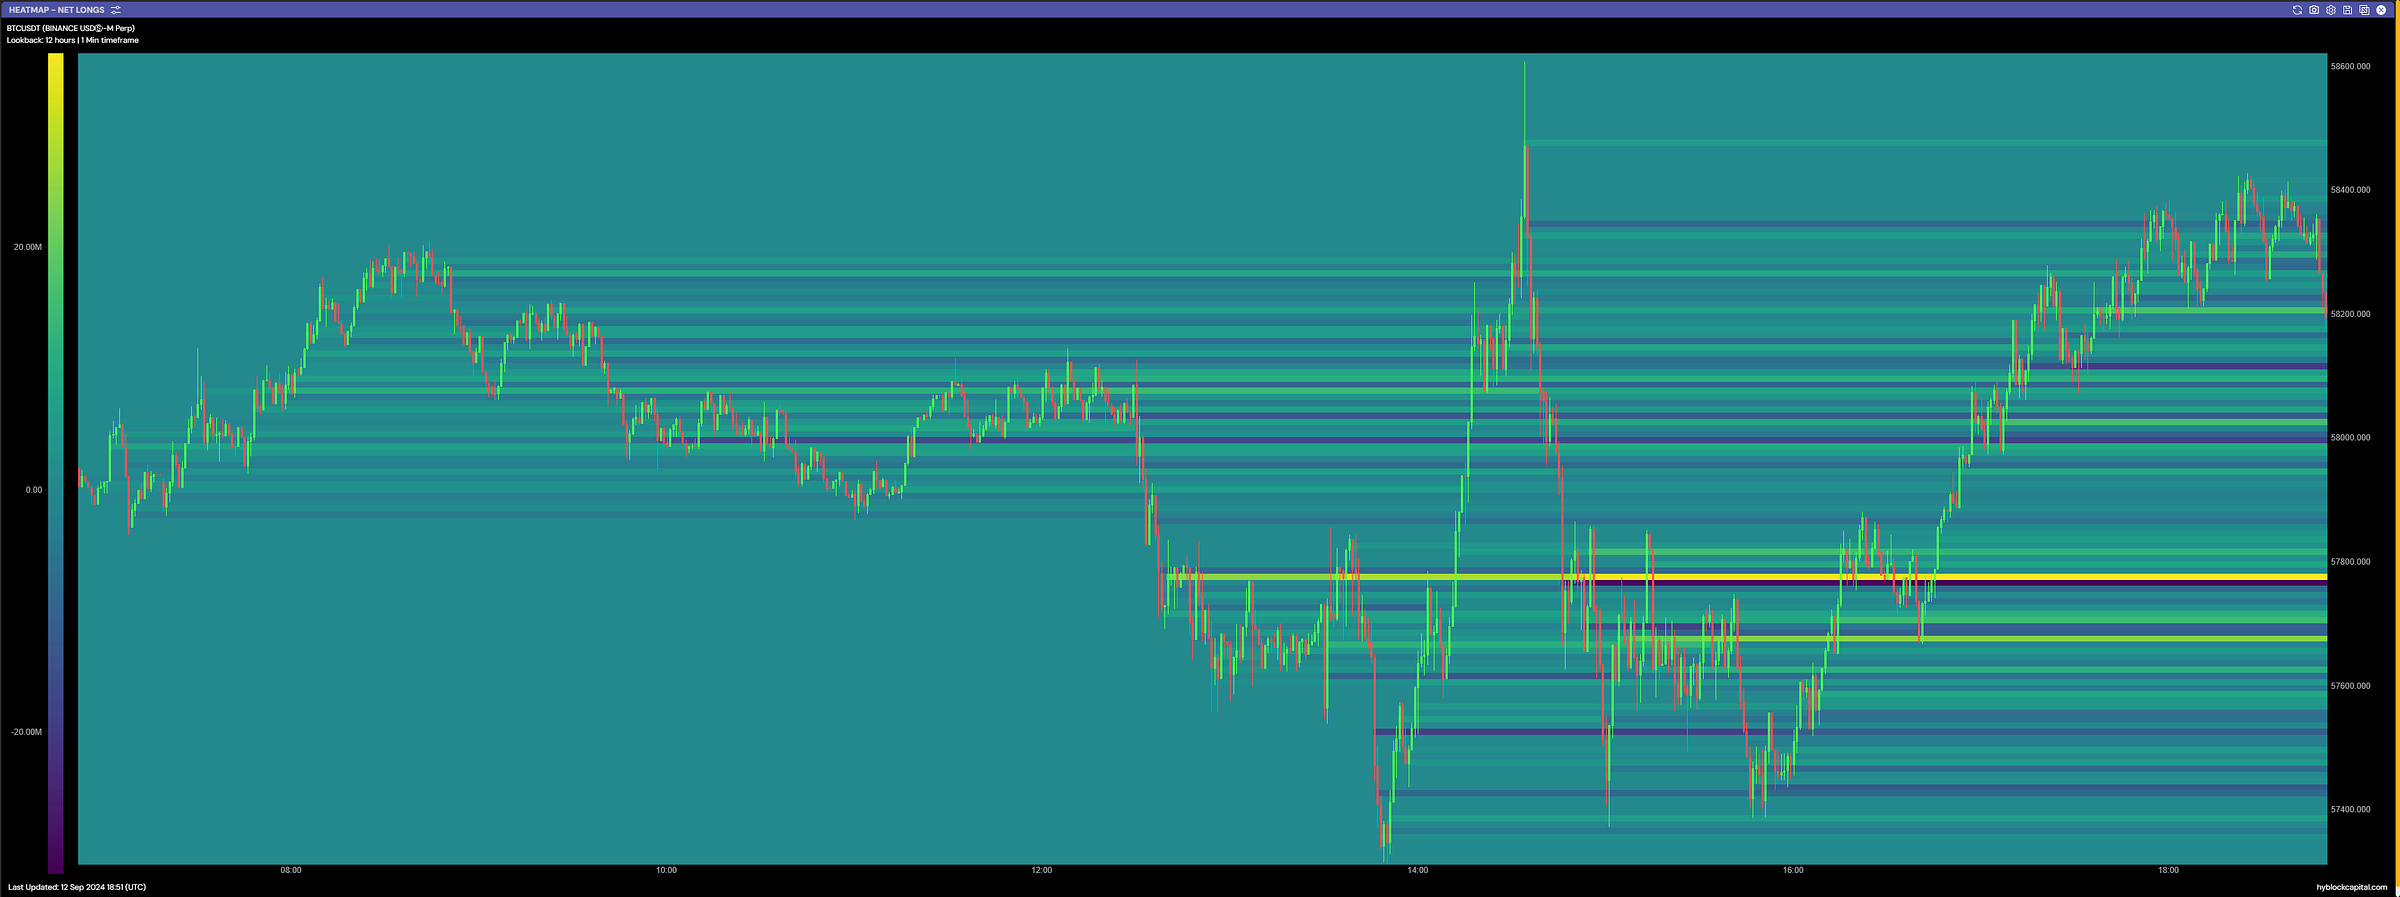
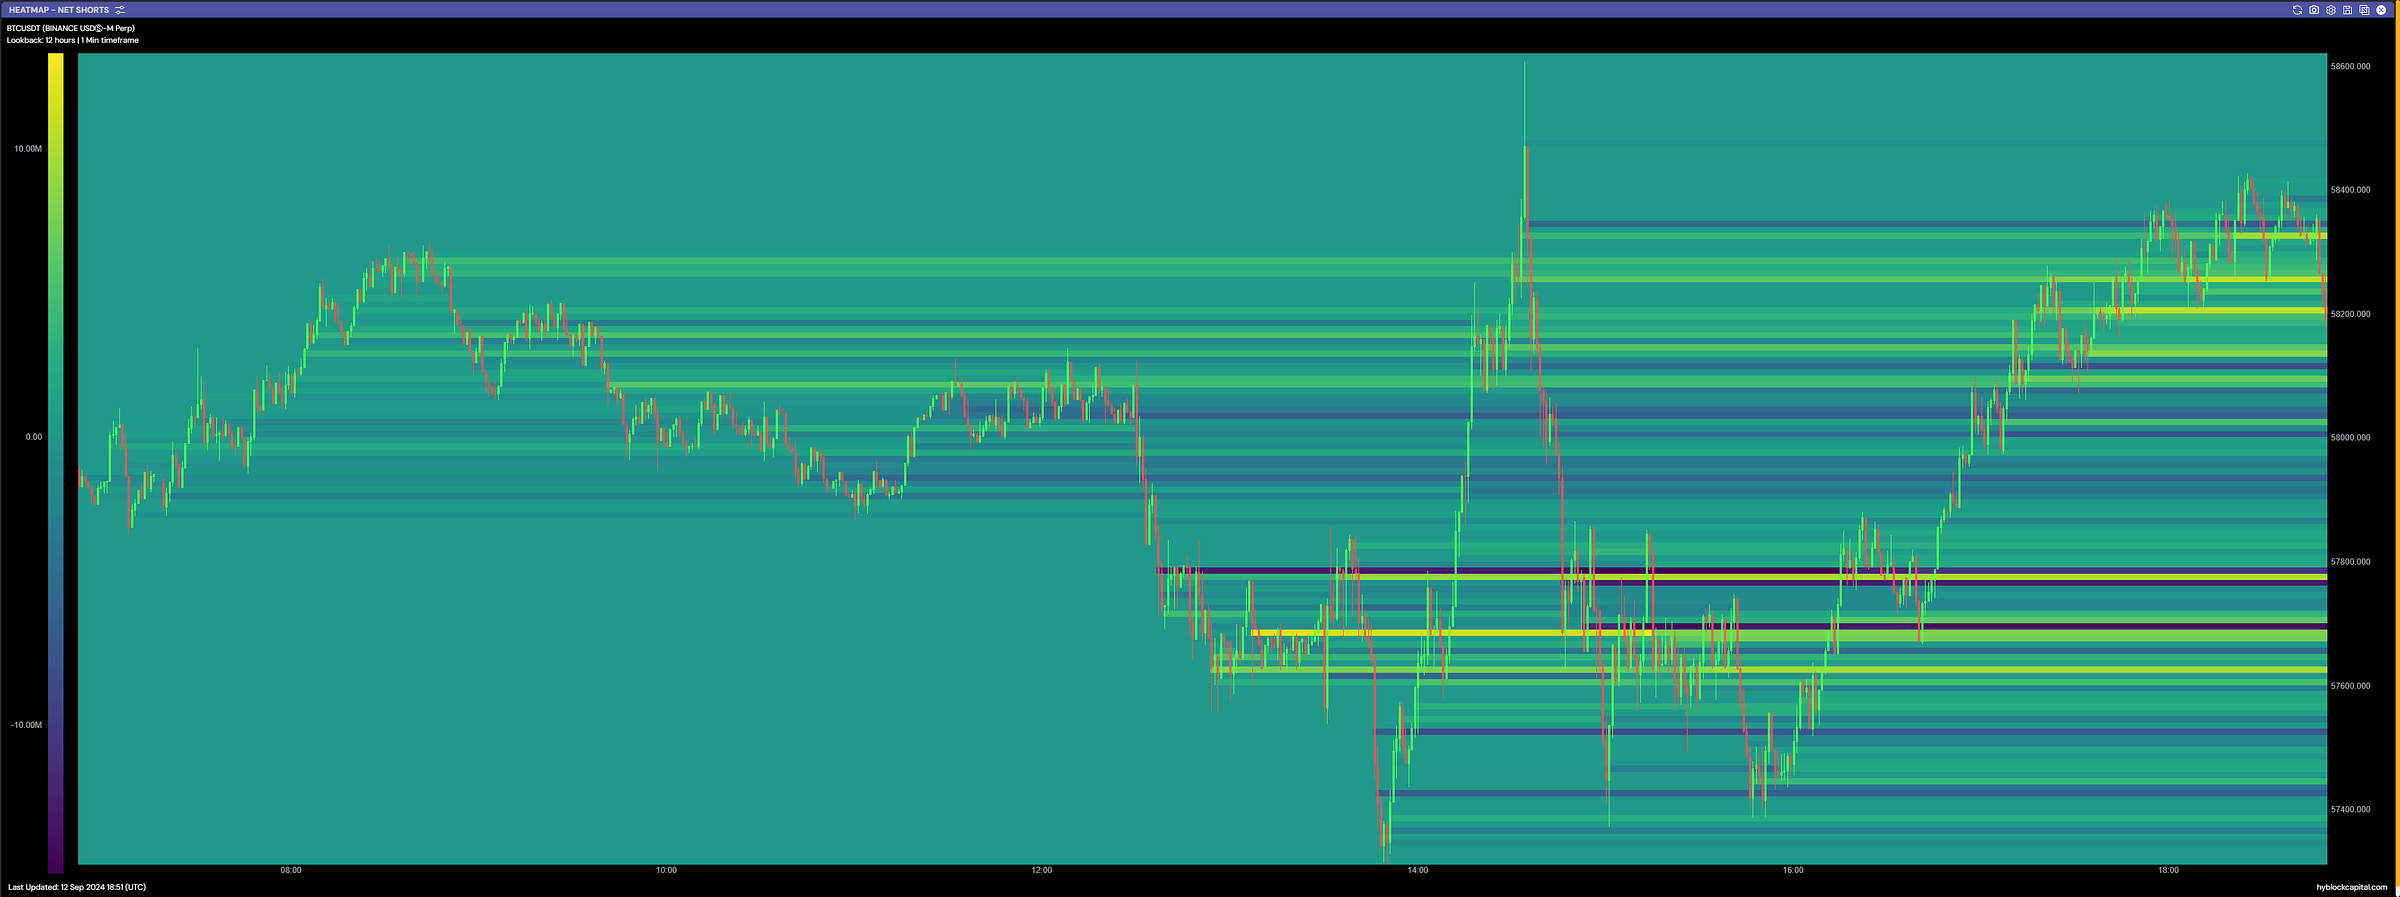
1. Analysis of Heatmaps for Net-Shorts and Net-Longs (Hyblock Capital)
Introduction: Net-long and net-short heatmaps display liquidity zones where traders have concentrated their long and short positions. These heatmaps are essential in identifying potential market pivot points.
Today’s Data Analysis:
Net-long positions are mostly concentrated between $57,500 and $58,000, suggesting strong buyer interest at this range.
Net-short positions are clustered between $55,000 and $56,000, indicating potential pressure from sellers expecting a price drop.
Conclusion: Traders have positioned themselves both above and below current price levels, with longs showing more aggressive behavior at higher ranges, while shorts dominate slightly lower levels.
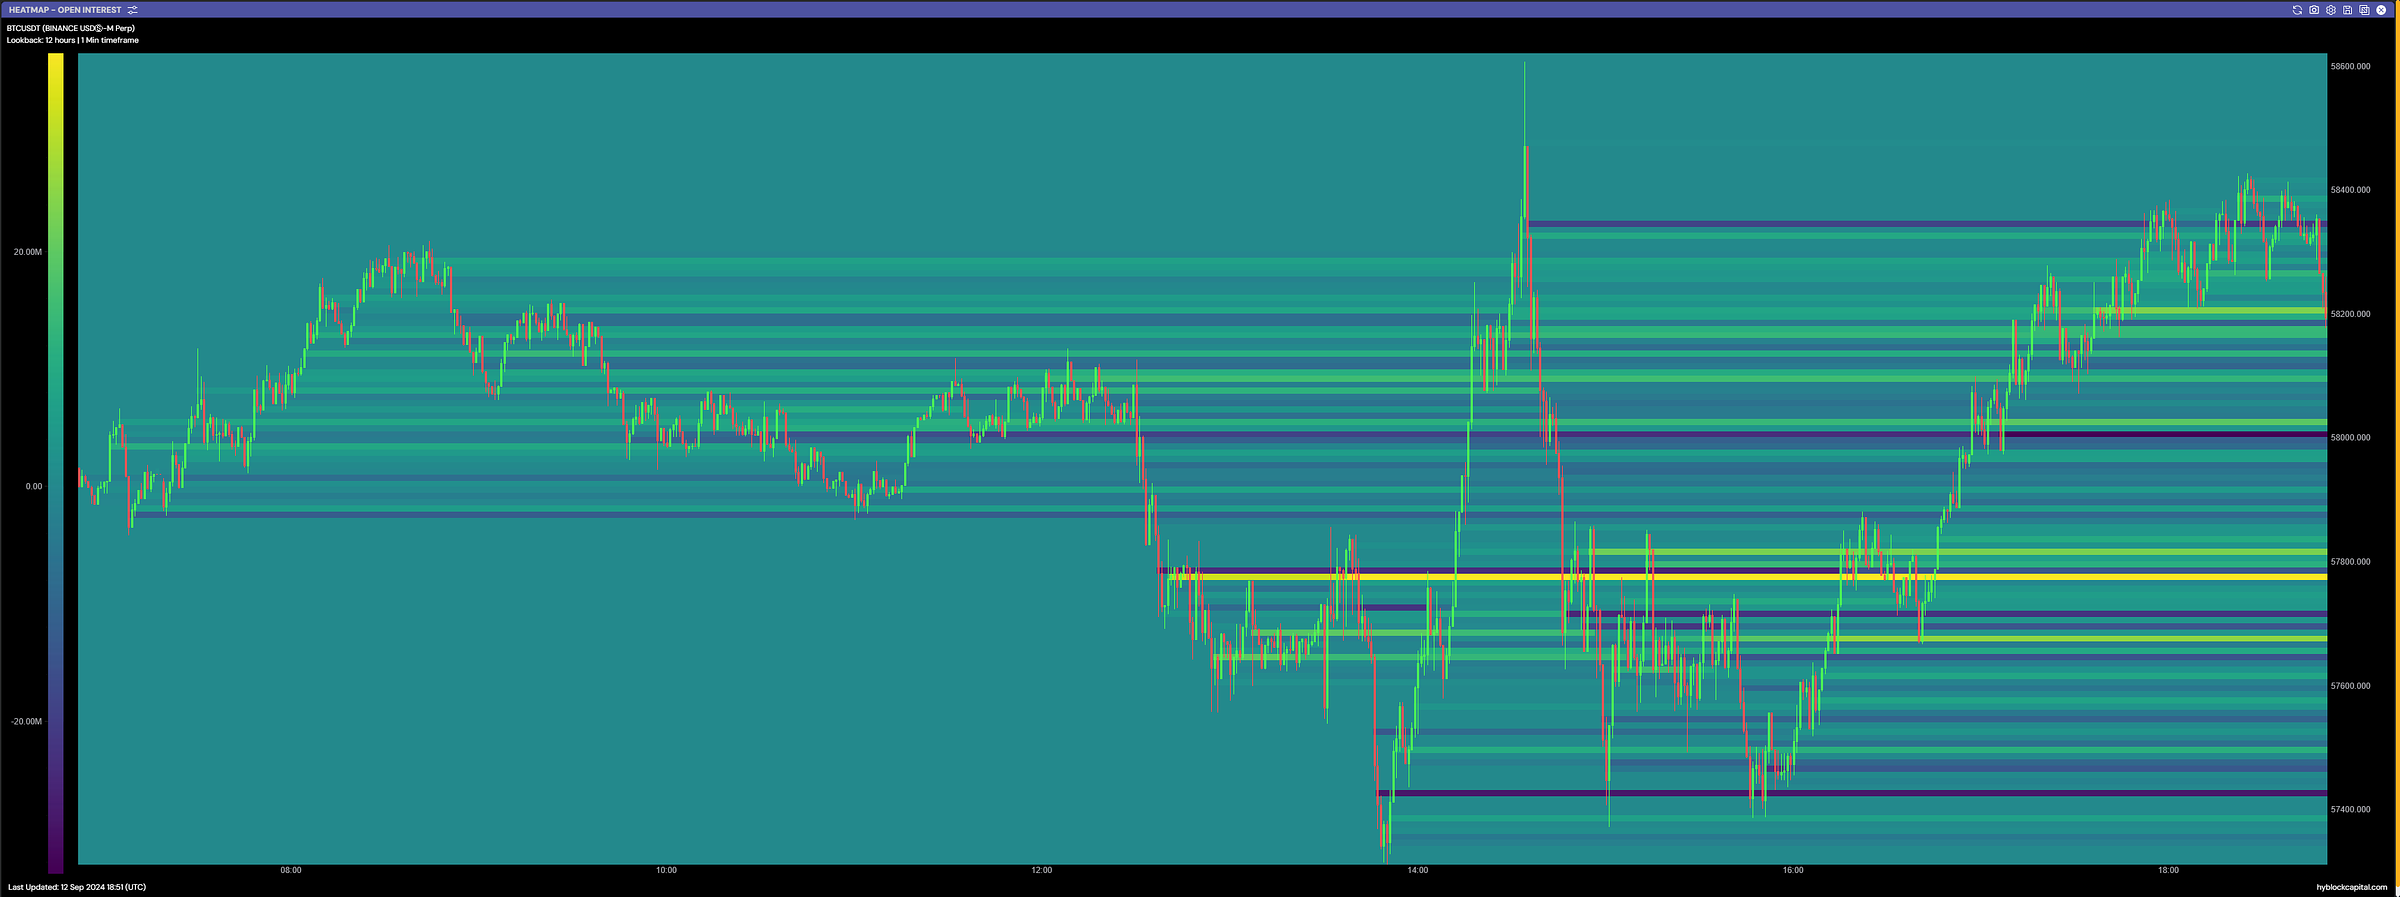
2. Heatmap Open Interest
Introduction: Open interest represents the total number of open futures contracts, providing insight into market participation and potential areas of volatility.
Today’s Data Analysis:
The largest accumulation of open interest is found between $56,800 and $57,200, suggesting this is a critical price range for traders.
A high concentration of open interest can increase volatility as the market moves around these levels.
Conclusion: The market is focusing its activity around $57,000. Any deviation from this level could lead to significant price movements due to the clustering of open contracts.
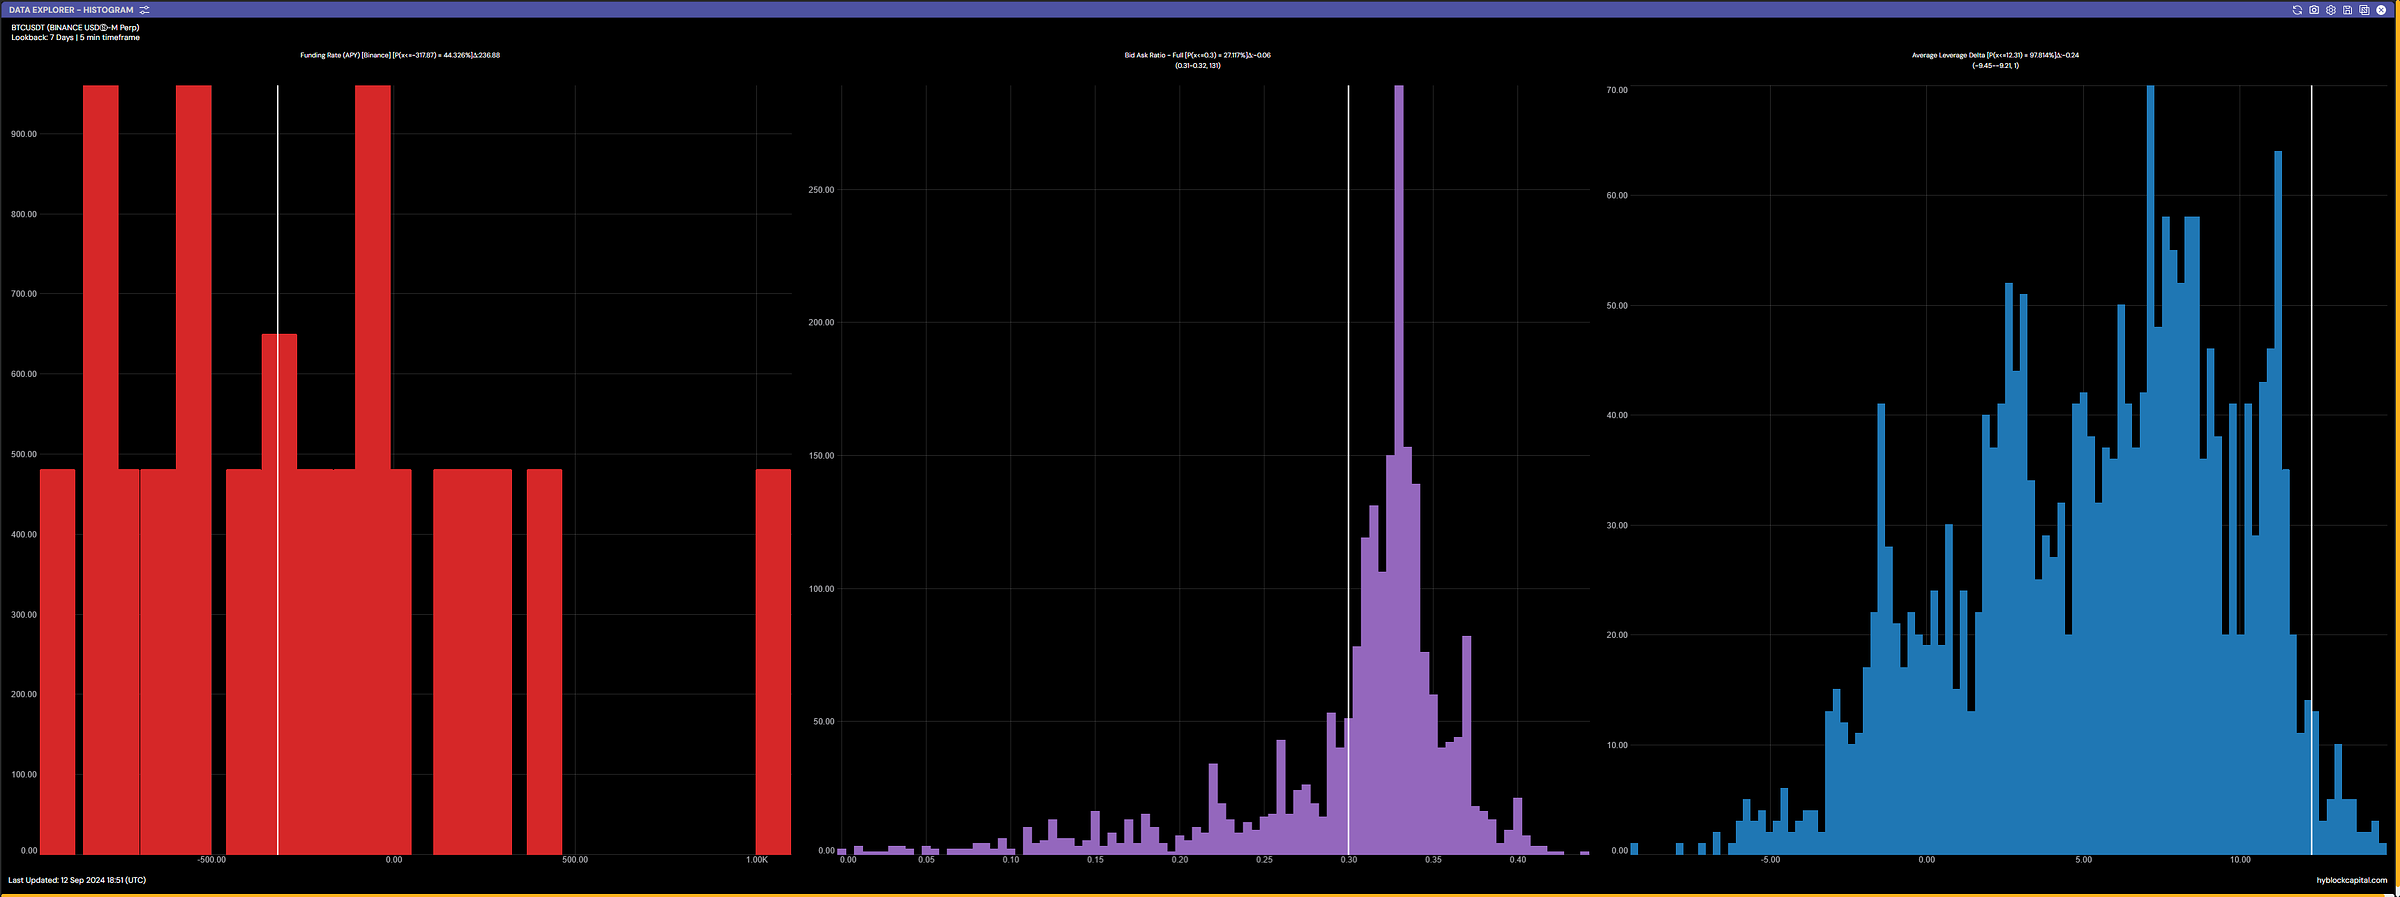
3. Funding Rate (APY) [Binance]
Introduction: The funding rate reflects the cost of holding a long or short position, with positive rates favoring shorts and negative rates benefiting longs. It provides insight into market sentiment and potential directional bias.
Today’s Data Analysis:
The funding rate is slightly negative at -4.32%, indicating that shorts are paying longs. This hints at a bearish sentiment in the market.
Conclusion: The slightly negative funding rate signals a bearish tilt in the market, though it's not strong enough to indicate overwhelming pessimism. Traders should keep an eye on shifts in this rate.
4. Bid Ask Ratio - Full
Introduction: The bid-ask ratio shows the balance between buy and sell orders at various price points, providing insight into market demand and supply.
Today’s Data Analysis:
The bid-ask ratio shows a significant amount of sell orders (bids) outweighing buy orders at current price levels. This suggests strong selling pressure between $57,500 and $58,000.
Conclusion: The market is under pressure from sellers at higher levels, but this could shift rapidly if buy-side liquidity increases in the lower price range.
5. Average Leverage Delta
Introduction: Average leverage delta measures how much leverage traders are using on average. Higher leverage means higher risk, and more volatility when liquidations occur.
Today’s Data Analysis:
Average leverage is concentrated between 5x and 10x, with some spikes showing traders taking even higher leverage positions.
The highest leverage is seen around $57,000, implying that traders are aggressively speculating at this range.
Conclusion: High leverage levels suggest that the market is prone to volatility, especially if prices deviate from the current levels around $57,000.
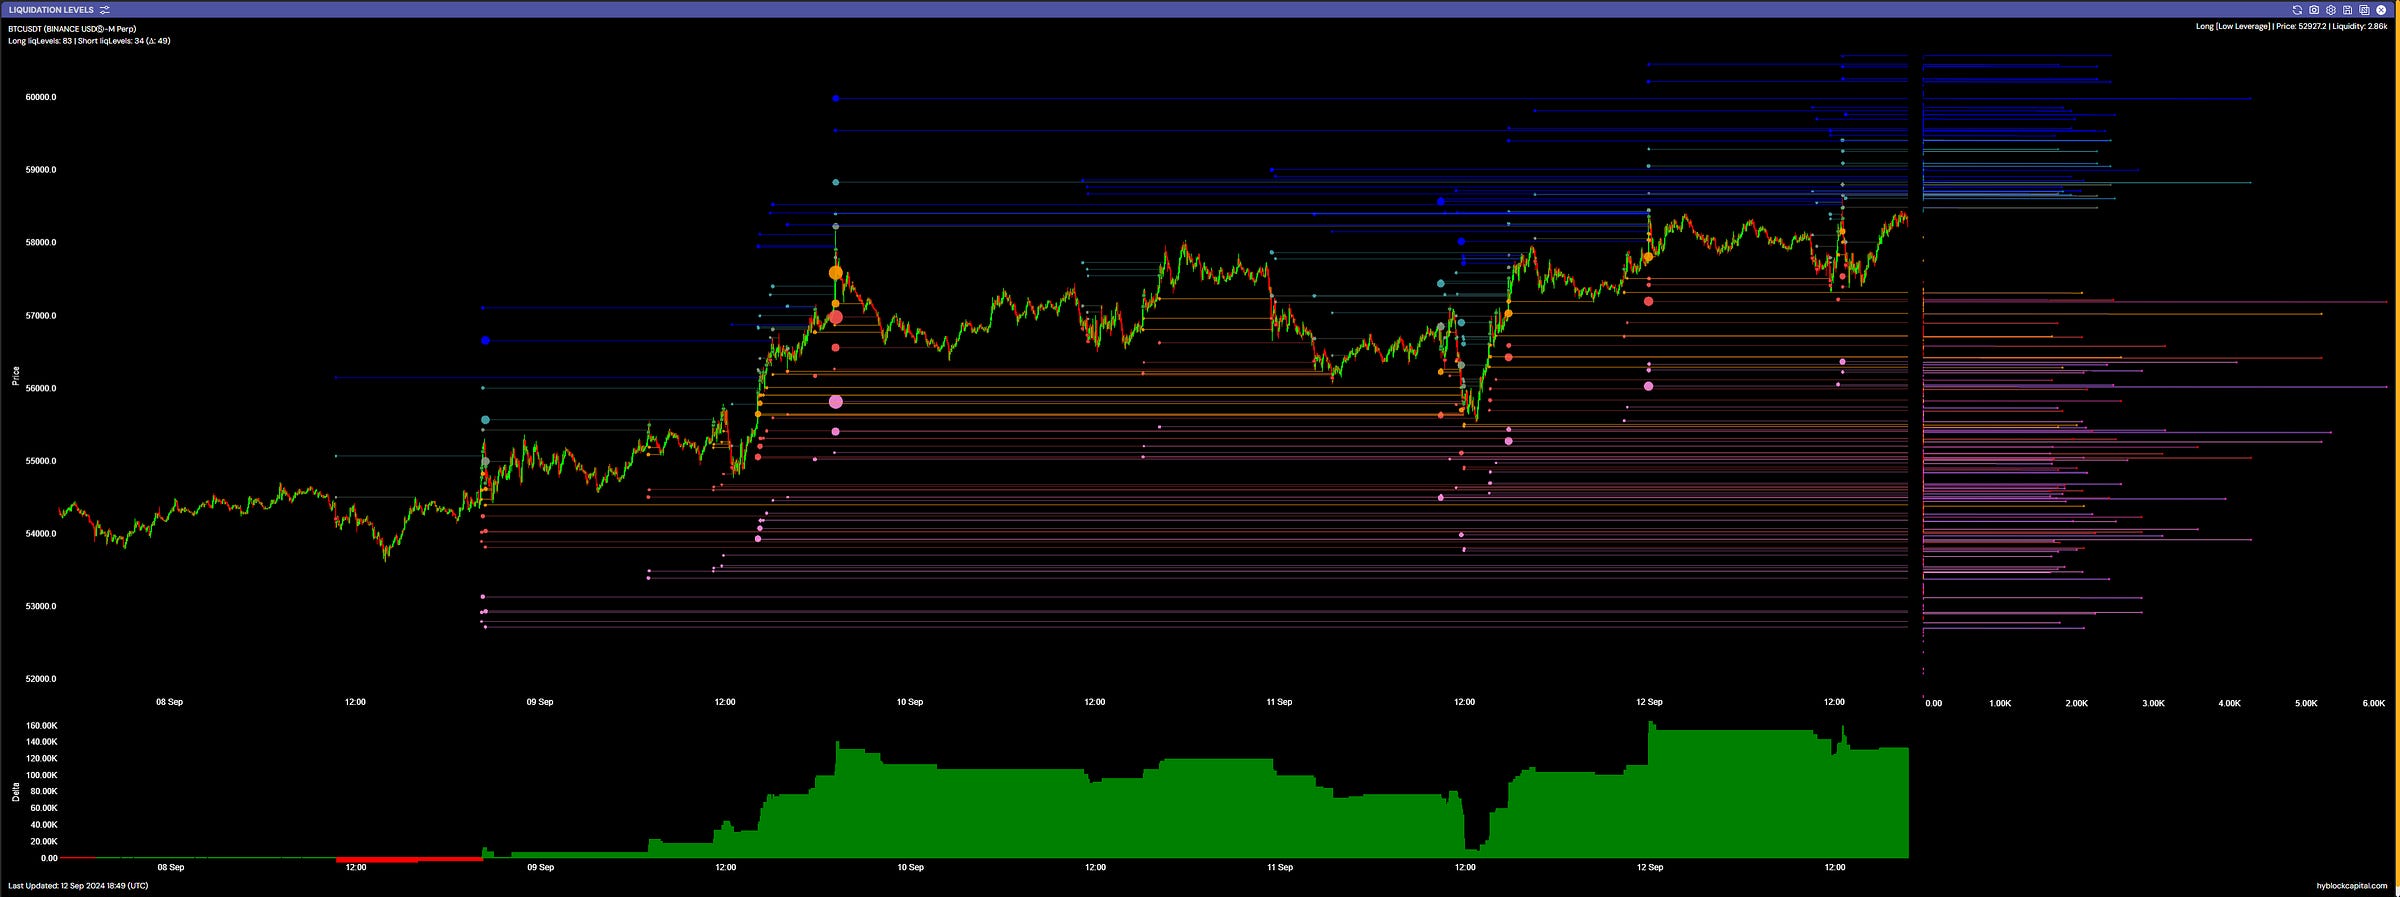
6. Liquidation Levels
Introduction: Liquidation levels mark the prices at which leveraged positions might be forcibly closed. This can lead to sudden price movements, known as liquidation cascades.
Today’s Data Analysis:
Long liquidation levels are concentrated around $58,000, with significant short liquidation levels below $55,000.
If price moves significantly beyond these zones, it could trigger forced liquidations, amplifying the price movement in the process.
Conclusion: Traders should be cautious of moves below $55,000, where short liquidations could push the price further down, or above $58,000, which might trigger long liquidations and accelerate a price drop.
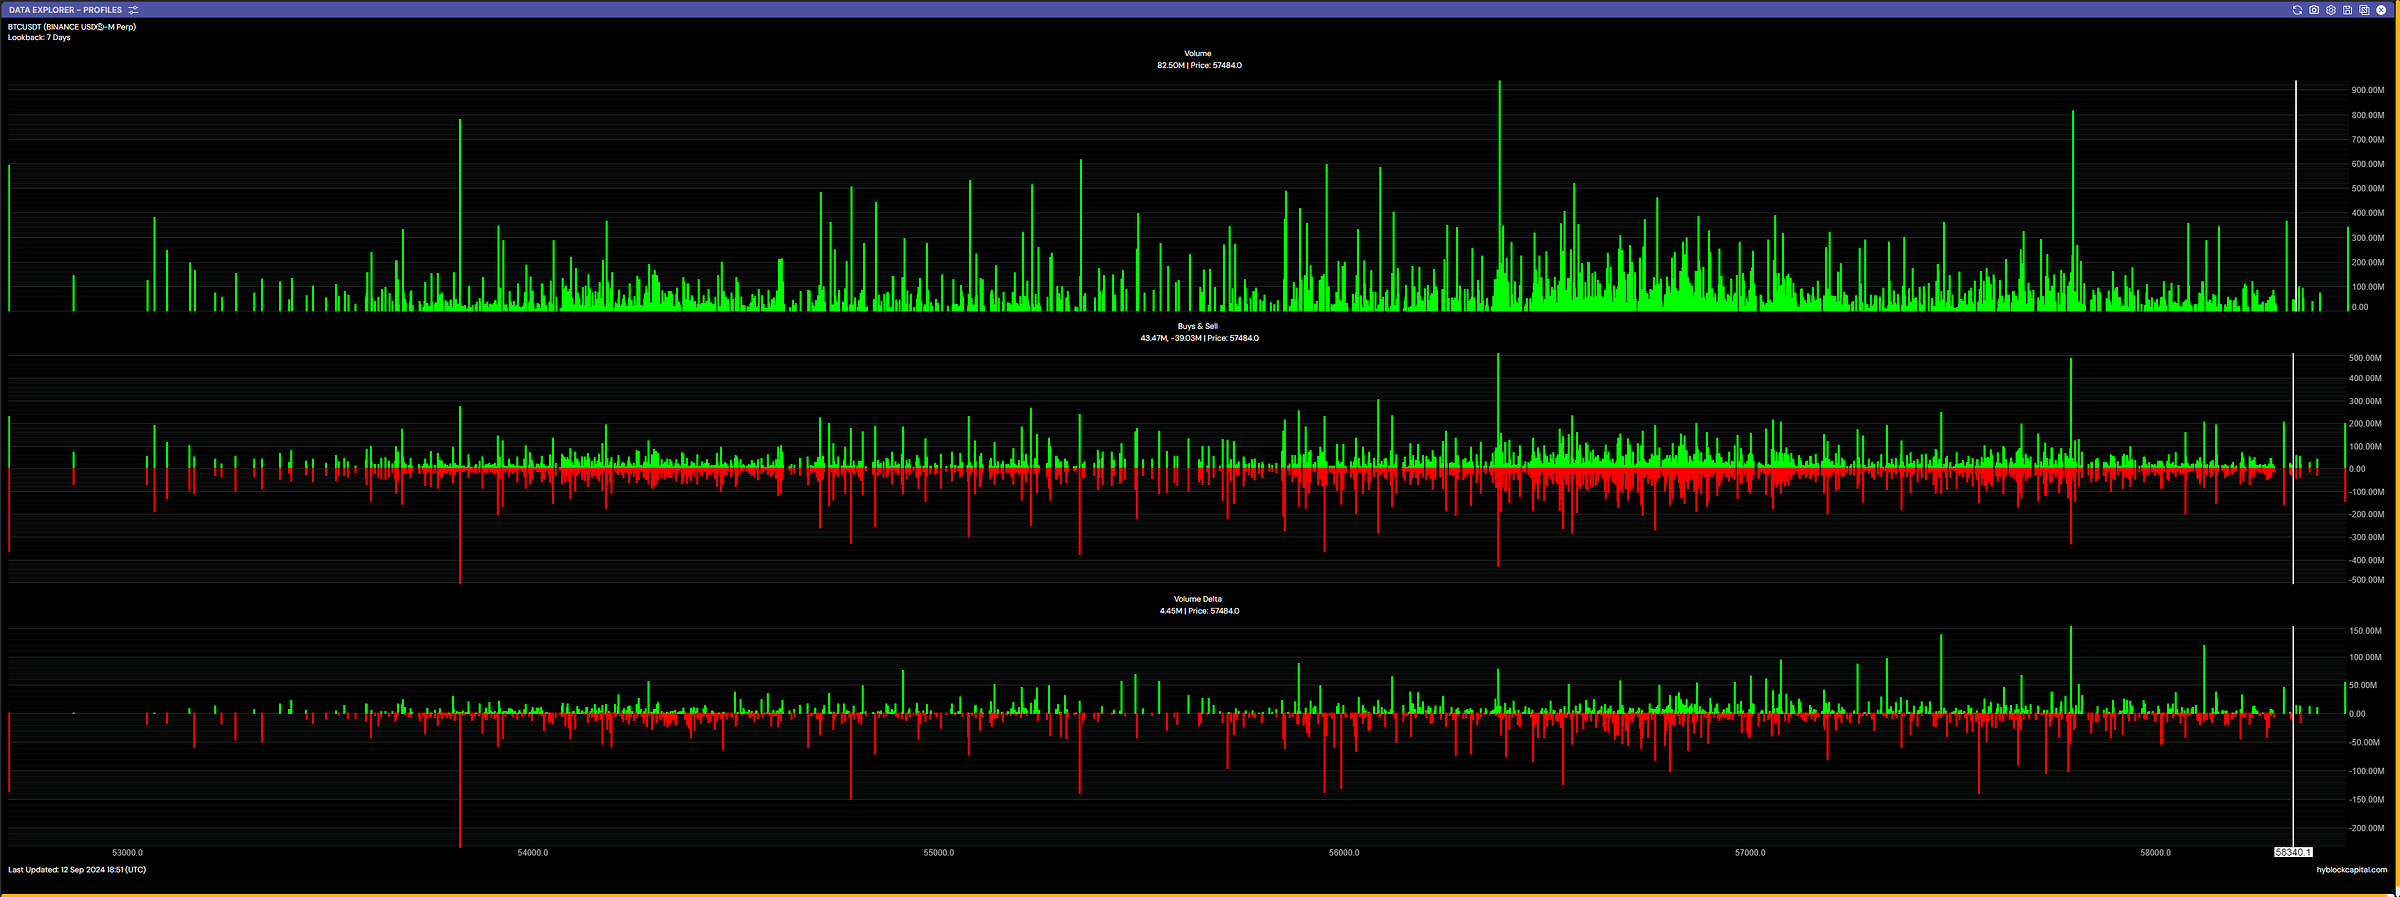
7. Volume
Introduction: Volume reflects the total number of contracts traded within a specific period and is a key indicator of market interest and strength behind a trend.
Today’s Data Analysis:
A significant volume spike was recorded around $57,000, suggesting that a lot of buying interest is concentrated around this level.
The current volume appears to be slightly decreasing, suggesting a pause or consolidation phase.
Conclusion: While there is strong support around $57,000 based on volume data, the decreasing volume suggests the market may be waiting for a catalyst to move prices decisively.
8. Buys & Sells
Introduction: Tracking the distribution of buy and sell orders provides insight into market sentiment and potential price directions.
Today’s Data Analysis:
There’s slightly more selling pressure as indicated by higher sell volumes around $58,000. Buyers are concentrated around $56,500 to $57,500, creating a tight range of activity.
Conclusion: The current market shows balanced but slightly more aggressive selling above $57,000. Buyers are still active but less aggressive.
9. Volume Delta
Introduction: Volume delta is the difference between buying and selling volume. A positive delta indicates more buying pressure, while a negative delta shows more selling.
Today’s Data Analysis:
The volume delta today is slightly negative, showing that sellers are maintaining a slight edge over buyers.
Conclusion: Sellers appear to be holding the upper hand, but the margin is not substantial enough to indicate a strong directional bias.
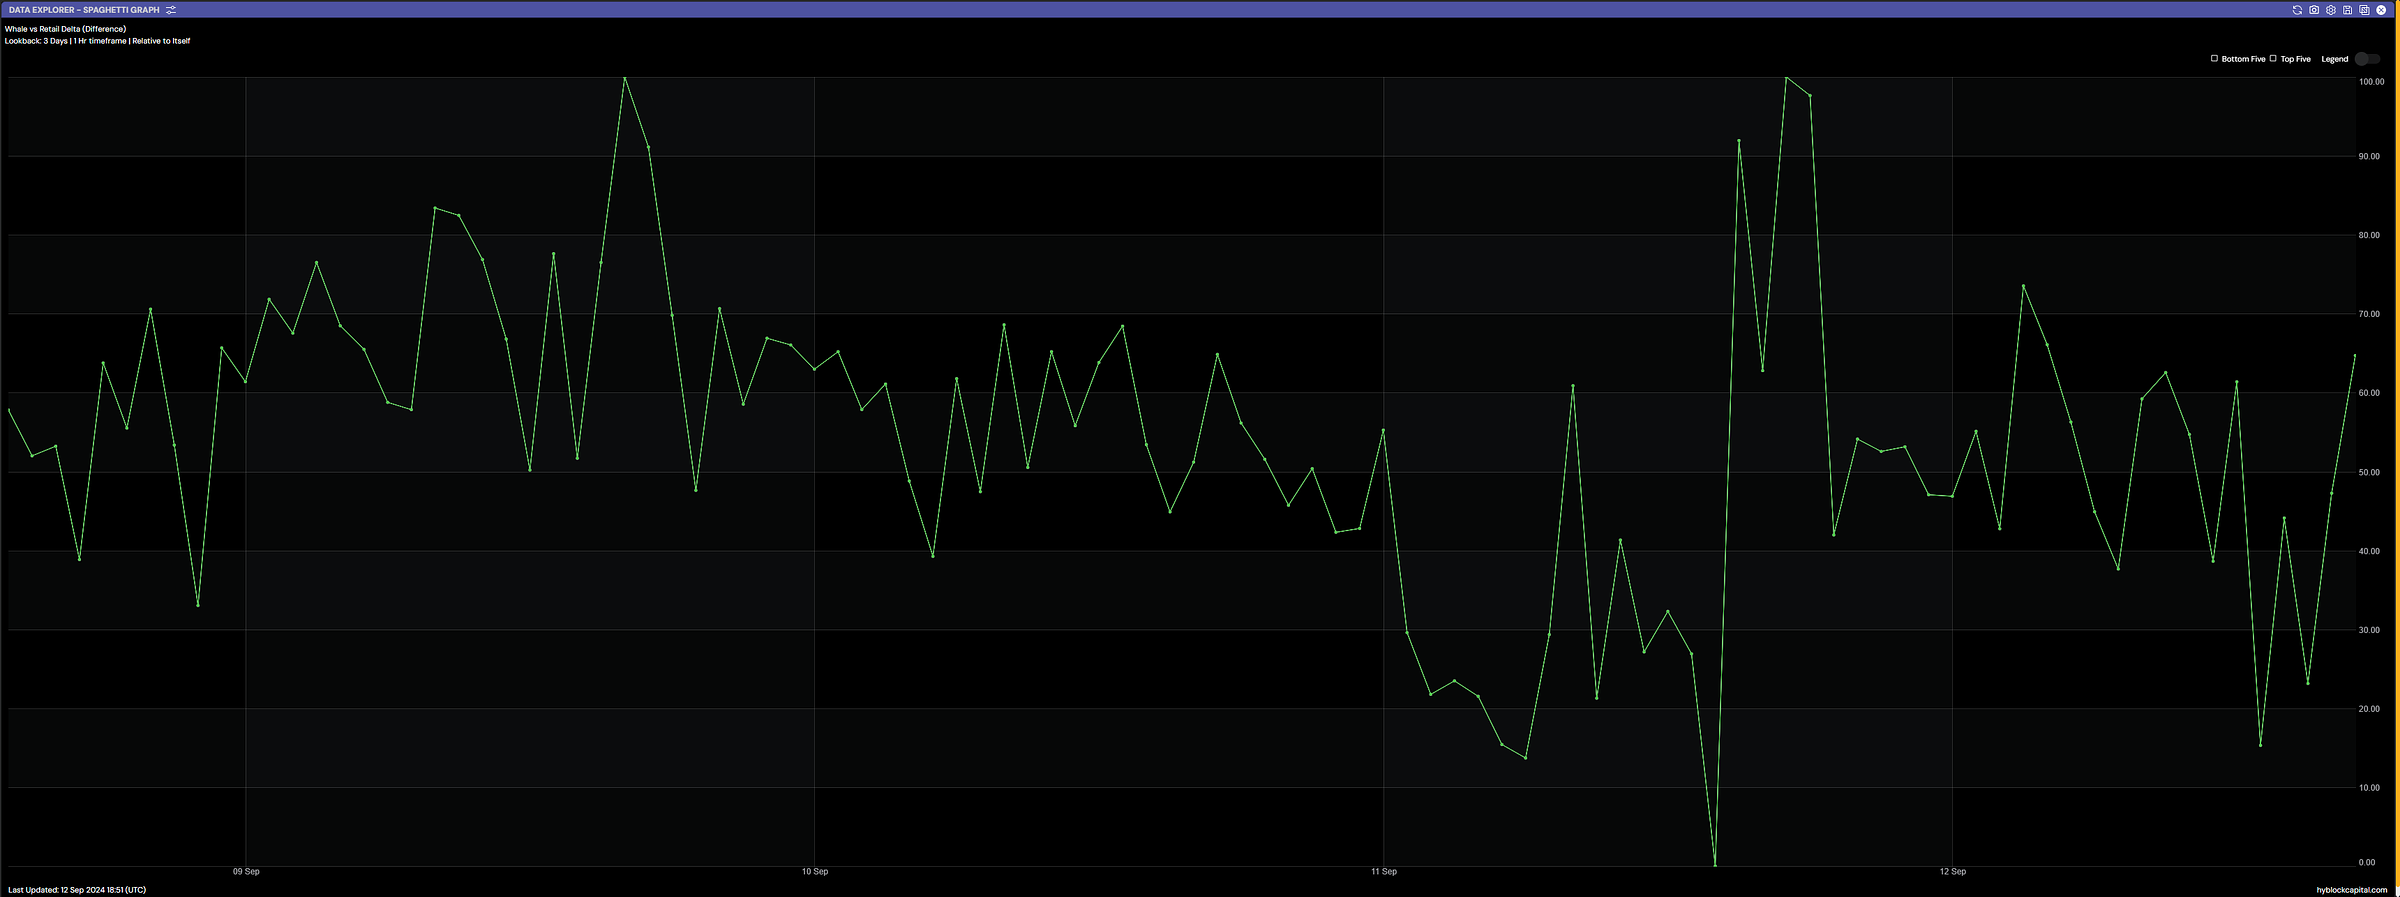
10. Whale vs Retail Delta (Difference)
Introduction: This metric compares the trading activity of large institutional players (whales) to retail traders, helping us understand if big players are leading the market.
Today’s Data Analysis:
Whale activity has increased significantly over the last few hours, indicating that large players are positioning themselves. Retail activity remains relatively moderate.
Conclusion: Whale activity is a key signal that larger moves may be on the horizon. The increased involvement of large players could push the market in either direction, with retail traders likely to follow.
Today’s Futures Data Summary:
Market positioning is highly concentrated around $57,000, with significant liquidity on both the long and short sides.
Funding rates are slightly bearish, indicating a minor tilt toward sellers.
Whale activity is increasing, and volume spikes suggest strong interest in this price range.
High leverage levels and concentrated liquidation zones increase the risk of volatility in the near term.
Possible Impact on the Market in the Next 24 Hours:
The market may experience increased volatility as it hovers near the $57,000 range. High leverage and liquidation levels suggest that a break above or below this range could lead to rapid price movements. Short-term traders should remain cautious.
Possible Impact on the Market by the End of the Week:
By the end of the week, if the current patterns hold, we could see the market break out of the $57,000 range, either triggering a push towards $60,000 or dropping down to $55,000 due to liquidation cascades.
Sentiment Evaluation:
Sentiment Rating: 4/10 (slightly bearish)
If you want to professionally analyze the #BTC futures market and not just guess but truly understand the market sentiment, then subscribe to @hyblockcapital! The platform with alpha data.
Thanks to Hyblock's sponsorship (free subscription), I am able to offer you this analysis today.
Use my referral link if you want to subscribe to Hyblock: https://hyblockcapital.com/referer/TqoP2l
Comprehensive Bitcoin Spot Market Analysis: Short-Term Bullish Momentum Amid Overbought Conditions
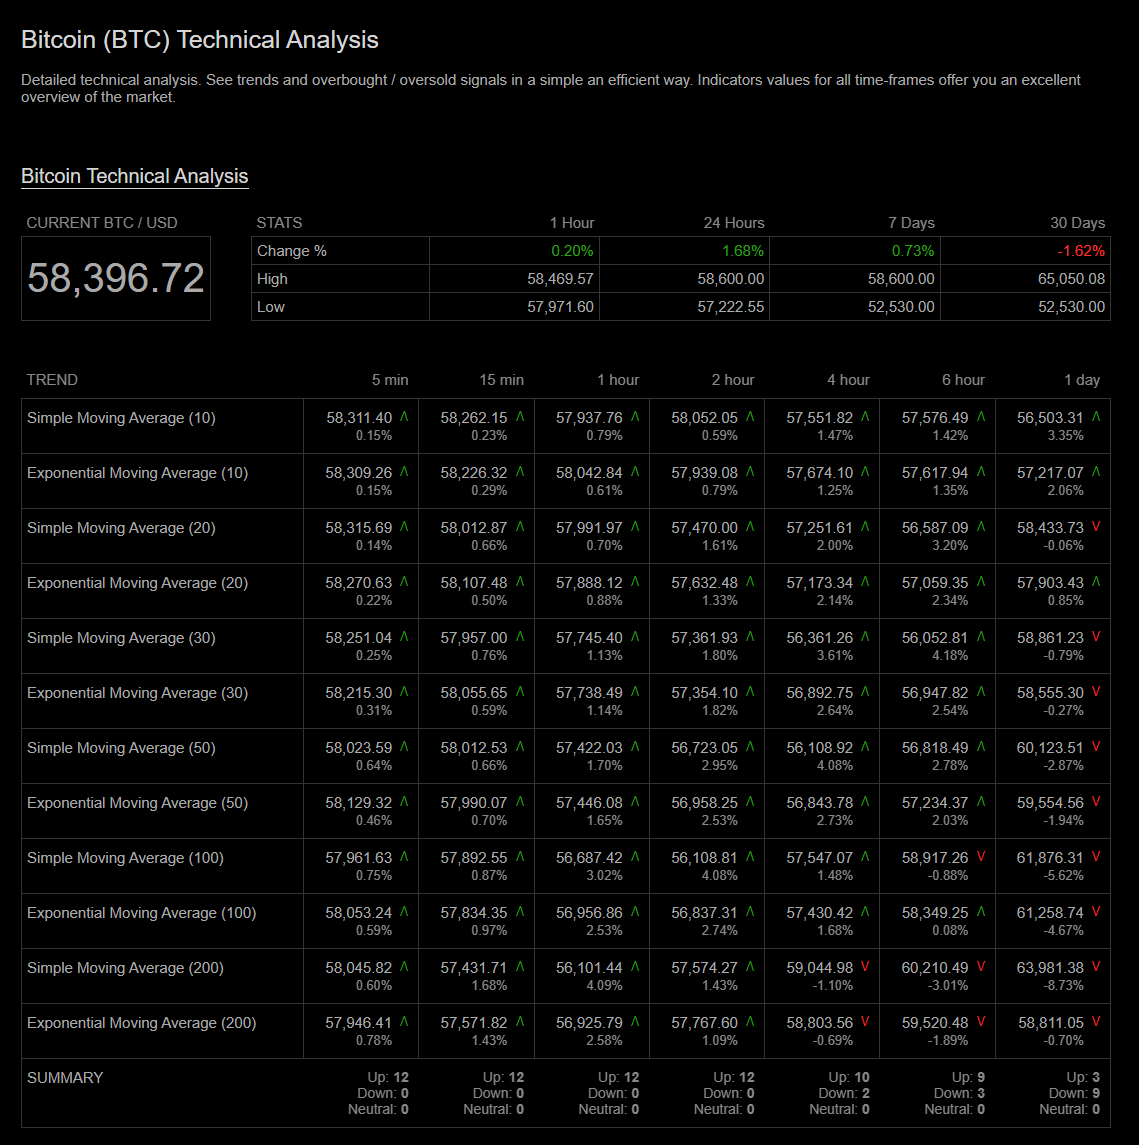
1. Trend Indicators (Coinalyze)
Introduction:
Trend indicators help in understanding the general market direction by analyzing moving averages. These are essential in identifying momentum, reversals, and potential entry/exit points for trades.
Today’s Data Analysis:
The data shows various timeframes for moving averages, both simple and exponential, for periods ranging from 5 minutes to 1 day. Across shorter intervals like 5 to 15 minutes, all moving averages are pointing upward, reflecting short-term bullish momentum. The 1-hour and 4-hour intervals also show bullish trends, while the 1-day average hints at a slight decline (-1.62% on the 30-day simple moving average), indicating that on a longer-term scale, the market may have been bearish recently but is recovering.
Conclusion:
The short-term trend indicates bullish momentum with positive moving averages across shorter timeframes. However, the 30-day moving average suggests cautious optimism due to a broader recent decline.
2. Overbought/Oversold Indicators (Coinalyze)
Introduction:
Overbought/oversold indicators like RSI, Stochastic, and CCI gauge whether the asset is overvalued or undervalued, providing clues on potential reversals.
Today’s Data Analysis:
RSI levels are mostly neutral across timeframes, with no indication of extreme conditions. Stochastic shows an overbought condition (above 80) for timeframes from 15 minutes to 6 hours, signaling short-term buying pressure. The Commodity Channel Index (CCI) also indicates overbought conditions in the 1-hour and 2-hour windows.
Conclusion:
While RSI remains neutral, the overbought readings from Stochastic and CCI over shorter timeframes suggest that there may be a short-term pullback or correction after the recent price increases.
3. Latest Candlestick Patterns (Coinalyze)
Introduction:
Candlestick patterns help traders identify potential reversals and continuations in price movements based on historical price action.
Today’s Data Analysis:
Notable patterns include the Hikkake Pattern (15min and daily), Marubozu (2-hour), and Engulfing Pattern (30min). The presence of multiple Marubozu patterns indicates strong momentum in the direction of the trend. The Hikkake pattern could indicate a reversal if price breaks out of a certain range.
Conclusion:
The Marubozu patterns suggest continued momentum, likely to the upside, while the Hikkake pattern may hint at a potential breakout or reversal, depending on price action in the coming hours.
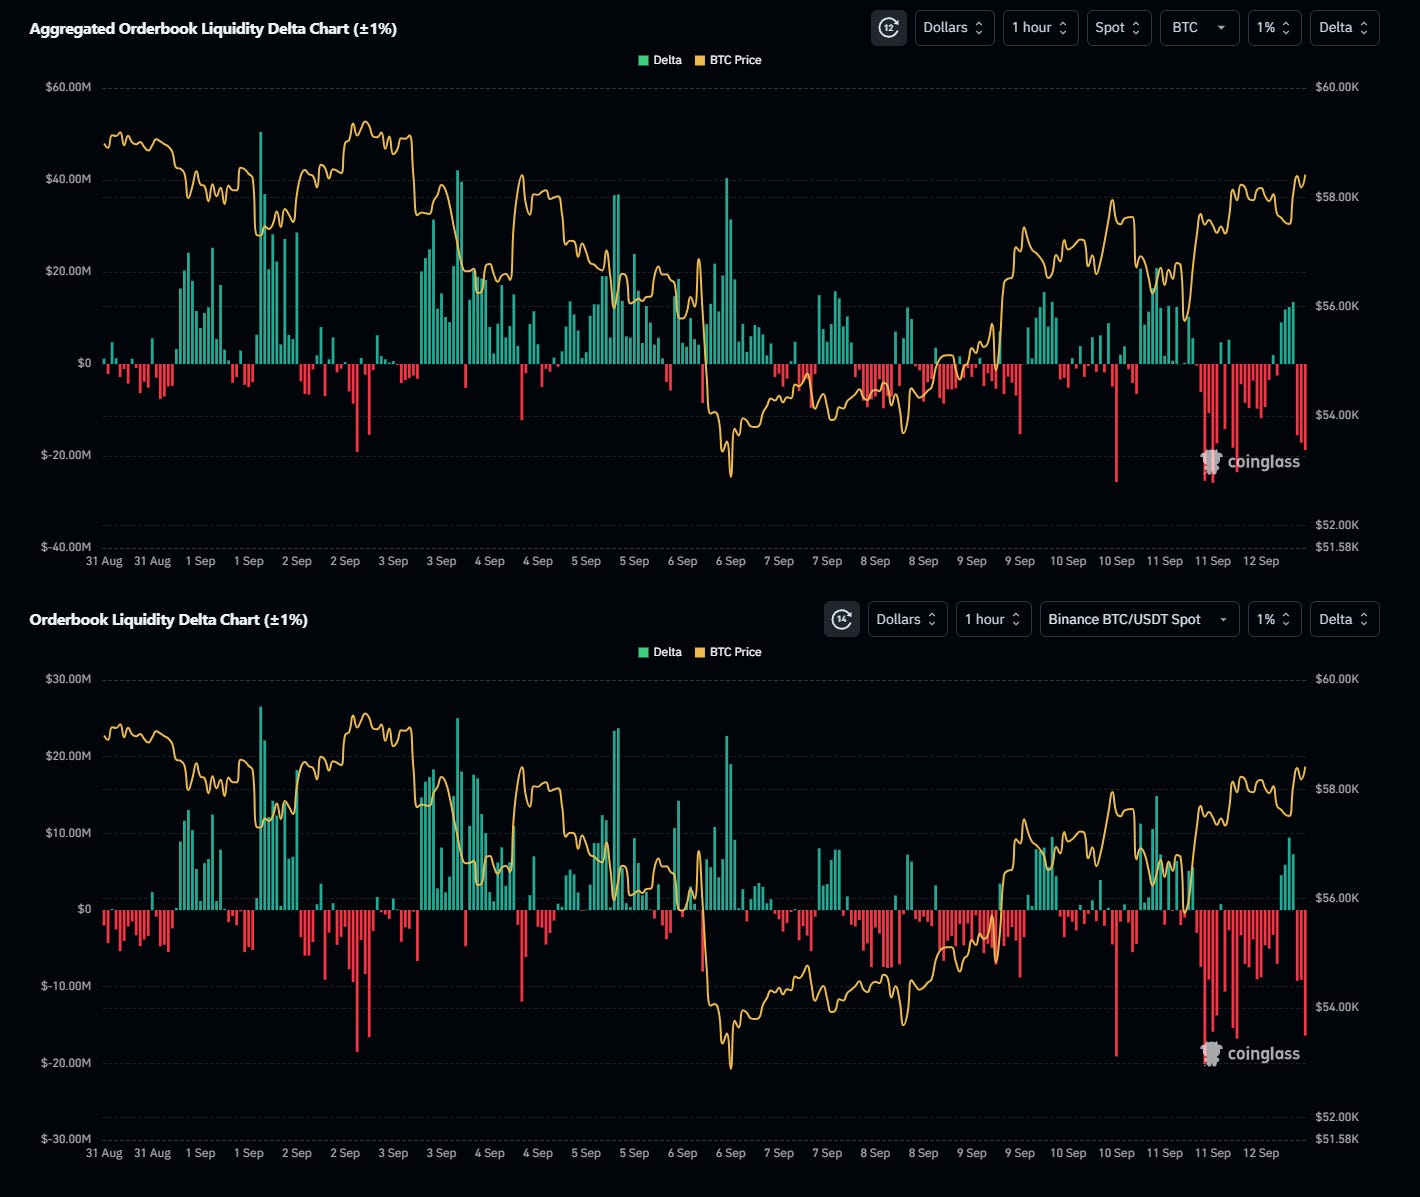
4. Aggregated Orderbook Liquidity Delta Chart (±1%) (Spot) (CoinGlass)
Introduction:
The liquidity delta chart shows the balance of buy and sell orders close to the current price, giving insight into market depth and potential pressure zones.
Today’s Data Analysis:
The aggregated liquidity chart shows mixed deltas, with fluctuations between buy and sell pressure. The orderbook depth reflects strong support and resistance zones around the $58,000 range, with some large swings in liquidity seen in the past 24 hours.
Conclusion:
The liquidity data suggests potential volatility as significant liquidity fluctuations indicate an imbalance between buy and sell orders, especially around the $58,000 mark.
5. Orderbook Liquidity Delta Chart (±1%) (Spot) (Binance BTC/USDT) (CoinGlass)
Introduction:
This chart focuses on the liquidity on Binance, a leading spot exchange, and provides insights into specific market conditions there.
Today’s Data Analysis:
Similar to the aggregated chart, the Binance orderbook shows substantial liquidity shifts, with major buy walls forming at around $58,000 and significant sell walls slightly above that level.
Conclusion:
The Binance liquidity chart reflects a battle between bulls and bears, with a concentration of buy orders suggesting strong support at the $58,000 range, while sell orders slightly higher could cap upside movement.
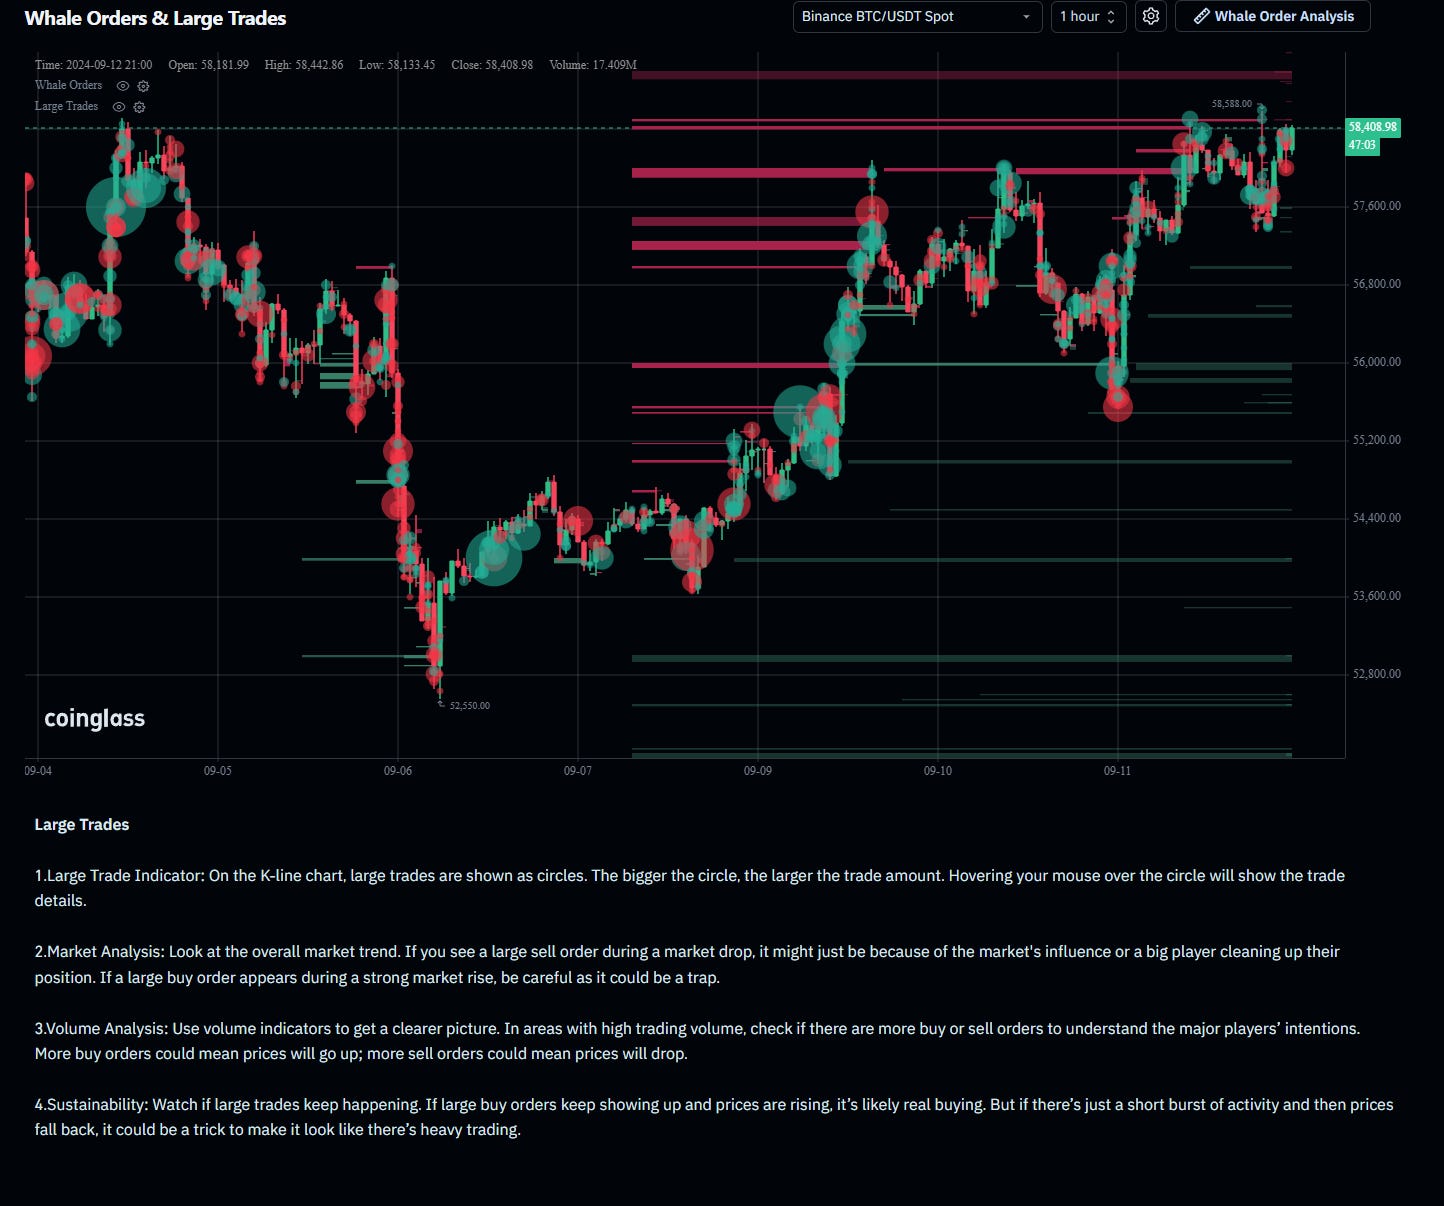
6. Whale Orders & Large Trades (Binance BTC/USDT) (CoinGlass)
Introduction:
Whale orders and large trades are important in identifying the activity of big players in the market, which can signal major price movements.
Today’s Data Analysis:
The whale trade chart shows clusters of large buy and sell orders at critical price points. There is significant buy-side activity in the $57,500 to $58,400 range, indicating strong interest from large players to buy in at these levels.
Conclusion:
Whale activity indicates a potentially bullish outlook as large buy orders are clustered around current prices, showing confidence in price stability or possible upward movement.
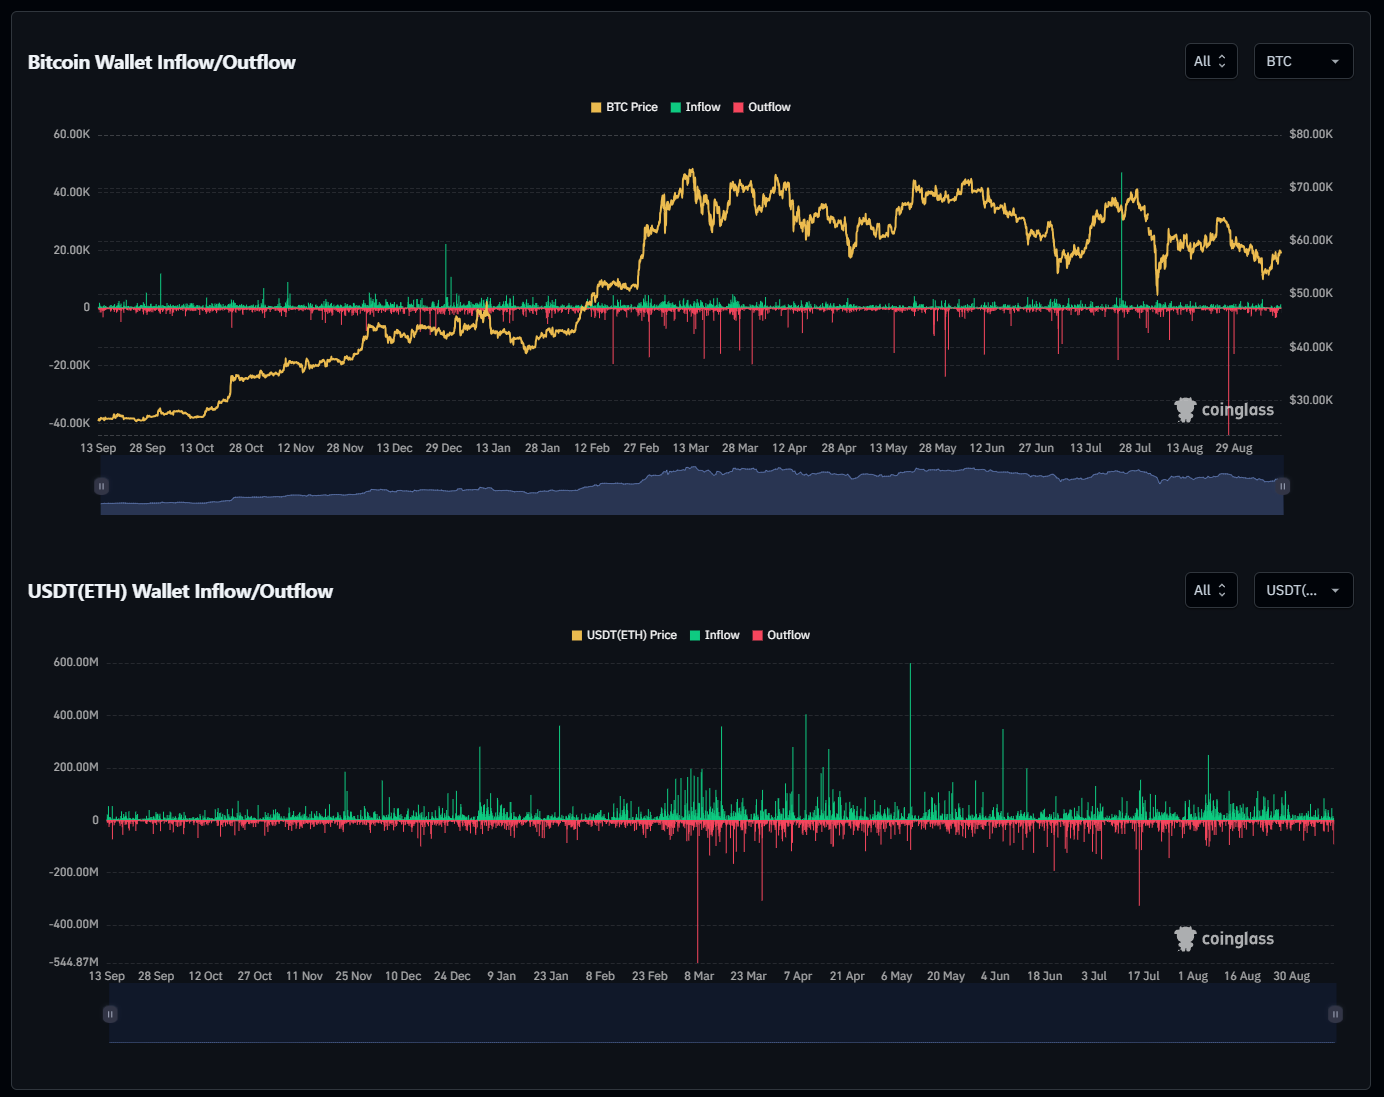
7. Bitcoin Wallet Inflow/Outflow (All Exchanges) (CoinGlass)
Today’s Data Analysis:
Wallet inflows and outflows provide insights into whether BTC is moving into or out of exchanges, a key indicator of buying/selling pressure. The chart shows balanced inflows and outflows, with no extreme spikes in either direction. This suggests stable market conditions without excessive pressure to sell or accumulate BTC.
Conclusion:
The stable inflow and outflow data suggest no immediate risk of significant price movement due to exchange-based liquidity changes.
Today’s Spot Data Summary:
Trend Indicators show short-term bullish momentum, with positive moving averages across shorter intervals.
Overbought/Oversold Indicators signal a possible short-term pullback, with Stochastic and CCI overbought readings.
Candlestick Patterns indicate strong momentum but also potential reversals, especially with the Hikkake and Engulfing patterns.
Liquidity Delta Charts highlight strong support around $58,000, though resistance is evident above this level.
Whale Orders are clustered in the buy zones, suggesting confidence from large traders.
Wallet Inflow/Outflow data shows a balanced market without heavy inflows or outflows.
Possible Impact on the Market in the Next 24 Hours:
The short-term trend remains bullish, with strong support around $58,000. However, overbought conditions could lead to a brief pullback or consolidation in the next 24 hours, especially if sell orders at resistance levels materialize.
Possible Impact on the Market by the End of the Week (next Sunday):
Assuming no major sell-off or external market shocks, the market is likely to test resistance levels above $58,000. A break above these levels could open the door for further bullish continuation. However, overbought conditions might need to reset, causing consolidation or minor corrections.
Sentiment Evaluation:
Bullish/Bearish Sentiment from 0 (extreme bearish) to 10 (extreme bullish): 7
The sentiment leans bullish, supported by whale buying activity, strong liquidity at key levels, and positive short-term trends. However, overbought indicators suggest caution for potential short-term corrections.
Bitcoin Market Analysis: Mixed Sentiment with Short-Term Stability and Potential Volatility
1. Overview of Today’s Bitcoin Market Highlights: Options, Futures, and Spot
Options Market:
Implied Volatility (ATM IV): Across all time frames, ATM IV decreased today, with a notable drop of 6.09% in the 1-day timeframe, signaling reduced expectations for large price movements in the near future(Analyse).
25 Delta Skew: A -3.97% skew suggests a slight bearish sentiment, indicating increased demand for put options, as traders seek downside protection(Analyse).
Open Interest: End-of-year expirations see significant focus, especially for December 2024, hinting at possible hedging for potential year-end volatility(Analyse).
Futures Market:
Concentrated Activity: The $57,000 range shows the highest accumulation of open interest, making it a critical level for traders(Analyse).
Funding Rates: Slightly negative at -4.32%, indicating a minor bearish tilt(Analyse).
Leverage: Traders are using significant leverage, with the highest concentration around $57,000, increasing the risk of volatility due to potential liquidations(Analyse).
Spot Market:
Trend Indicators: Short-term moving averages are showing bullish momentum, but the 30-day average indicates a slight recent decline, reflecting a cautious recovery(Analyse).
Overbought Signals: RSI levels are neutral, but Stochastic and CCI show overbought conditions in the short-term, hinting at a possible pullback(Analyse).
Order Book Liquidity: Strong support exists around $57,000, with large buy-side interest, while sell orders above $58,000 create resistance(Analyse).
2. Market Sentiment Evaluation
The overall market sentiment leans slightly bearish. Despite reduced volatility expectations (as seen in the declining ATM IV and historical volatility), the skew metrics suggest traders are actively seeking downside protection with put options. This is compounded by a negative funding rate and increased leverage, signaling a market cautious of downward price movements. However, large whale orders clustered around $57,000 show confidence, suggesting that there is still strong interest in maintaining price levels near this support(Analyse).
3. 24-Hour Forecast: Price Movement, Support, and Resistance
Possible Price Movement: The market is expected to hover near the $57,000 range with potential volatility due to high leverage and liquidation risks. Any breach of this level could trigger sharp movements, especially towards liquidation zones(Analyse).
Support Levels: $57,000 is a critical support area, with strong buy-side liquidity concentrated around this range.
Resistance Levels: Resistance sits slightly above $58,000, where concentrated sell orders could cap any bullish momentum(Analyse)(Analyse).
4. Will Bitcoin Follow the Current Price Trend?
Based on today’s data, Bitcoin may follow its current price trend, but with caution. The short-term trend is showing bullish momentum, supported by strong liquidity around $57,000. However, overbought conditions in the shorter timeframes, as well as the presence of significant resistance above $58,000, indicate a potential pullback or consolidation period before any further upward movement. The market may see limited volatility in the next 24 hours, barring any external market shocks(Analyse)(Analyse).
The overall sentiment suggests price stabilization with a possible minor correction before the market attempts to break above resistance levels.




Much better to readings. Sorted images and life is easier 🙏