Comprehensive Bitcoin Market Analysis: Options, Futures, and Spot Overview with 24-Hour Forecast
Rising Short-Term Volatility and Bearish Bias in Bitcoin Options: A Precursor to Downside Moves?
1. BTC ATM IV (Greeks.Live)
Introduction: At-the-Money (ATM) Implied Volatility (IV) provides insight into the market’s expectations for future volatility in Bitcoin options, based on options contracts at-the-money.
Today's Data Analysis:
1 Day: ATM IV is at 47.65%, showing an increase of 6.75% from yesterday.
1 Week: 54.60% (+1.70% from yesterday).
1 Month: 51.15%, a smaller increase of 0.49%.
3 Month: 59.13%, with a slight decline of 0.26%.
Conclusion: Short-term volatility expectations are rising sharply, particularly in the 1-day and 1-week timeframes. The market is pricing in higher near-term risk, while medium- and long-term IV remains relatively stable or slightly declining.
2. 25 Delta Skew (Greeks.Live)
Introduction: 25 Delta Skew measures the difference in implied volatility between out-of-the-money puts and calls, indicating sentiment towards upward or downward moves.
Today's Data Analysis:
1 Day: Skew is at -9.78%, dropping by 9.98% today, signaling a strong preference for puts and a bearish sentiment.
1 Week: -5.57%, a slight drop of 1.13%.
1 Month: Skew is at -2.49%, indicating a more neutral positioning compared to shorter expirations.
Conclusion: The sharp drop in the 25 Delta Skew for short-term expirations reflects increased demand for downside protection, showing bearish sentiment for Bitcoin in the very short term.
3. BTC IV Skew (Greeks.Live)
Introduction: Implied Volatility Skew shows the difference in volatility for different strike prices, helping gauge market expectations for upward or downward price moves.
Today's Data Analysis:
The IV skew is sloping downward, with lower strike prices (out-of-the-money puts) reflecting higher implied volatility than higher strike prices.
Conclusion: The current skew pattern suggests traders are positioning more heavily on downside risks, with puts being favored for protection.
4. Historical Volatility (HV) (Greeks.Live)
Introduction: Historical Volatility (HV) tracks actual price movements in the past. Comparing HV with IV helps understand whether the market is overpricing or underpricing risk.
Today's Data Analysis:
1 Day HV: 45.72%, up by 26.01% today.
1 Week HV: 47.78%, with a decline of 1.45%.
1 Month HV: 50.20%, increasing by 0.31%.
Conclusion: The sharp rise in short-term historical volatility indicates that recent price movements have been more volatile, aligning with the increase in implied volatility.
5. BTC ATM Volatility Term Structure (Greeks.Live)
Introduction: Volatility Term Structure represents the implied volatility over different timeframes, helping traders understand whether short-term or long-term volatility is expected to be higher.
Today's Data Analysis:
The term structure shows a peak around September 2024 with volatility decreasing after that, indicating traders expect higher volatility in the short term but relatively stable volatility over the long term.
Conclusion: Traders anticipate a near-term event that could drive volatility higher, but expect it to taper off over the next few months, with more stability expected in the medium term.
6. Option Flow (Greeks.Live)
Introduction: Option flow reveals the volume and types of trades (calls/puts) being made, offering a view into market sentiment and positioning.
Today's Data Analysis:
Call Buys: 16.71%.
Call Sells: 24.53%.
Put Buys: 17.78%.
Put Sells: 12.78%.
Conclusion: The market shows a significant balance between call and put trades, with
slightly more selling activity, indicating neutral to mildly bearish sentiment. The emphasis on call sells and put buys suggests traders are positioning for potential downside movements in the short term.
7. BTC Options Open Interest By Expiration (As of 2024/09/16) (Greeks.Live)
Introduction: Open interest (OI) reflects the number of outstanding option contracts, providing insight into where traders are positioning their bets based on expiration dates.
Today's Data Analysis:
The highest OI is centered around the 26th of December 2024, with 32.68% of the total open interest focused on this expiration. This is followed by October 24, 2024, with 11.89%.
Conclusion: The high concentration of open interest on December expirations suggests that market participants are anticipating significant events or volatility towards the end of the year.
8. BTC Option Trade Volume (Greeks.Live)
Introduction: Option trade volume indicates the number of contracts traded in a given period, giving insight into the market's liquidity and interest.
Today's Data Analysis:
Trading volumes are fluctuating, with notable spikes in buy and sell activity during specific intraday sessions, indicating heightened market interest and liquidity.
Conclusion: The active trading volume indicates that the market is engaging heavily, likely in response to upcoming short-term events or anticipated volatility.
9. BTC VRP (Greeks.Live)
Introduction: Volatility Risk Premium (VRP) measures the difference between implied volatility and realized volatility, showing whether options are overpriced or underpriced relative to actual price movements.
Today's Data Analysis:
VRP remains near neutral, fluctuating slightly around zero, indicating that implied and realized volatilities are currently aligned.
Conclusion: With the VRP near zero, the options market is pricing volatility in line with what is being observed in actual market movements, suggesting fair pricing of risk at this moment.
10. Strategy Flows (Laevitas.ch)
Introduction: Strategy flows show the distribution of different options strategies being employed by traders, such as spreads, straddles, or custom strategies.
Today's Data Analysis:
The top strategy is Bear Call Spread, representing 600 contracts, followed by Bull Diagonal Spread (Calls) with 530 contracts, and Bear Put Spread with 500 contracts.
Conclusion: The prevalence of bear spreads (call and put) indicates that market participants are positioning for potential downward movements, reflecting bearish sentiment over the short term.
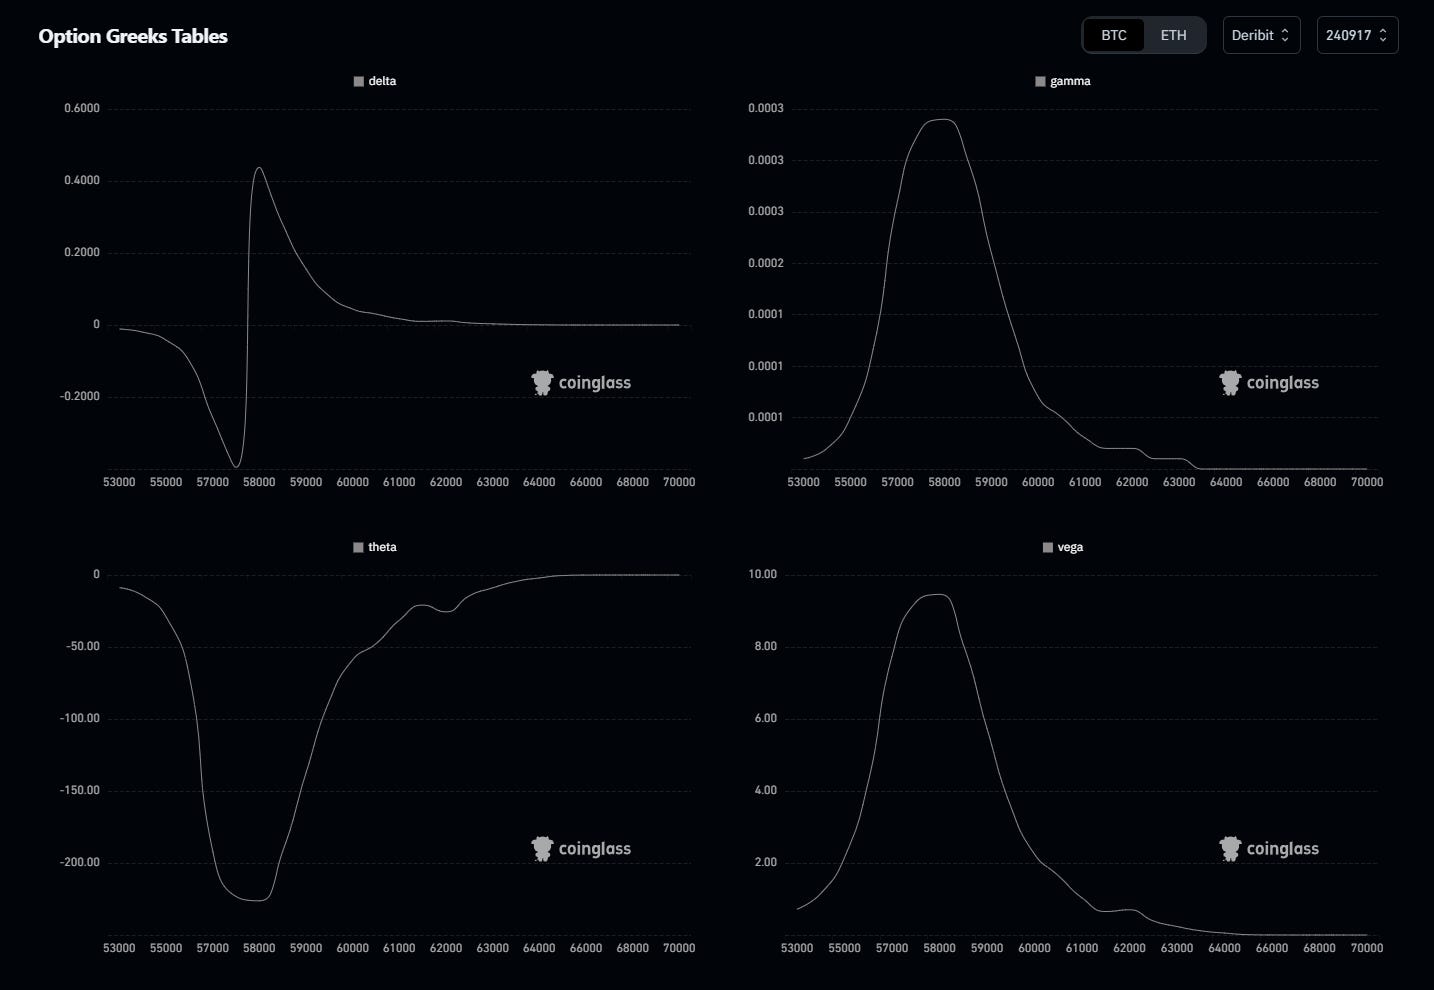
11. Greeks (Coinglass)
Introduction: Option Greeks measure various risk sensitivities of options, such as Delta (price sensitivity), Gamma (rate of change of Delta), Theta (time decay), and Vega (volatility sensitivity).
Today's Data Analysis:
Delta: Relatively neutral positioning with minimal directional bias.
Gamma and Vega: Spikes suggest expectations for sharp price movements, likely preparing for higher volatility scenarios.
Conclusion: With neutral Delta but elevated Gamma and Vega, the market appears to be preparing for potential price swings, although there is no clear directional bias.
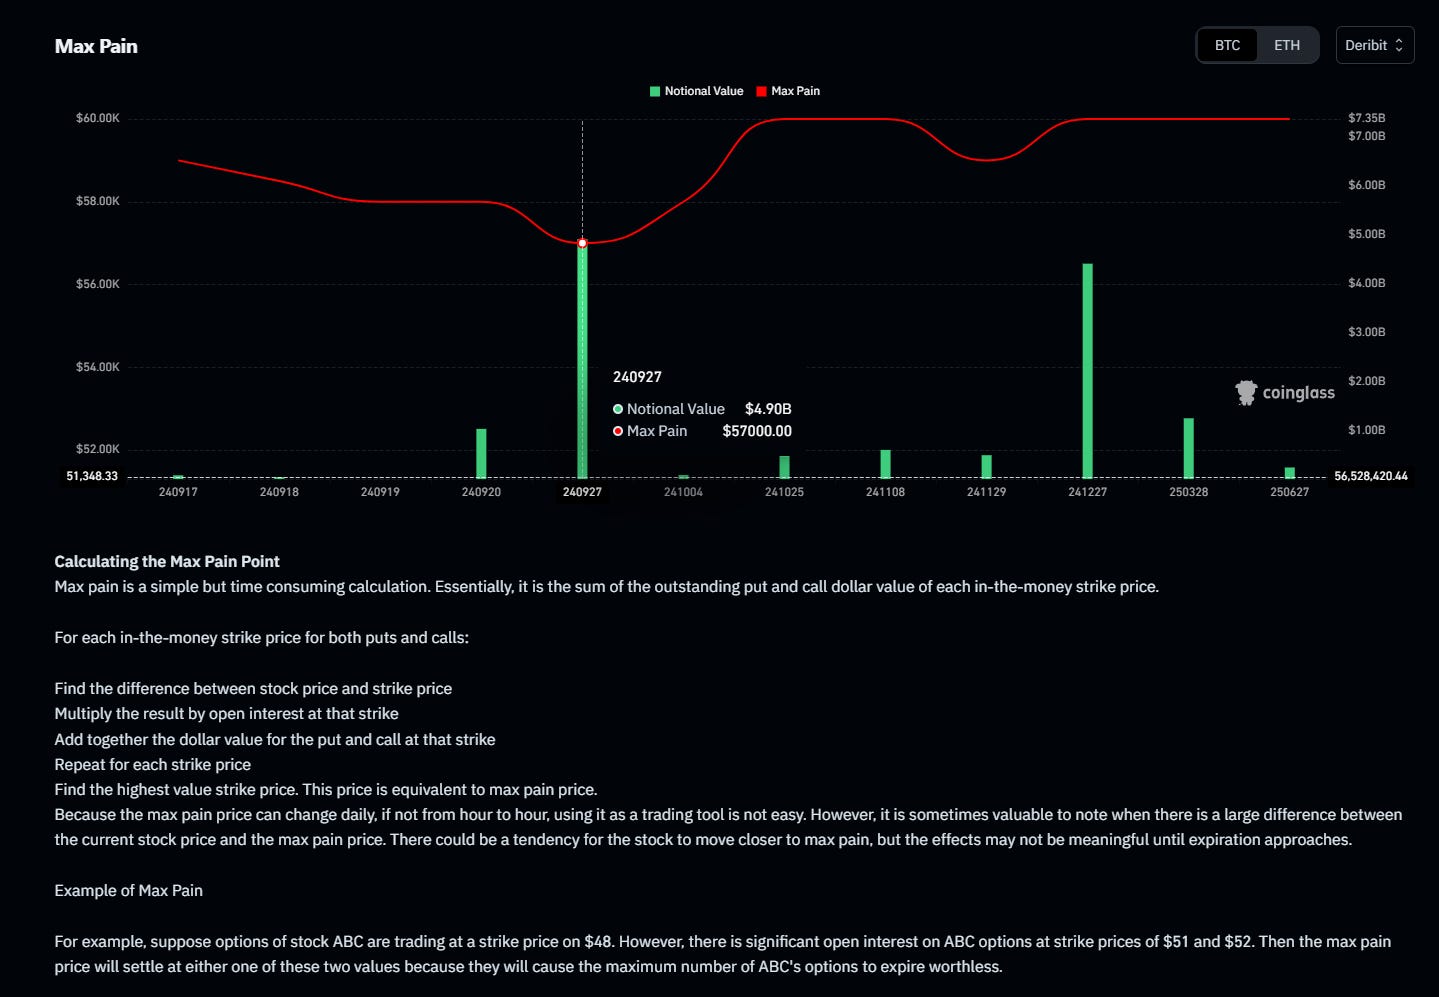
12. Max Pain (Coinglass)
Introduction: Max Pain theory suggests that the price of the underlying asset will gravitate towards the strike price where the most options contracts will expire worthless, maximizing pain for options holders.
Today's Data Analysis:
The max pain point for September 27, 2024, is set at $57,000, with a total notional value of $4.90B.
Conclusion: Max pain at $57,000 suggests that as we approach the expiration date, there could be market forces driving the price towards this level, especially if the gap between current price and max pain remains wide.
Today's Options Data Summary:
The options market shows a mix of rising short-term volatility expectations and cautious positioning through various bear spreads and downside hedges. While open interest is heavily focused on the end-of-year expiration, the immediate outlook is preparing for near-term volatility. The skew and strategy flows point to a bearish bias, with traders hedging against potential price declines.
Possible Impact on the Market in the Next 24 Hours:
Given the sharp rise in implied volatility and demand for put options, Bitcoin could see increased price fluctuations with downside risk in the immediate term. The 25 Delta Skew and rising short-term ATM IV indicate growing concerns about a price drop.
Possible Impact on the Market by the End of the Week:
By the end of the week, if volatility expectations remain high and downside protection continues to dominate option flows, Bitcoin could face further selling pressure. However, if volatility subsides, the market might stabilize towards the max pain level of $57,000 by key expirations.
Sentiment Evaluation:
Bearish/Bullish Sentiment Score: 3/10
The sentiment leans bearish, with significant put demand and bearish spreads dominating strategy flows, alongside increased volatility pricing for the short term.
BTC Futures Battle: Will Resistance Hold or Break?
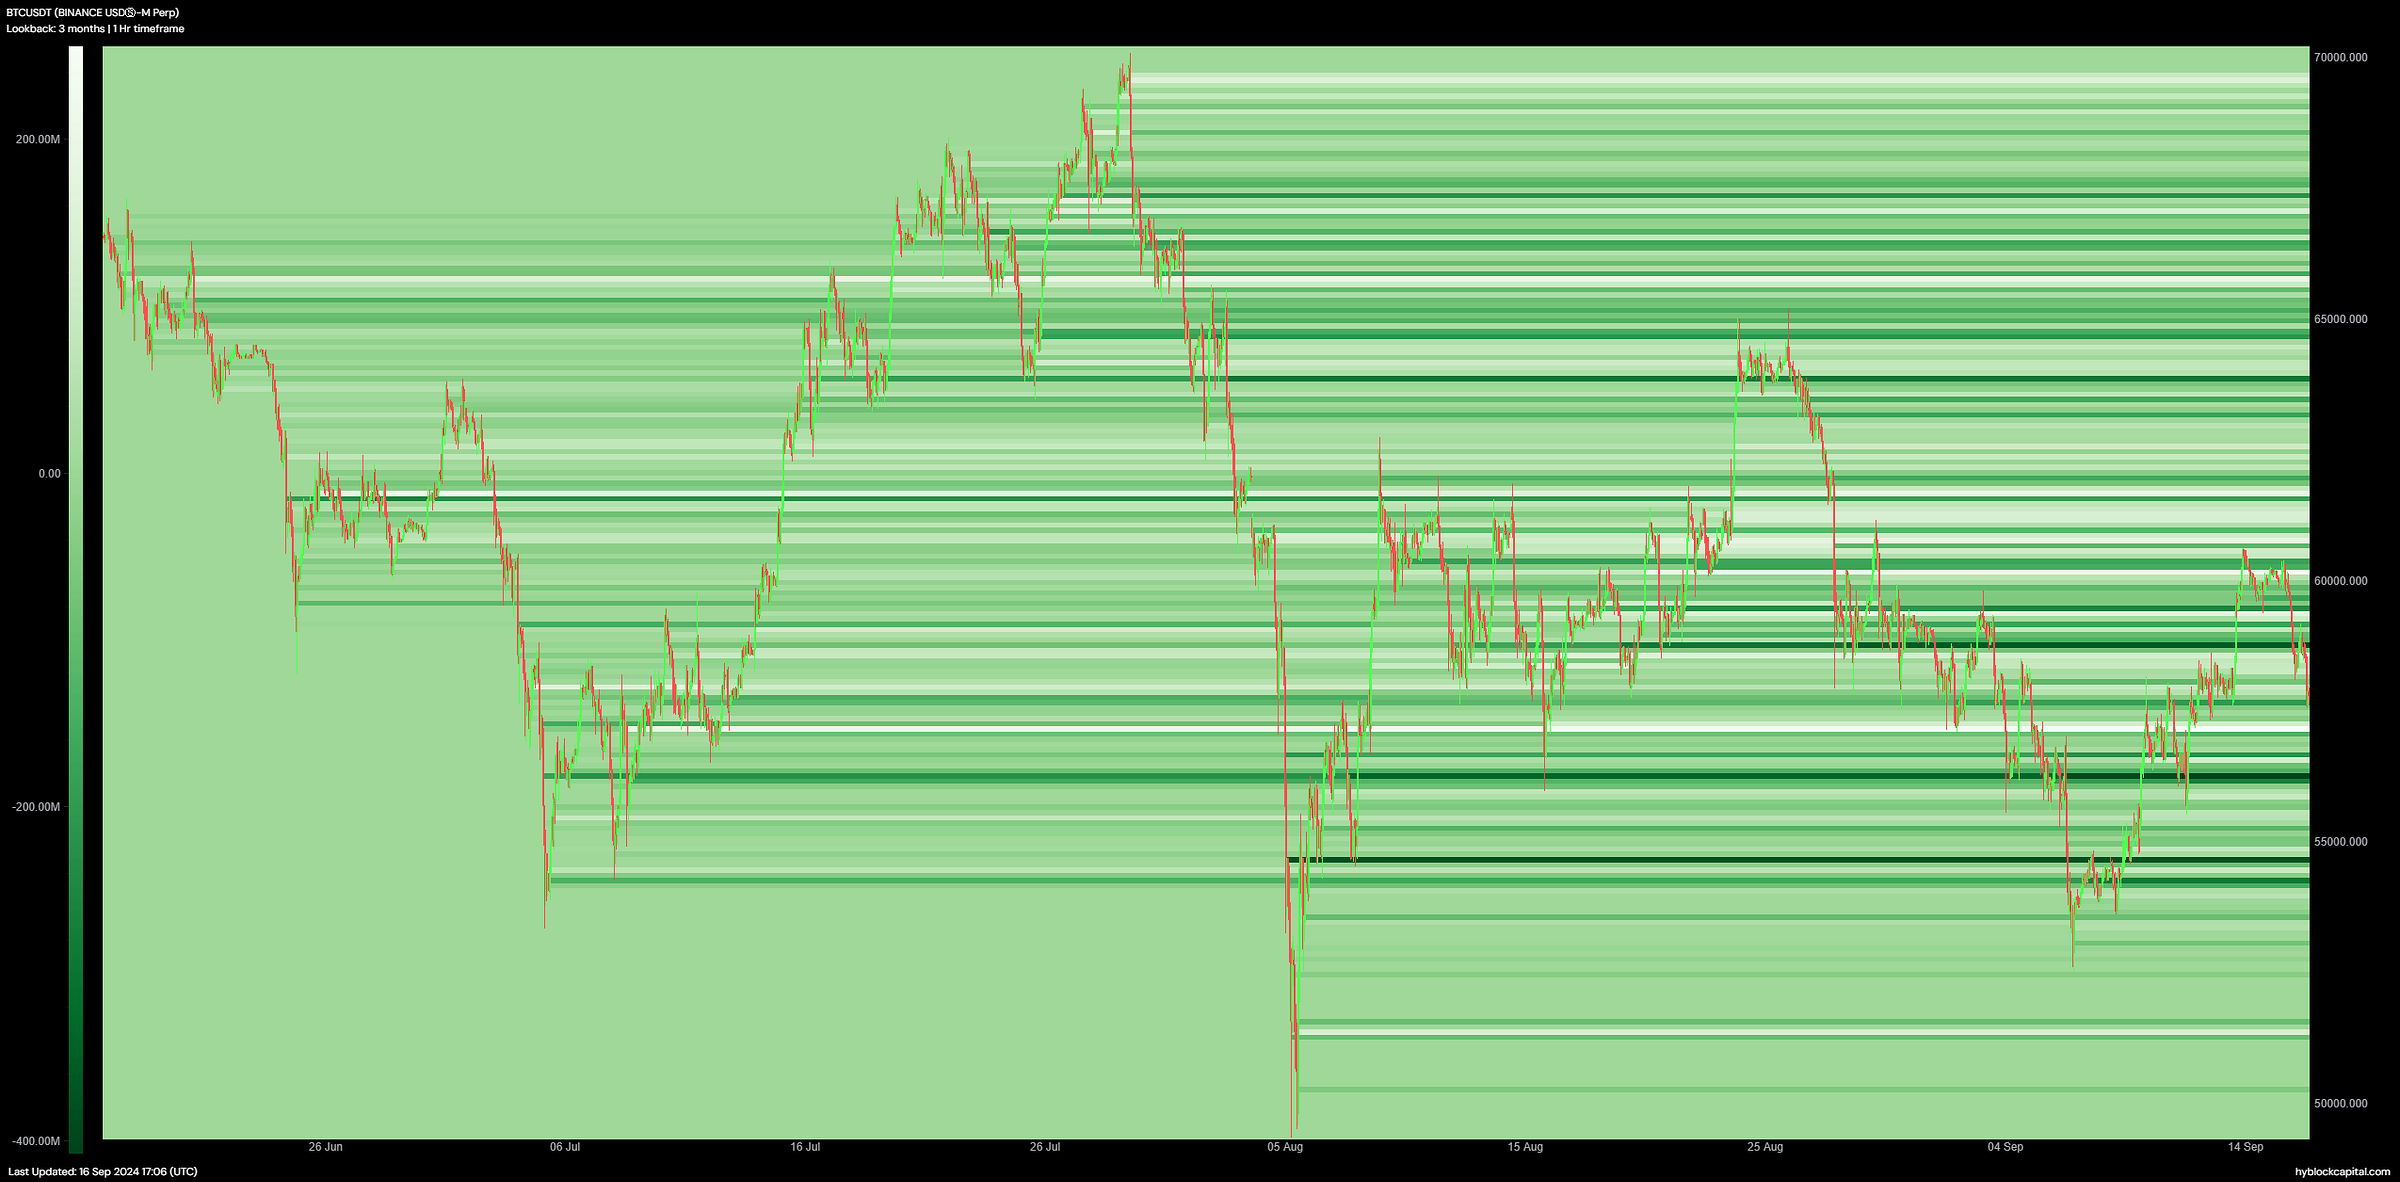
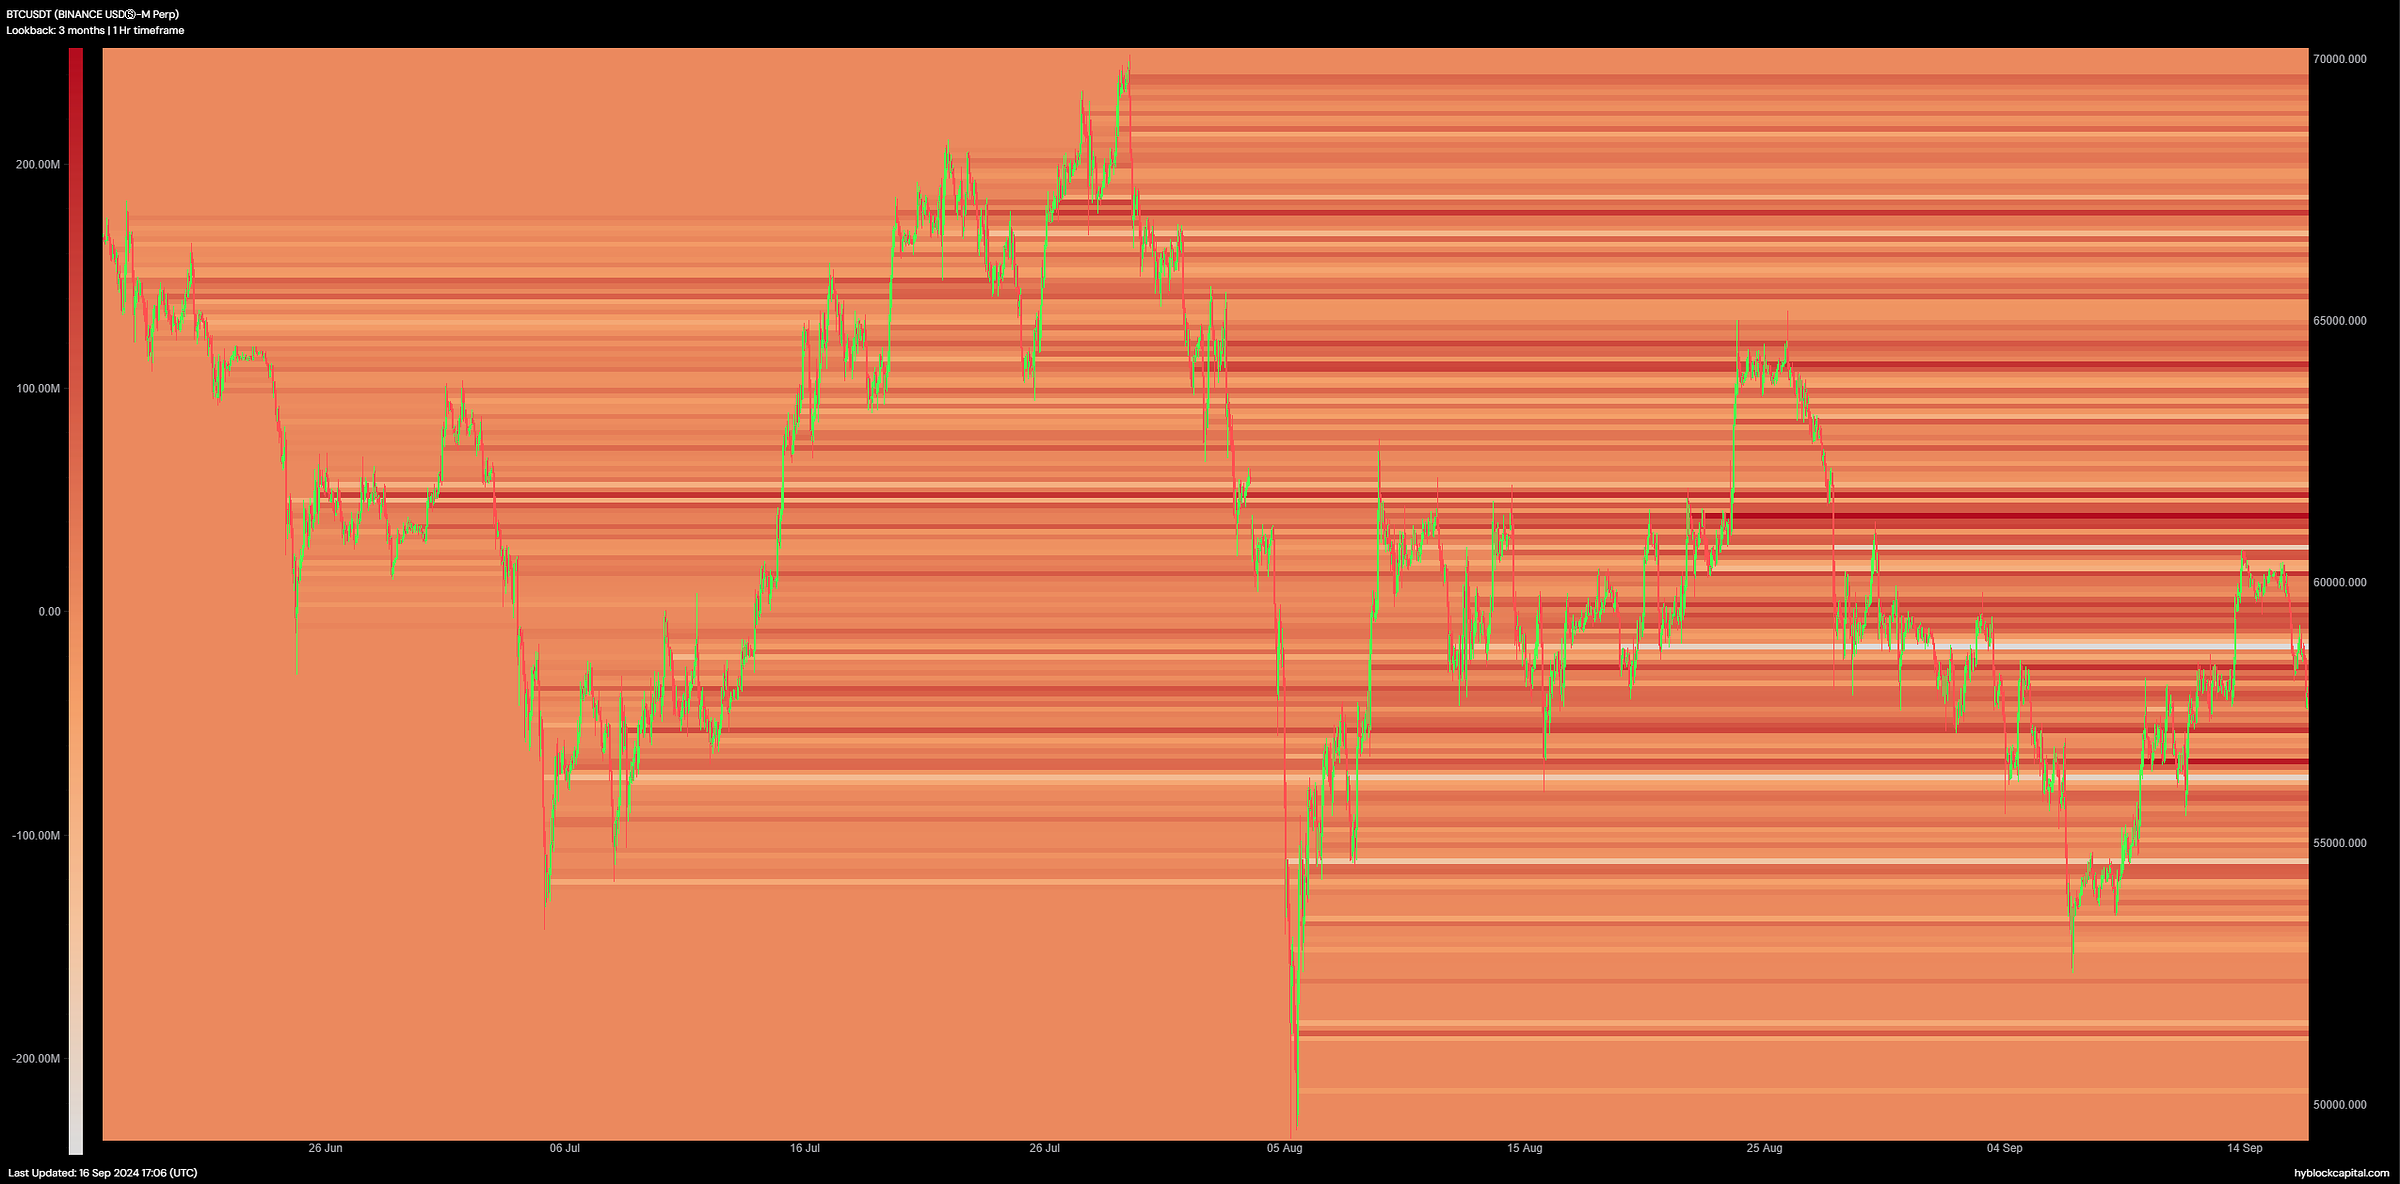
1. Analysis of Heatmaps for Net-Shorts and Net-Longs (Hyblock Capital)
Introduction:
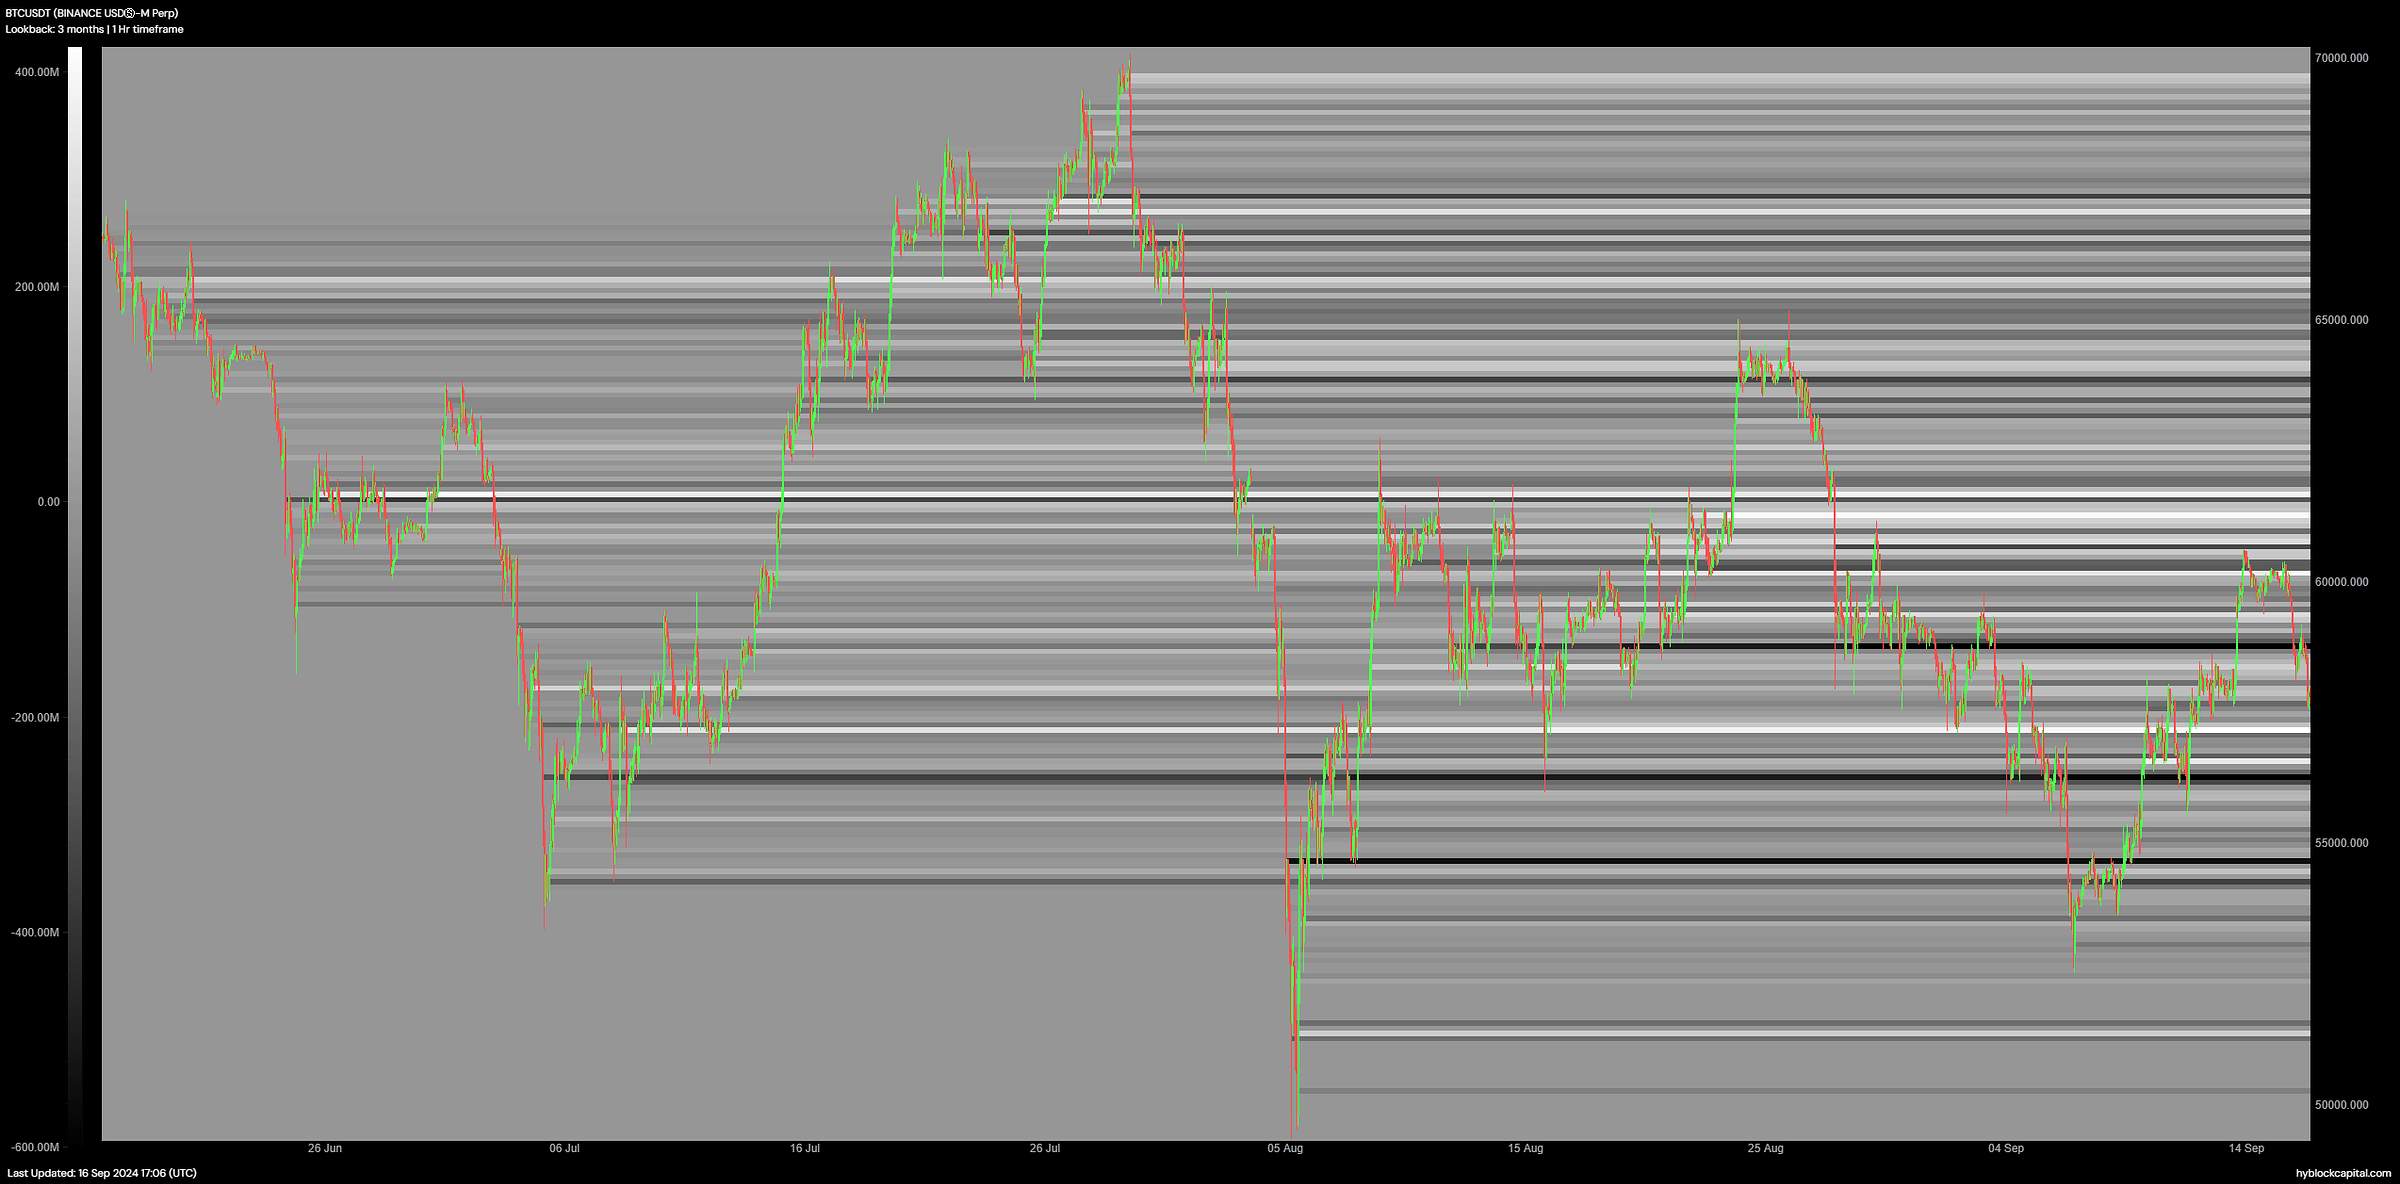
Heatmaps for net-shorts and net-longs provide an in-depth look at the concentration of open positions in the market. By observing where the majority of traders are placing long or short orders, we can infer potential areas of liquidity and volatility.
Today's Data Analysis:
The heatmap shows a notable concentration of net-shorts accumulating in the $58,000 region, while net-longs are more scattered between $55,000 and $57,000. There appears to be strong sell-side pressure near the $58,000 resistance level.
Conclusion:
The data suggests that traders are preparing for a rejection near the $58,000 area, with many expecting a downward move. However, the distribution of longs below that level indicates there may still be buying interest in the mid-$55,000s range.
2. Heatmap Open Interest (Hyblock Capital)
Introduction:
Open interest heatmaps show where the most positions are being held. This can signal where traders are placing their bets and highlight critical price levels that may act as magnets for price action.
Today's Data Analysis:
There’s an increased open interest around the $57,500-$58,500 range, suggesting that both long and short positions are heavily concentrated here. The imbalance between open positions in this range may lead to higher volatility.
Conclusion:
If BTC approaches the $57,500-$58,000 zone, expect significant price fluctuations. A break above $58,000 could trigger short liquidations, while a breakdown below could lead to long liquidations.
3. Funding Rate (APY) [Binance] (Hyblock Capital)
Introduction:
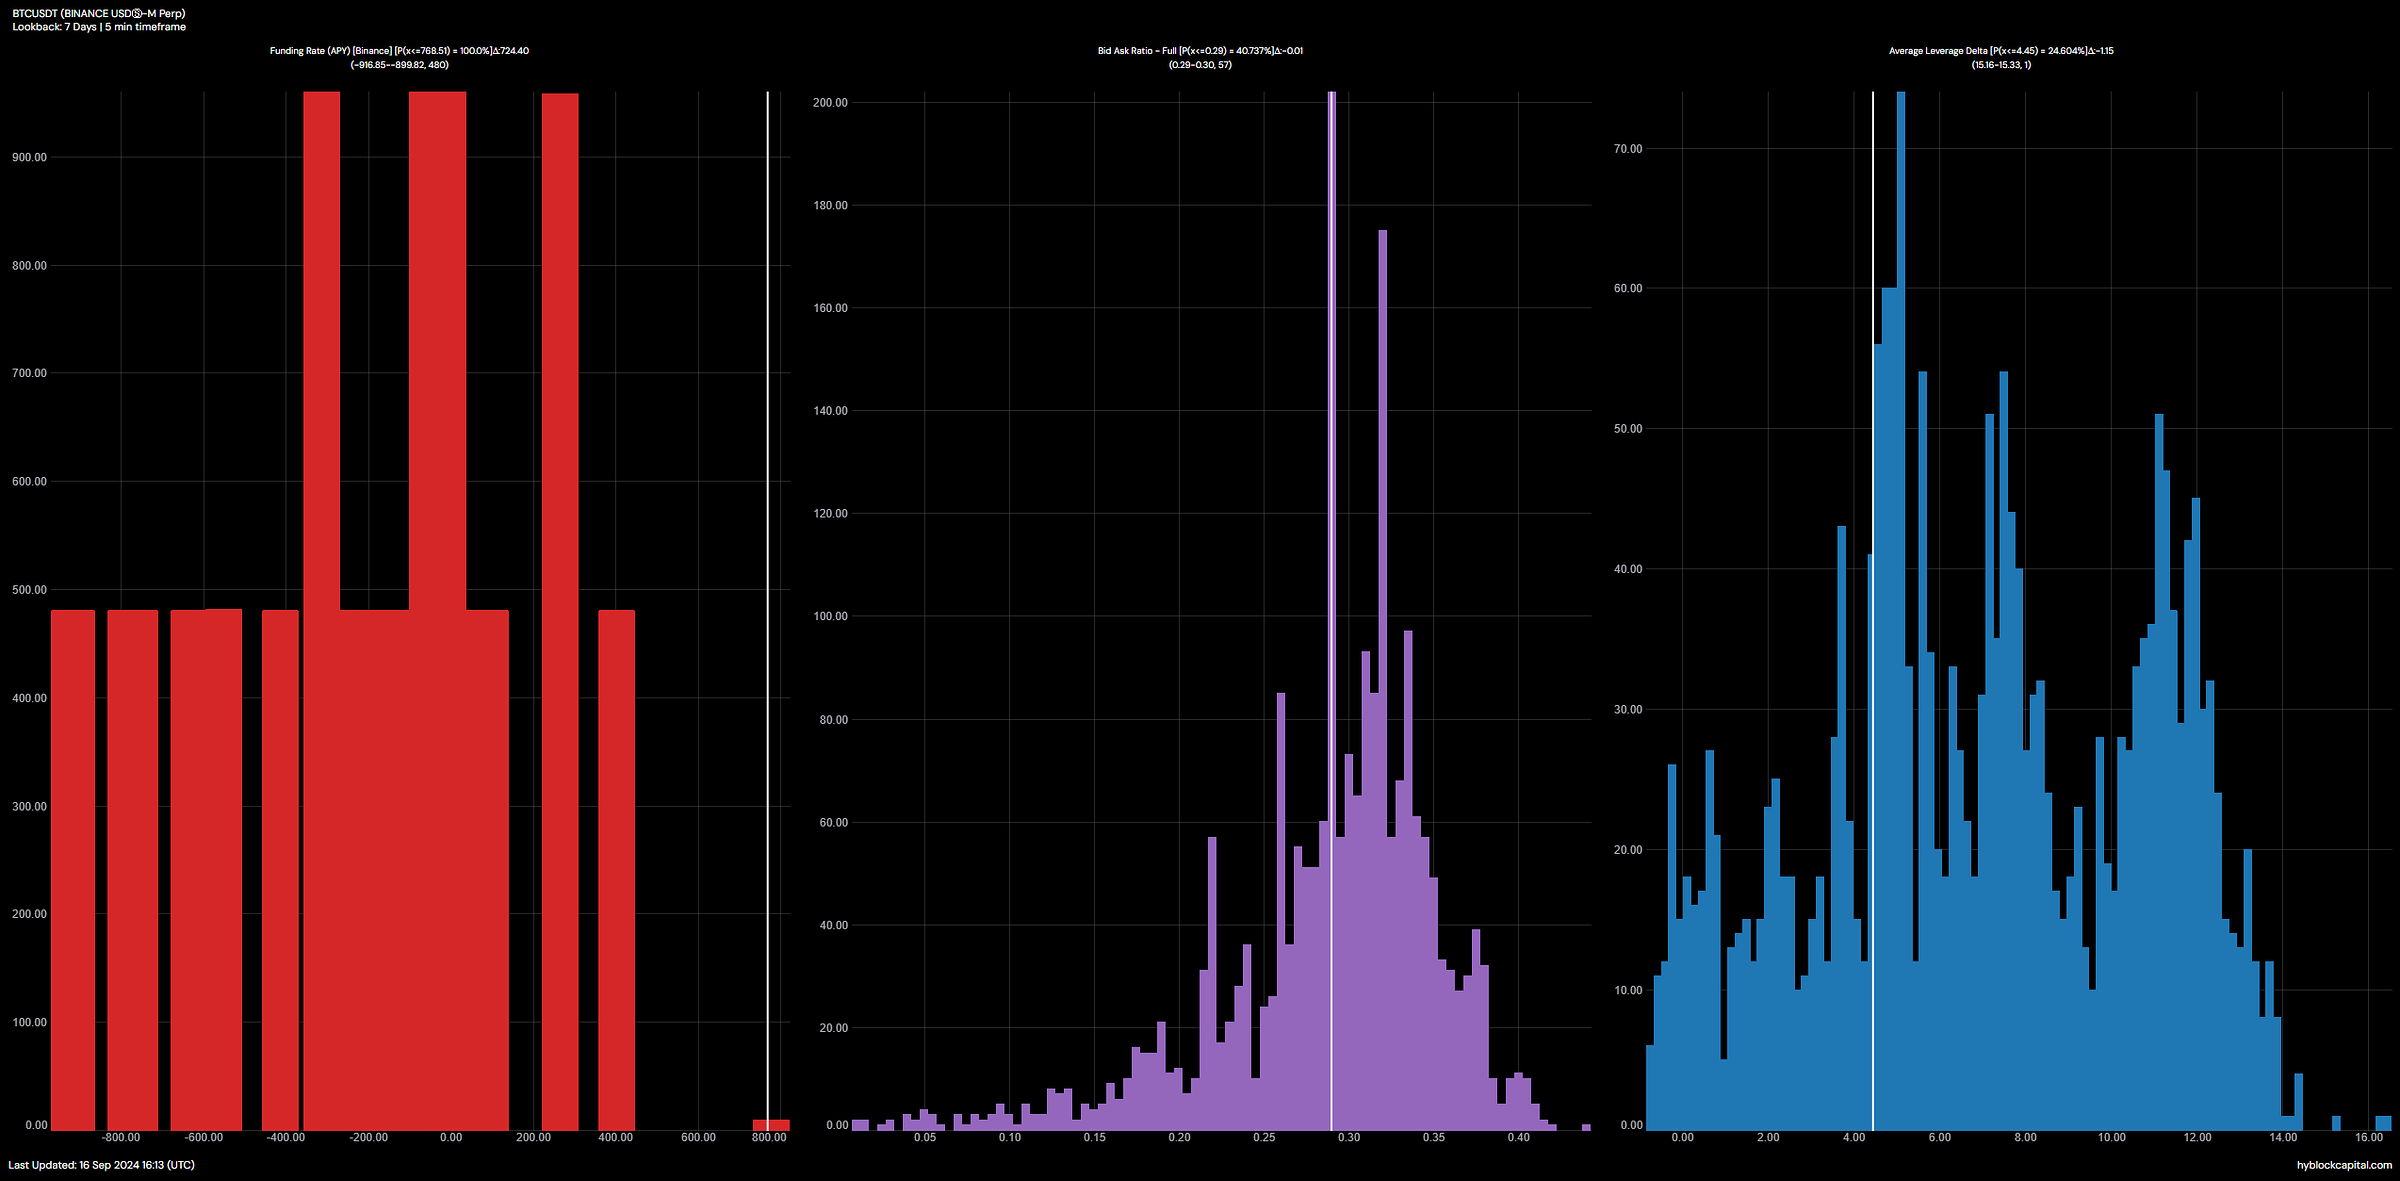
Funding rates reflect the cost of holding long or short positions in perpetual futures contracts. Positive funding indicates longs are paying shorts, while negative rates suggest shorts are paying longs.
Today's Data Analysis:
The funding rate has remained neutral to slightly positive, indicating balanced interest between longs and shorts. This suggests no strong bias towards either direction in the immediate term.
Conclusion:
The market appears to be in equilibrium at present, but any sharp increase in funding rates could indicate an over-leveraged side that might be squeezed.
4. Bid Ask Ratio - Full (Hyblock Capital)
Introduction:
The bid-ask ratio measures the relative strength of buyers (bids) and sellers (asks) in the order book. A high bid-ask ratio suggests bullish sentiment, while a low ratio indicates bearish sentiment.
Today's Data Analysis:
The bid-ask ratio remains relatively balanced with a slight bias towards sellers, as seen in the ask-side dominance in the $57,500-$58,000 range.
Conclusion:
The market is slightly favoring sellers around current price levels, implying that the resistance near $58,000 is strong, and further downside could follow unless there is a clear break above.
5. Average Leverage Delta (Hyblock Capital)
Introduction:
The average leverage delta measures the level of leverage used by traders, giving insight into how aggressively market participants are positioning themselves.
Today's Data Analysis:
Leverage usage has been moderate with spikes during volatility, especially around key resistance levels like $58,000. Traders appear cautious but willing to use leverage at critical price points.
Conclusion:
If leverage continues to build, especially near resistance zones, expect sharp price movements. A squeeze, whether long or short, could be imminent if open positions with high leverage get liquidated.
6. Liquidation Levels (Hyblock Capital)
Introduction:
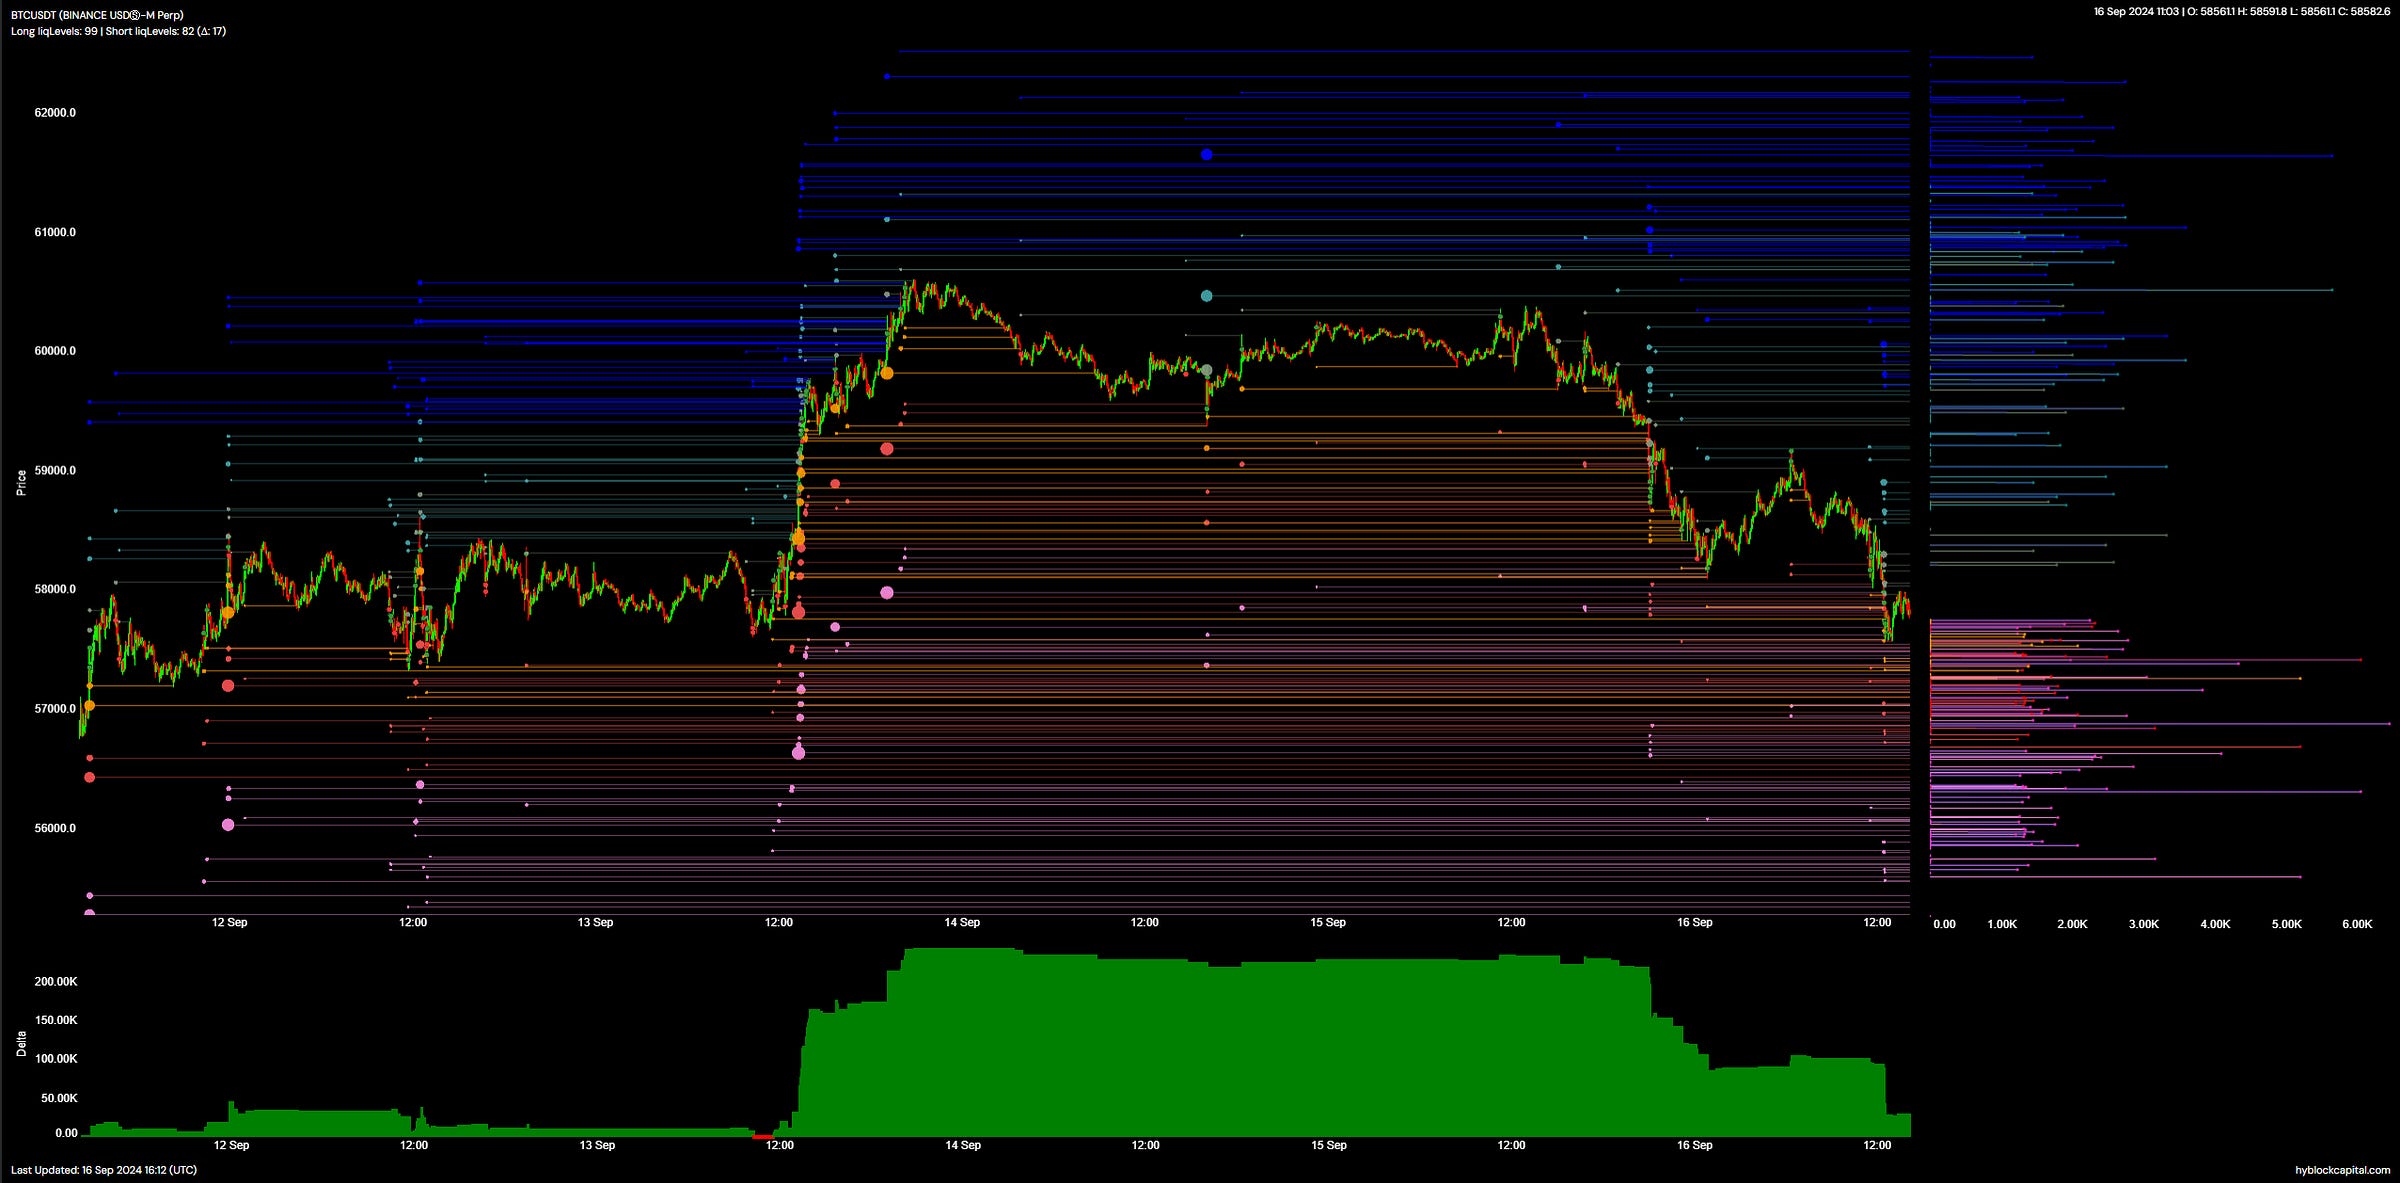
Liquidation levels highlight price points where a large number of leveraged positions may be forcibly closed, leading to sudden and significant price movements.
Today's Data Analysis:
The heatmap reveals high liquidation levels around $57,500 and below $56,000. This indicates that a break below $57,500 could trigger a cascade of long liquidations.
Conclusion:
The proximity of liquidation levels suggests that the $57,500 level is pivotal. A break below this level could intensify downside pressure as liquidations are triggered.
7. Volume (Hyblock Capital)
Introduction:
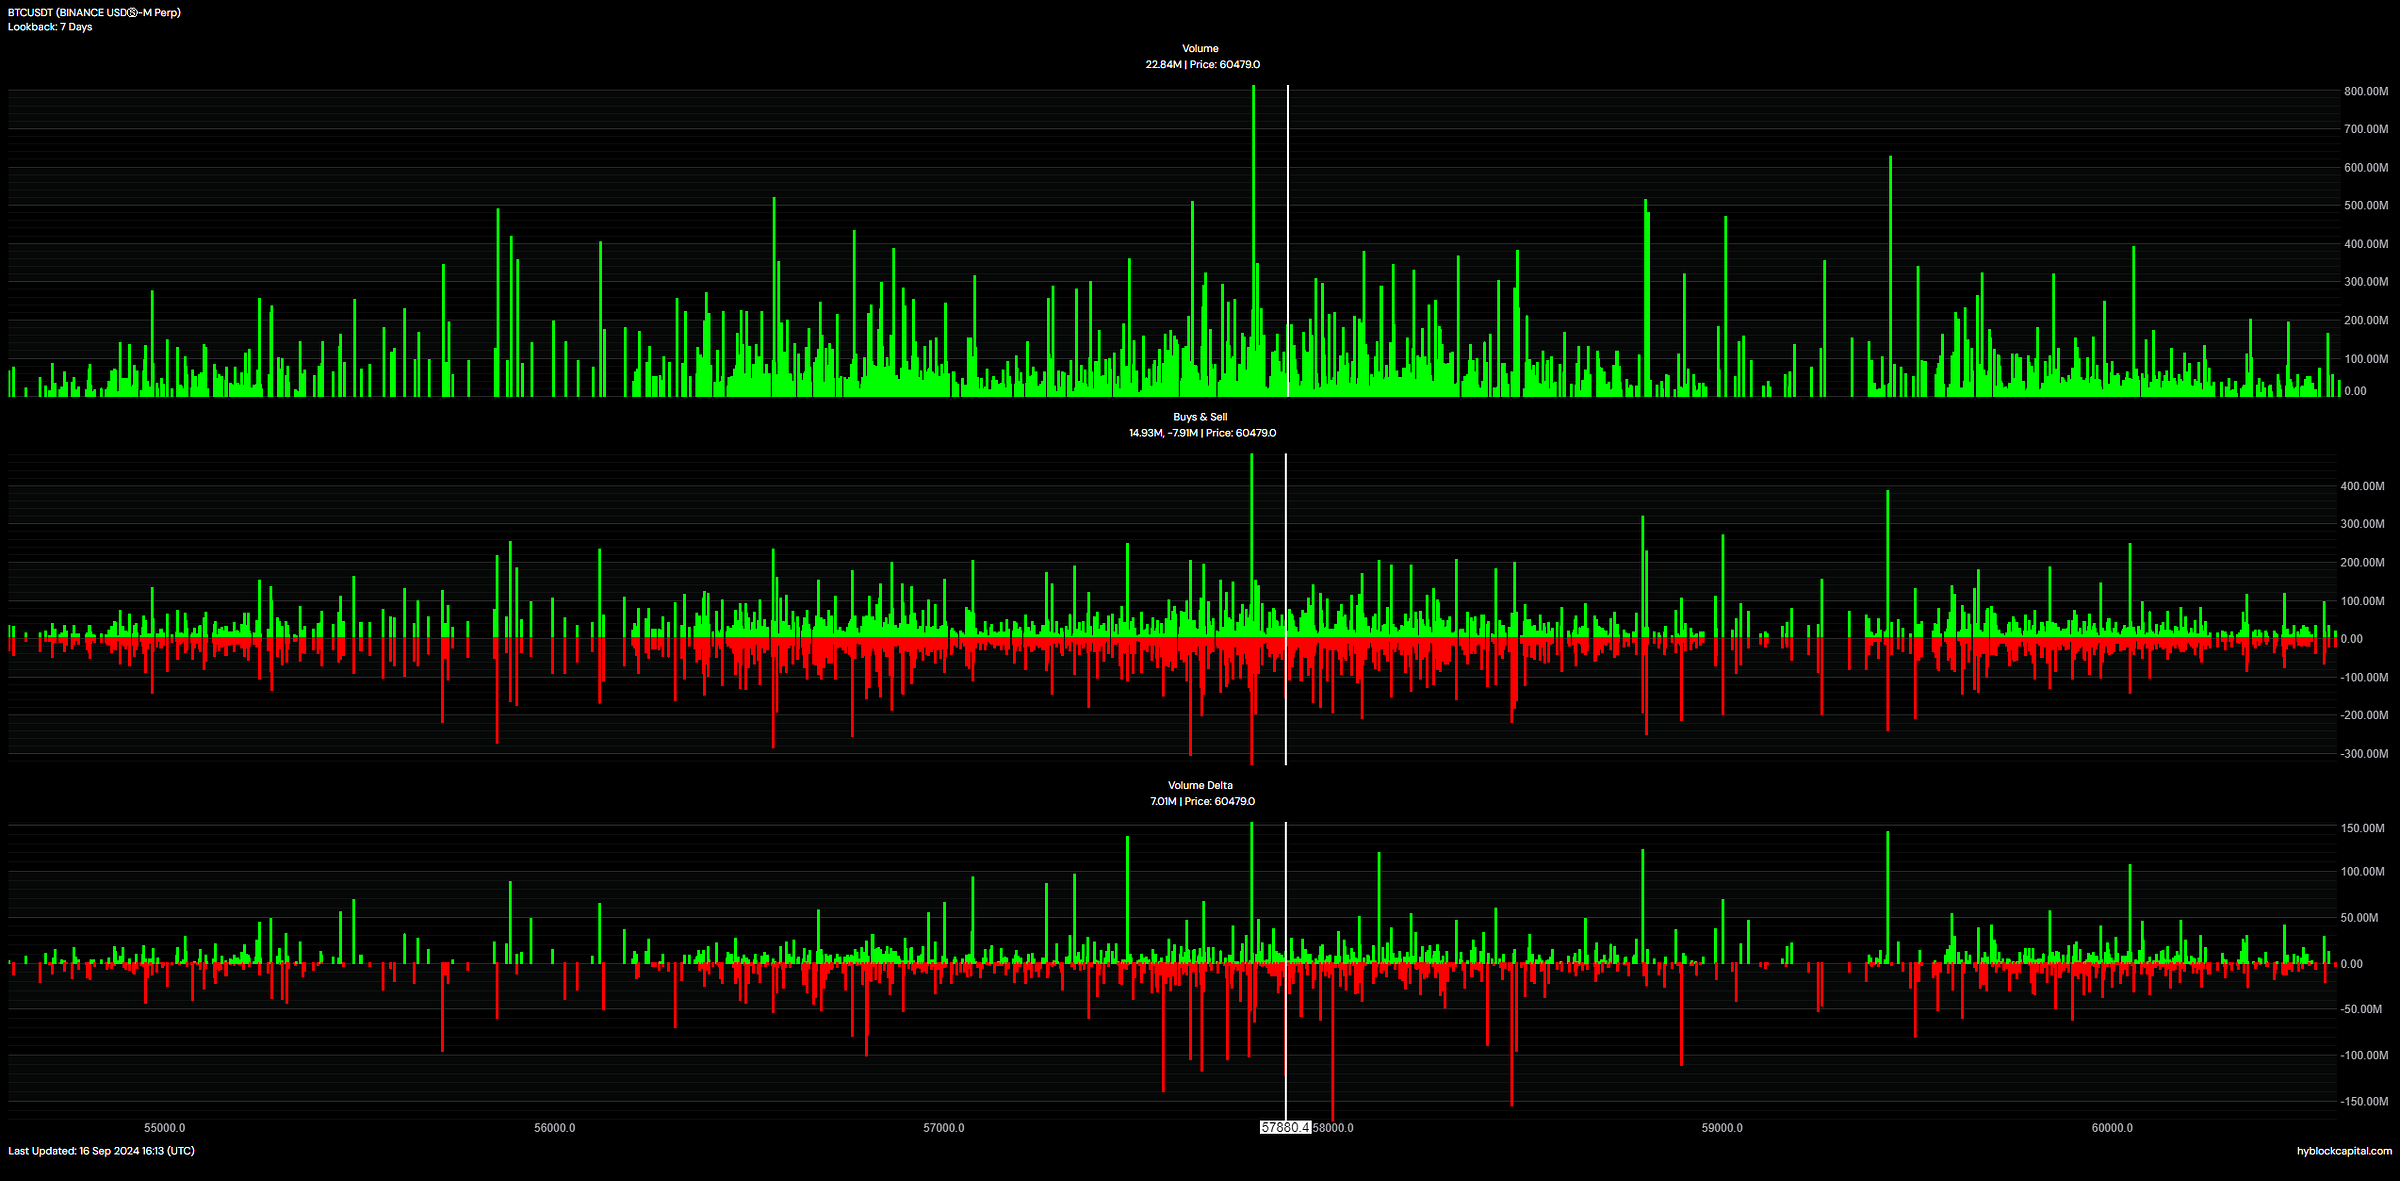
Volume represents the number of contracts traded over a given period. High volume can confirm trends, while low volume may signal indecision.
Today's Data Analysis:
Volume has been relatively high, particularly during moves towards the $58,000 level. This suggests that traders are actively participating in this range, and any breakout or breakdown will likely be supported by significant volume.
Conclusion:
The high volume near critical price levels implies that we can expect substantial moves once the market chooses a direction, especially near the $58,000 resistance.
8. Buys & Sell (Hyblock Capital)
Introduction:
Tracking the buy and sell pressure in the market gives insights into the overall sentiment and whether bulls or bears are in control.
Today's Data Analysis:
There has been a consistent increase in sell pressure around $58,000, with buy pressure picking up near $56,000. This highlights the tug-of-war between bulls and bears around these key levels.
Conclusion:
Sell pressure is currently dominating around resistance, but bulls are stepping in at lower levels. A significant move will depend on which side gives in first.
9. Volume Delta (Hyblock Capital)
Introduction:
Volume delta measures the difference between buying and selling volume. A positive delta indicates more buying, while a negative delta signals more selling.
Today's Data Analysis:
Volume delta has been fluctuating but has leaned slightly negative in recent hours, indicating that sellers are gradually gaining control, particularly around the $58,000 level.
Conclusion:
If the negative volume delta continues, we could see further price declines, especially if support levels fail to hold.
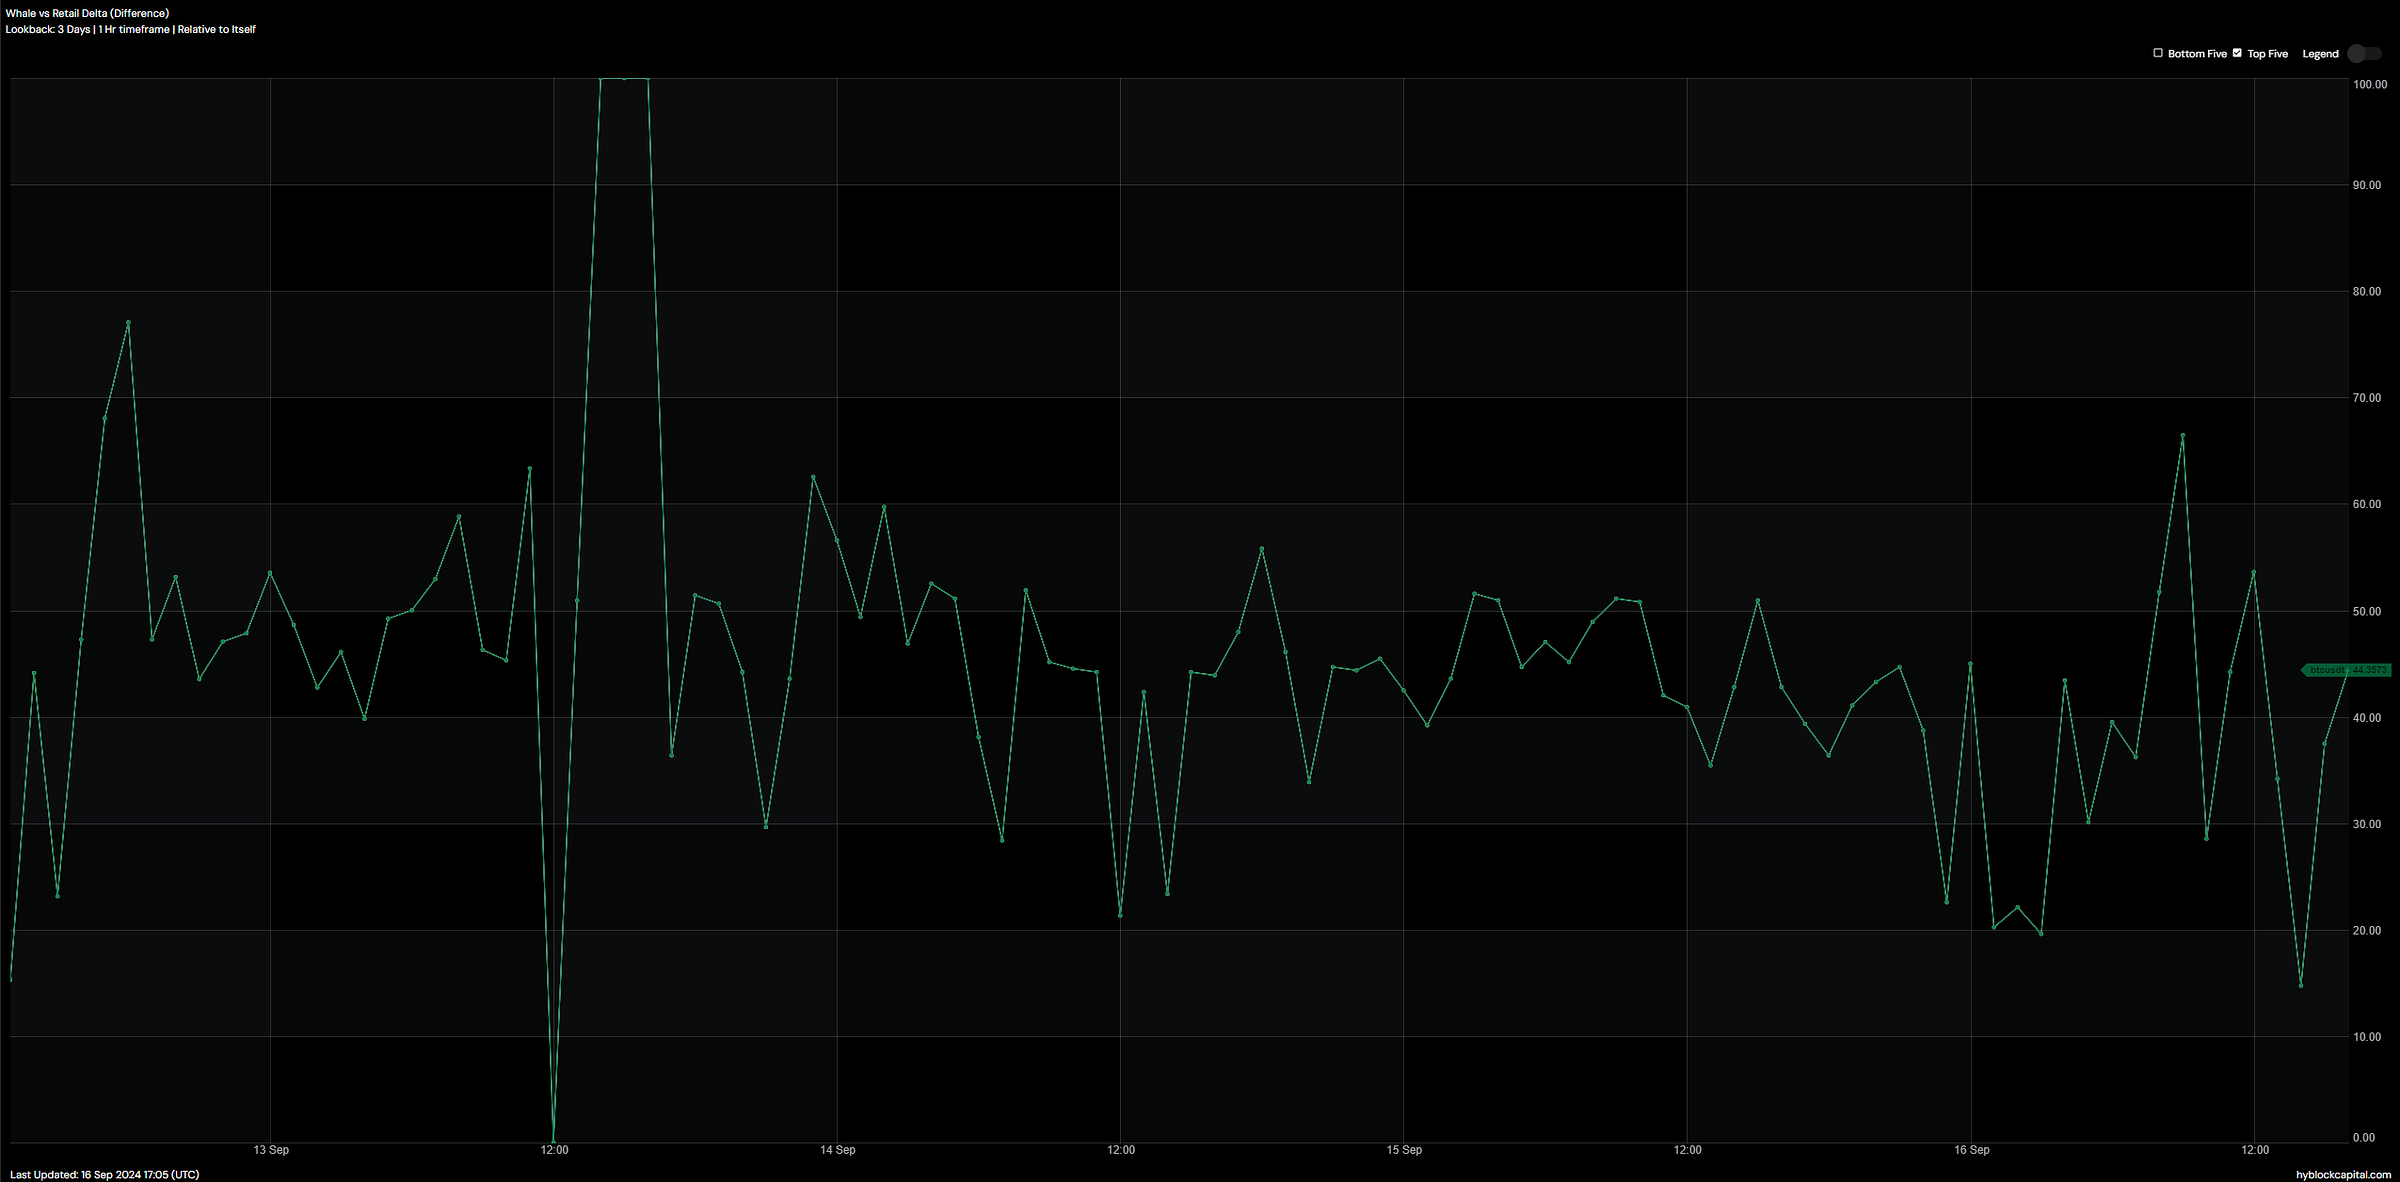
10. Whale vs Retail Delta (Difference) (Hyblock Capital)
Introduction:
The whale vs retail delta shows the activity of large players compared to retail traders, indicating who is driving the market.
Today's Data Analysis:
The delta shows spikes in whale activity, particularly around $57,500-$58,000, indicating large players are actively managing positions. Retail traders seem less aggressive, with fewer noticeable spikes in their activity.
Conclusion:
Whales are positioning themselves near resistance levels, potentially preparing for short opportunities. Retail traders may be caught off guard if prices fall, as their activity has been less concentrated.
Today's Futures Data Summary:
The futures market is displaying a cautious but bearish sentiment, especially as the $58,000 resistance remains intact. Whales appear to be accumulating positions around key resistance zones, while retail traders are spread out, indicating lower conviction. Volume and liquidation levels suggest that a large move is imminent.
Possible Impact on the Market in the Next 24 Hours:
The $57,500-$58,000 level is critical. If BTC breaks above $58,000, it could trigger a short squeeze, pushing the price higher. However, a failure to hold $57,500 could lead to liquidations and a move towards $56,000 or lower.
Possible Impact on the Market by the End of the Week (next Sunday):
By the end of the week, if the $58,000 resistance is broken, we could see BTC testing $60,000. If the resistance holds, however, we might see a retreat towards $55,000.
Sentiment Evaluation:
Bearish sentiment: 4/10
While there is a balance between longs and shorts, the market sentiment leans slightly bearish due to the resistance at $58,000 and whale positioning.
If you want to professionally analyze the #BTC futures market and not just guess but truly understand the market sentiment, then subscribe to hyblockcapital! The platform with alpha data.
Thanks to Hyblock's sponsorship (free subscription), I am able to offer you this analysis today.
Use my referral link if you want to subscribe to Hyblock:
https://hyblockcapital.com/referer/TqoP2l
Bearish Pressure with Potential Reversal Amid Oversold Conditions
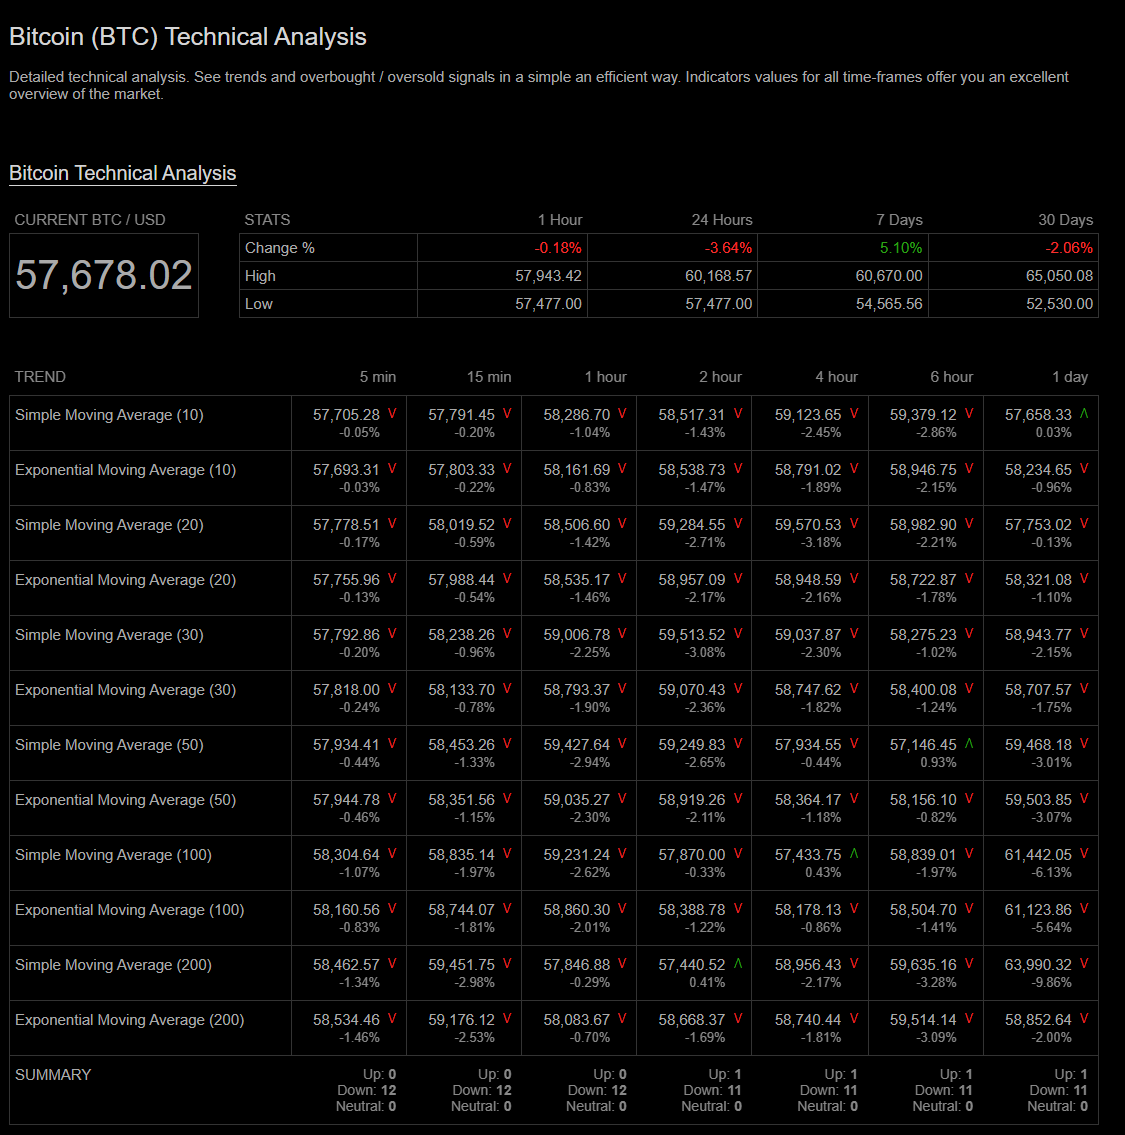
1. Trend Indicators (Coinalyze)
Introduction:
Trend indicators assess market direction using moving averages to show whether an asset is in a bullish or bearish phase over various timeframes.
Today’s Data Analysis:
Today, all the moving averages for shorter timeframes (5 minutes to 1 day) are down, reflecting a downward trend. The 30-day moving average shows a negative shift (-2.06%), suggesting that the market is continuing to experience downward pressure in the short term. However, the 7-day moving averages remain slightly positive, indicating a small bullish trend in the mid-term.
Conclusion:
The short-term trend is bearish, with all major moving averages showing declines. Caution is advised for short-term trading, while mid-term trends still display some optimism.
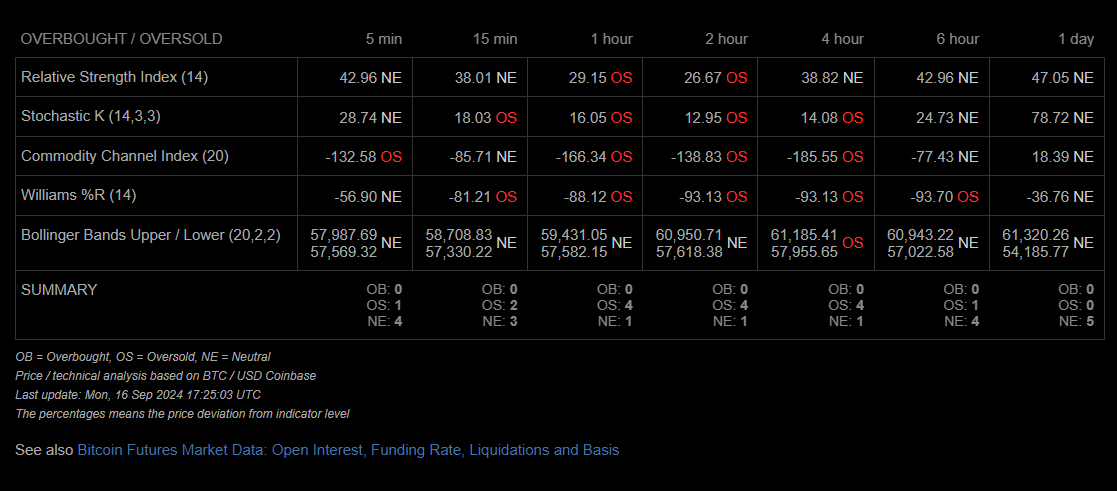
2. Overbought / Oversold Indicators (Coinalyze)
Introduction:
These indicators help identify whether the asset is overbought (indicating a potential reversal down) or oversold (indicating a potential reversal up).
Today’s Data Analysis:
Today’s indicators show strong oversold conditions, particularly the Commodity Channel Index (CCI) and Williams %R. The Relative Strength Index (RSI) across most timeframes is below 30, signaling extreme oversold conditions. Stochastic K also confirms oversold status for shorter timeframes.
Conclusion:
The market is heavily oversold, suggesting a potential for a short-term reversal upwards. However, the magnitude of the oversold signals across multiple indicators points to a market that could still face selling pressure before rebounding.
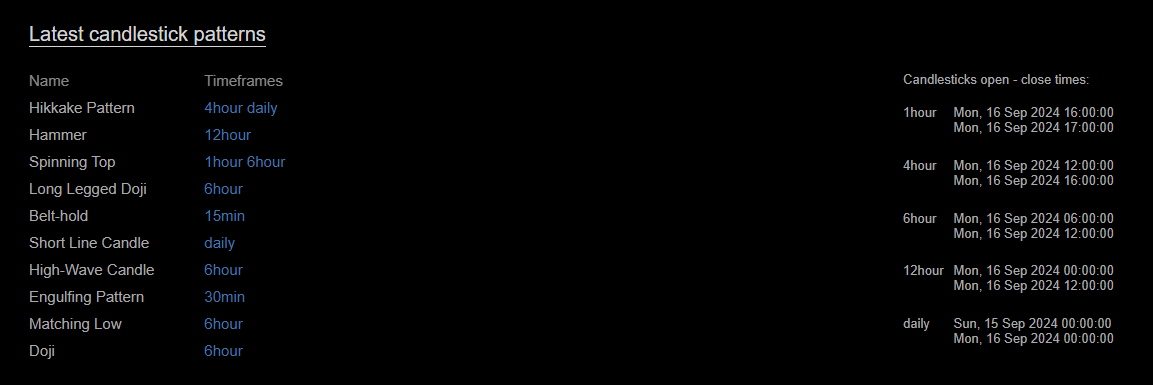
3. Latest Candlestick Patterns (Coinalyze)
Introduction:
Candlestick patterns can give traders insights into potential reversals or continuations in market momentum.
Today’s Data Analysis:
The highlighted patterns, such as the Hikkake and Engulfing patterns, signal possible trend reversals. The presence of a Hammer pattern in the 12-hour timeframe strengthens the potential for a reversal, while the Doji and Spinning Top patterns indicate market indecision.
Conclusion:
Several reversal candlestick patterns suggest that the market may soon shift, particularly if other indicators like volume support this outlook. The hammer pattern, in particular, is a bullish reversal sign after a downward trend.
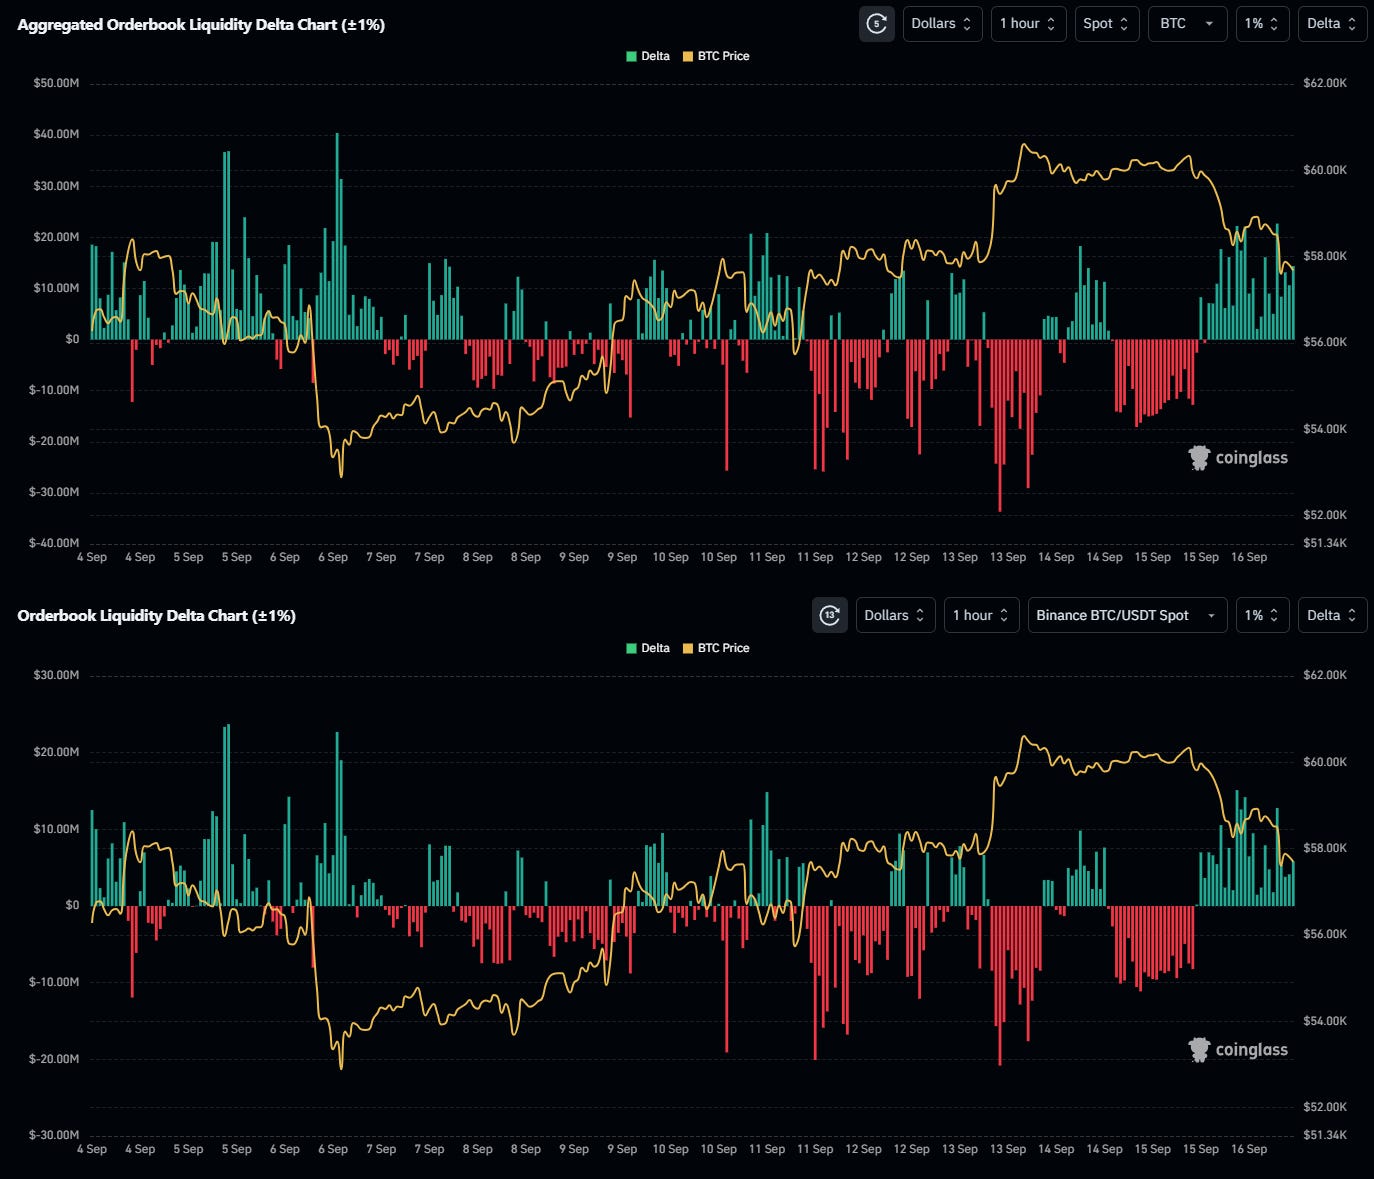
4. Aggregated Orderbook Liquidity Delta Chart (±1%) (Spot) (CoinGlass)
Introduction:
The liquidity delta chart shows buy and sell orders close to the current price, helping assess support and resistance levels in the market.
Today’s Data Analysis:
The liquidity delta shows significant negative pressure, with sell orders outweighing buy orders. There is strong resistance near the $58,000 mark, with significant liquidity entering the order book to cap potential upward movement.
Conclusion:
The liquidity analysis shows that bears are maintaining control, with strong sell pressure present in the market. Breaking above $58,000 will likely face substantial resistance unless liquidity shifts.
5. Orderbook Liquidity Delta Chart (±1%) (Binance BTC/USDT) (CoinGlass)
Introduction:
This chart specifically shows the liquidity on Binance, one of the leading spot exchanges for BTC/USDT trading pairs.
Today’s Data Analysis:
The Binance liquidity chart reflects a similar trend to the aggregated liquidity chart, with significant negative deltas indicating a surplus of sell orders in the orderbook. However, there are pockets of strong buy support near $57,500, suggesting buyers may defend this level.
Conclusion:
The Binance orderbook reflects bearish market sentiment with strong sell pressure. Buyers are attempting to defend key support levels, but they are currently outnumbered by sellers.
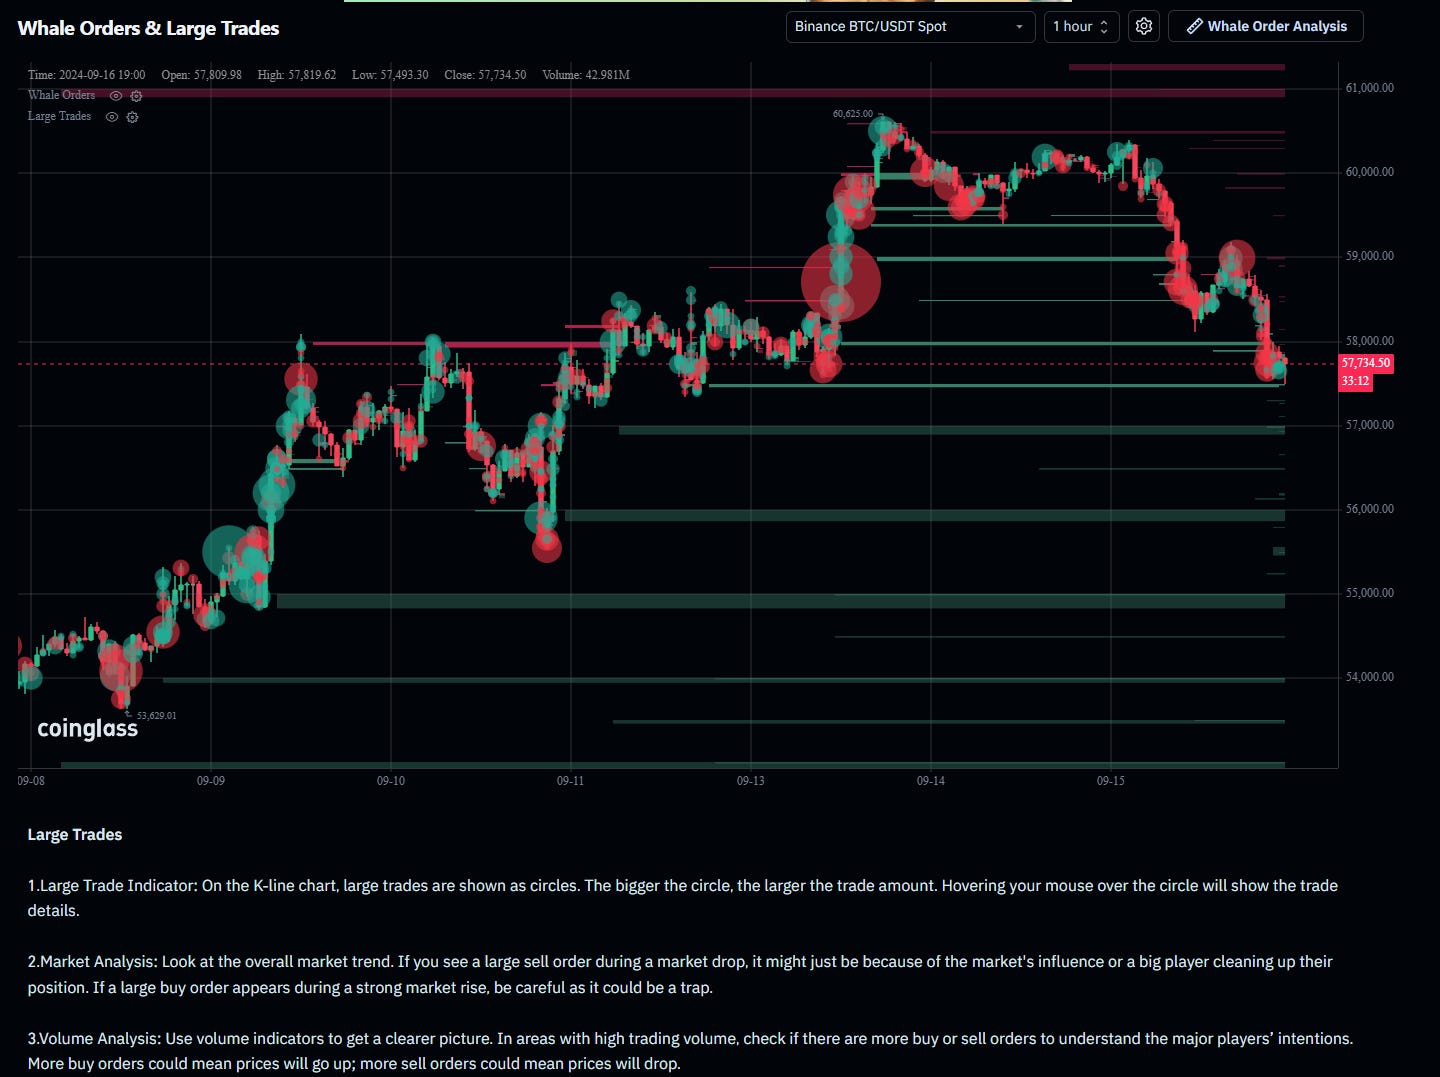
6. Whale Orders & Large Trades (Binance BTC/USDT) (CoinGlass)
Introduction:
Whale orders and large trades can indicate the behavior of institutional traders or large holders in the market.
Today’s Data Analysis:
The chart shows several large sell orders around $58,000, with significant trading volumes clustered around this price level. A notable increase in sell-side whale activity indicates that major players might be taking profits or reducing their exposure at current levels.
Conclusion:
Whale activity suggests strong bearish sentiment, with large sell orders dominating the market. Unless buy-side volume picks up, the price could face further downward pressure.
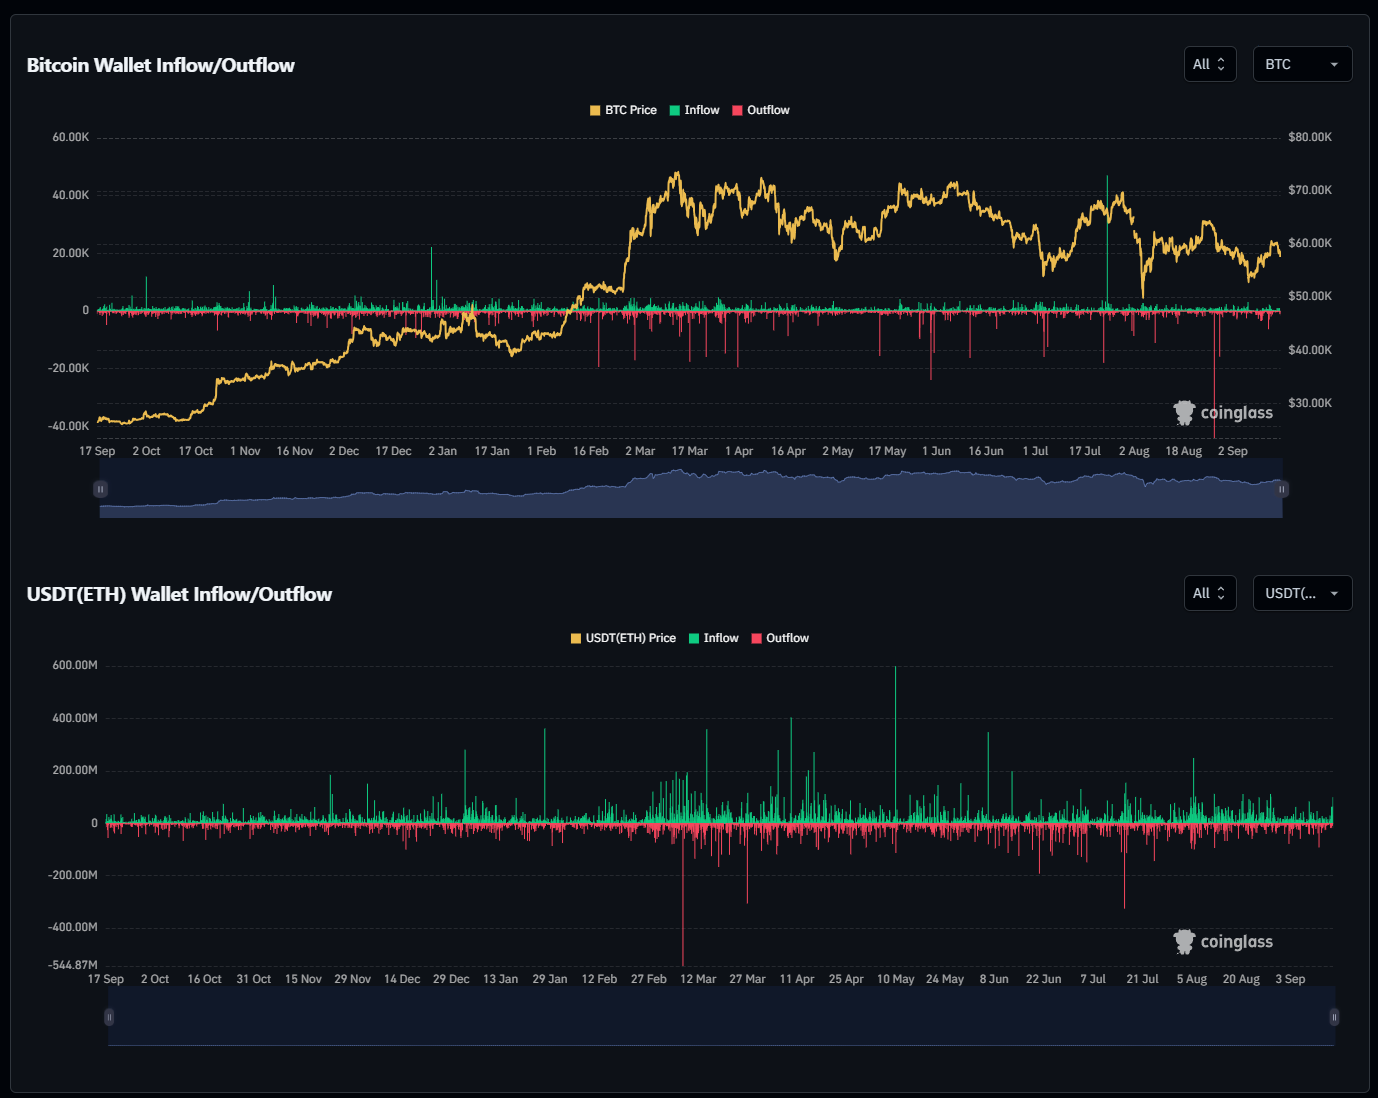
7. Bitcoin Wallet Inflow/Outflow (All Exchanges) (CoinGlass)
Today’s Data Analysis:
The wallet inflow/outflow chart shows a small increase in inflows to exchanges, suggesting that some traders are moving BTC to exchanges, potentially to sell. Outflows have remained relatively stable, but inflows slightly outweigh them.
Conclusion:
The increase in exchange inflows could indicate upcoming selling pressure, as traders move BTC to exchanges to potentially liquidate their holdings. The market may see increased volatility if inflows continue to rise.
8. USDT(ETH) Wallet Inflow/Outflow (All Exchanges) (CoinGlass)
Today’s Data Analysis:
USDT inflows and outflows have remained relatively balanced, with no significant spikes. The stability in USDT movement suggests no major changes in market liquidity, though a slight uptick in inflows could indicate an increase in purchasing power being prepared for the market.
Conclusion:
Stable USDT flows suggest that traders are not making drastic moves in stablecoin positions, although an increase in inflows could indicate readiness for potential buy-side action.
Today’s Spot Data Summary:
Trend Indicators: Bearish momentum across most moving averages.
Overbought/Oversold Indicators: Strong oversold signals across all major indicators, particularly CCI and RSI.
Candlestick Patterns: Several reversal patterns indicate possible upward movement, especially if supported by volume.
Liquidity Delta Charts: Bearish sentiment, with significant sell pressure around $58,000.
Whale Orders: Dominance of sell-side whale activity, contributing to downward pressure.
BTC Wallet Inflows: Slight increase, indicating potential for further selling pressure.
USDT Wallet Inflows: Stable, with potential buying power being held back.
Possible Impact on the Market in the Next 24 Hours:
Expect further downward pressure, especially around the $58,000 resistance. However, oversold conditions and reversal patterns suggest that the market could see a short-term bounce if buyers manage to defend the $57,500 support.
Possible Impact on the Market by the End of the Week (Next Sunday):
By the end of the week, if selling pressure persists and liquidity does not shift, BTC may test support levels around $55,000. However, if oversold conditions trigger a reversal, there is potential for a recovery toward $60,000.
Sentiment Evaluation:
Bullish/Bearish Sentiment from 0 (extreme bearish) to 10 (extreme bullish): 3
The overall sentiment is bearish, with sell pressure dominating and whale orders contributing to downward momentum. However, the oversold indicators provide some optimism for a potential bounce.
Comprehensive Bitcoin Market Analysis: Options, Futures, and Spot Overview with 24-Hour Forecast
1. Overview of Today’s Bitcoin Market Highlights: Options, Futures, and Spot
Options Market:
Implied Volatility (ATM IV): Short-term volatility is increasing, with the 1-day ATM IV rising by 6.75%, signaling that the market expects more significant price movements in the near future. The 1-week ATM IV also increased by 1.70%, showing heightened expectations for price swings over the next few days.
25 Delta Skew: The skew has dropped to -9.78% for short-term expirations, showing a sharp preference for put options, indicating bearish sentiment.
Option Strategies: Bearish strategies such as the Bear Call Spread and Bear Put Spread are dominating the options market, reflecting expectations for downward movements in the short term.
Futures Market:
Open Interest: Futures open interest is concentrated around the $57,500 to $58,000 range, suggesting critical support and resistance zones. Liquidation risks are elevated below $57,000.
Funding Rates: Funding rates are neutral, indicating no strong bias between long and short positions, though the market leans slightly bearish due to short-term positioning.
Liquidations: Significant long liquidation levels are clustered below $57,500. A break below this level could accelerate selling pressure.
Spot Market:
Trend Indicators: Short-term moving averages show bearish momentum, while mid-term indicators, such as the 7-day averages, hint at a slight bullish recovery. However, the general trend remains downward.
Overbought/Oversold Indicators: Strong oversold signals are present, with the RSI and other indicators suggesting a potential short-term reversal.
Whale Activity: Whale orders are concentrated around $58,000, with significant sell-side pressure, contributing to the overall bearish sentiment.
2. Market Sentiment Evaluation
Overall, the market sentiment is bearish. This is supported by the increased demand for put options, bearish options strategies, and whale sell-side activity. Despite the neutral funding rates, short-term bearish bias dominates across multiple market segments, reflecting concerns over a potential price decline.
However, oversold conditions in the spot market could lead to a short-term bounce. The presence of reversal patterns in candlestick charts provides some optimism for buyers.
3. 24-Hour Forecast: Price Movement, Support, and Resistance
Possible Price Movement: Bitcoin could continue to face downward pressure, especially if it breaks below the $57,000 support level. A failure to hold this level could lead to accelerated selling due to liquidations.
Support Levels: $57,000 is the key support area to watch, with additional support around $55,000 if the selling intensifies.
Resistance Levels: Resistance remains strong at $58,000 due to concentrated whale sell orders. Breaking above this level would require substantial buying volume.
4. Will Bitcoin Follow the Current Price Trend?
Based on today’s analysis, Bitcoin is likely to follow the current bearish trend in the short term. The pressure from whale sell orders, increased open interest around resistance levels, and liquidations near $57,000 indicate a high risk of further downside. While oversold indicators suggest the possibility of a minor rebound, the dominant sentiment remains bearish, and a break below key support levels could drive prices lower.
In summary, while a brief recovery is possible, the overall trend points toward continued downward movement before stabilization.


