#BTC Showdown: Key Levels and Market Sentiment You Can't Miss This Week!
BTC Options Market Analysis (Based on Today's Data)
1. Implied Volatility (IV)
Todays Data Analysis:
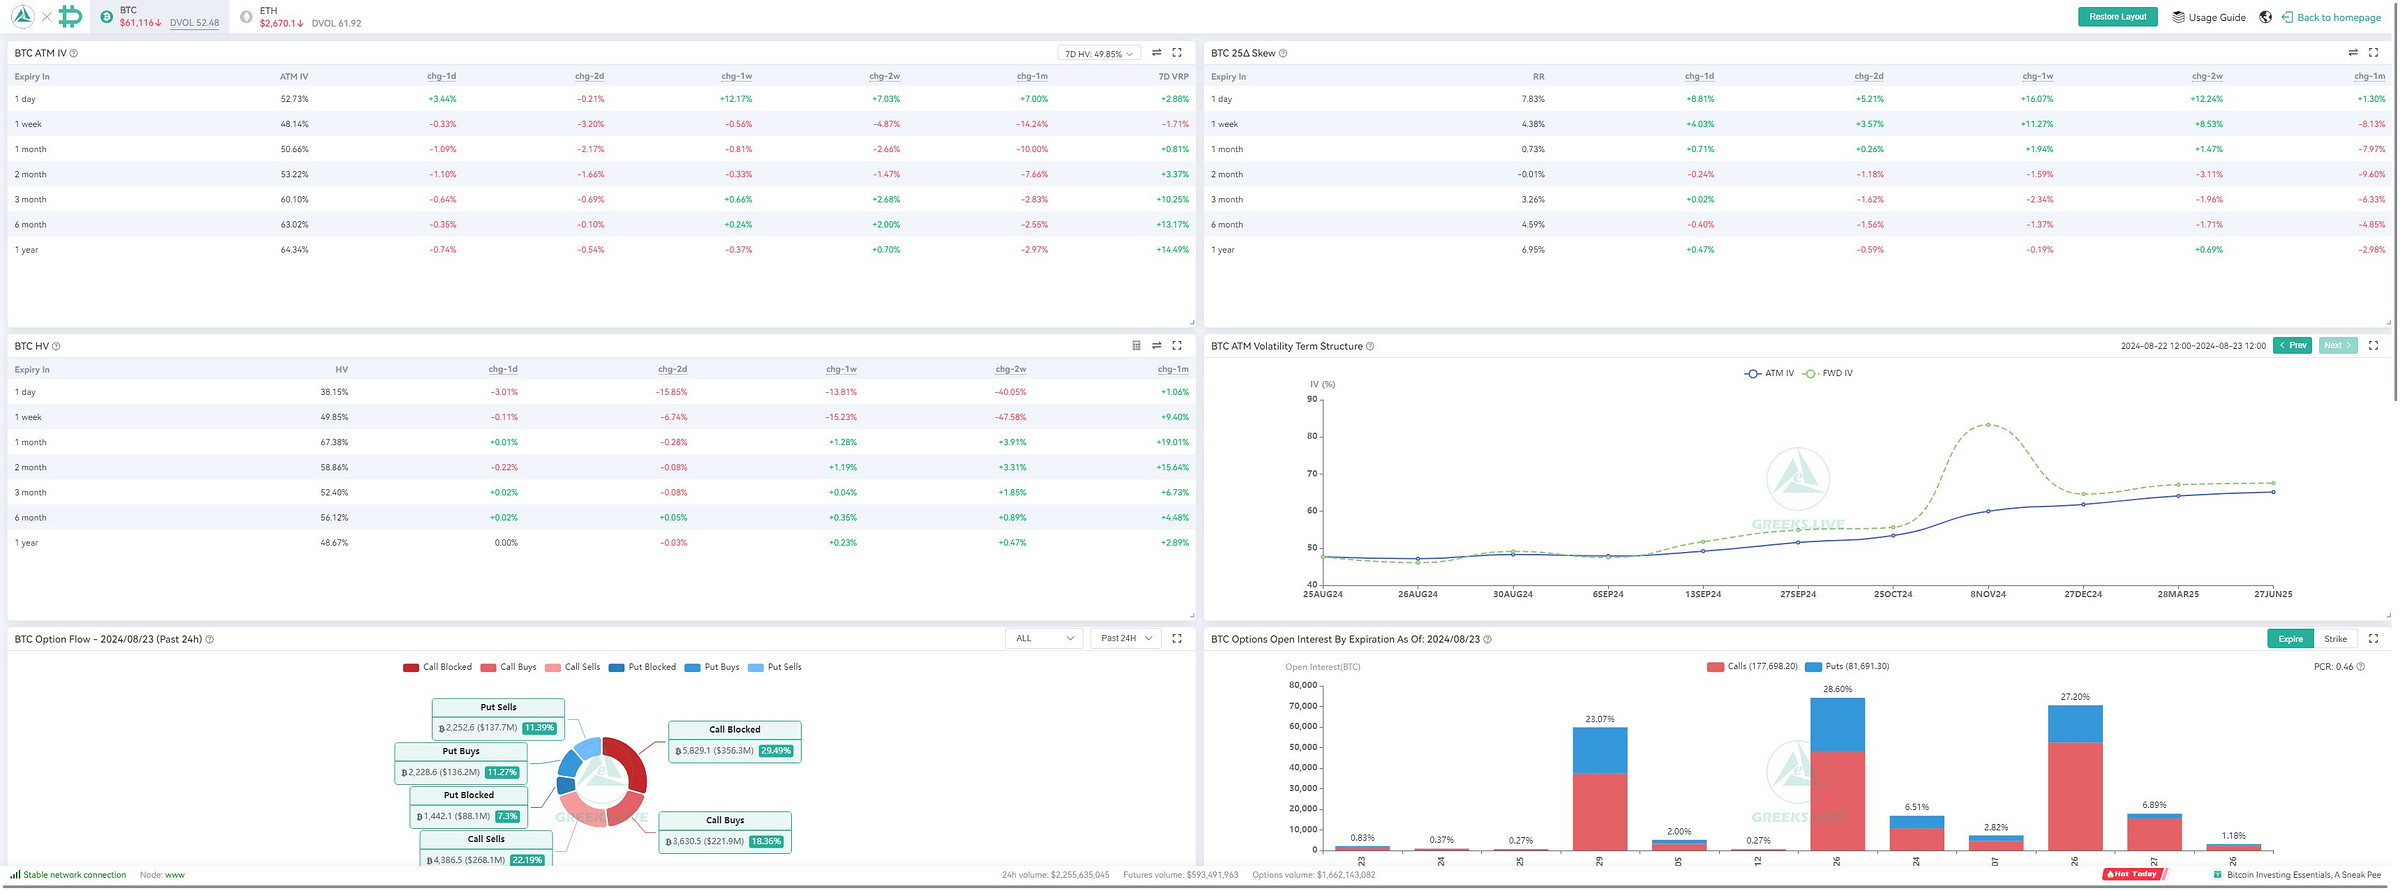
Implied Volatility (IV) across different expiries shows varying trends. The 1-day IV increased by 3.44%, indicating that traders are expecting significant price movements in the very short term. Longer-term IVs are more stable or show slight decreases.
Conclusion:
The increase in short-term IV suggests traders are bracing for potential volatility, possibly due to upcoming events or market uncertainty.
2. 25 Delta Skew
Todays Data Analysis:
The 25 Delta Skew for the 1-day expiry has risen by 8.81%, indicating increased demand for out-of-the-money puts. This shift reflects a bearish bias among traders for the very short term.
Conclusion:
The rising skew indicates traders are hedging against a potential downturn, reflecting a cautious market sentiment.
3. Historical Volatility (HV)
Todays Data Analysis:
Historical Volatility (HV) has decreased across most timeframes, with a significant drop of 3.01% in the 1-day HV. This suggests that recent price movements have been less volatile than what the market had previously anticipated.
Conclusion:
The decrease in HV suggests that the market has been relatively stable recently, which might contrast with the higher IV, indicating a potential mispricing or anticipation of future volatility.
4. Volatility Risk Premium (VRP)
Todays Data Analysis:
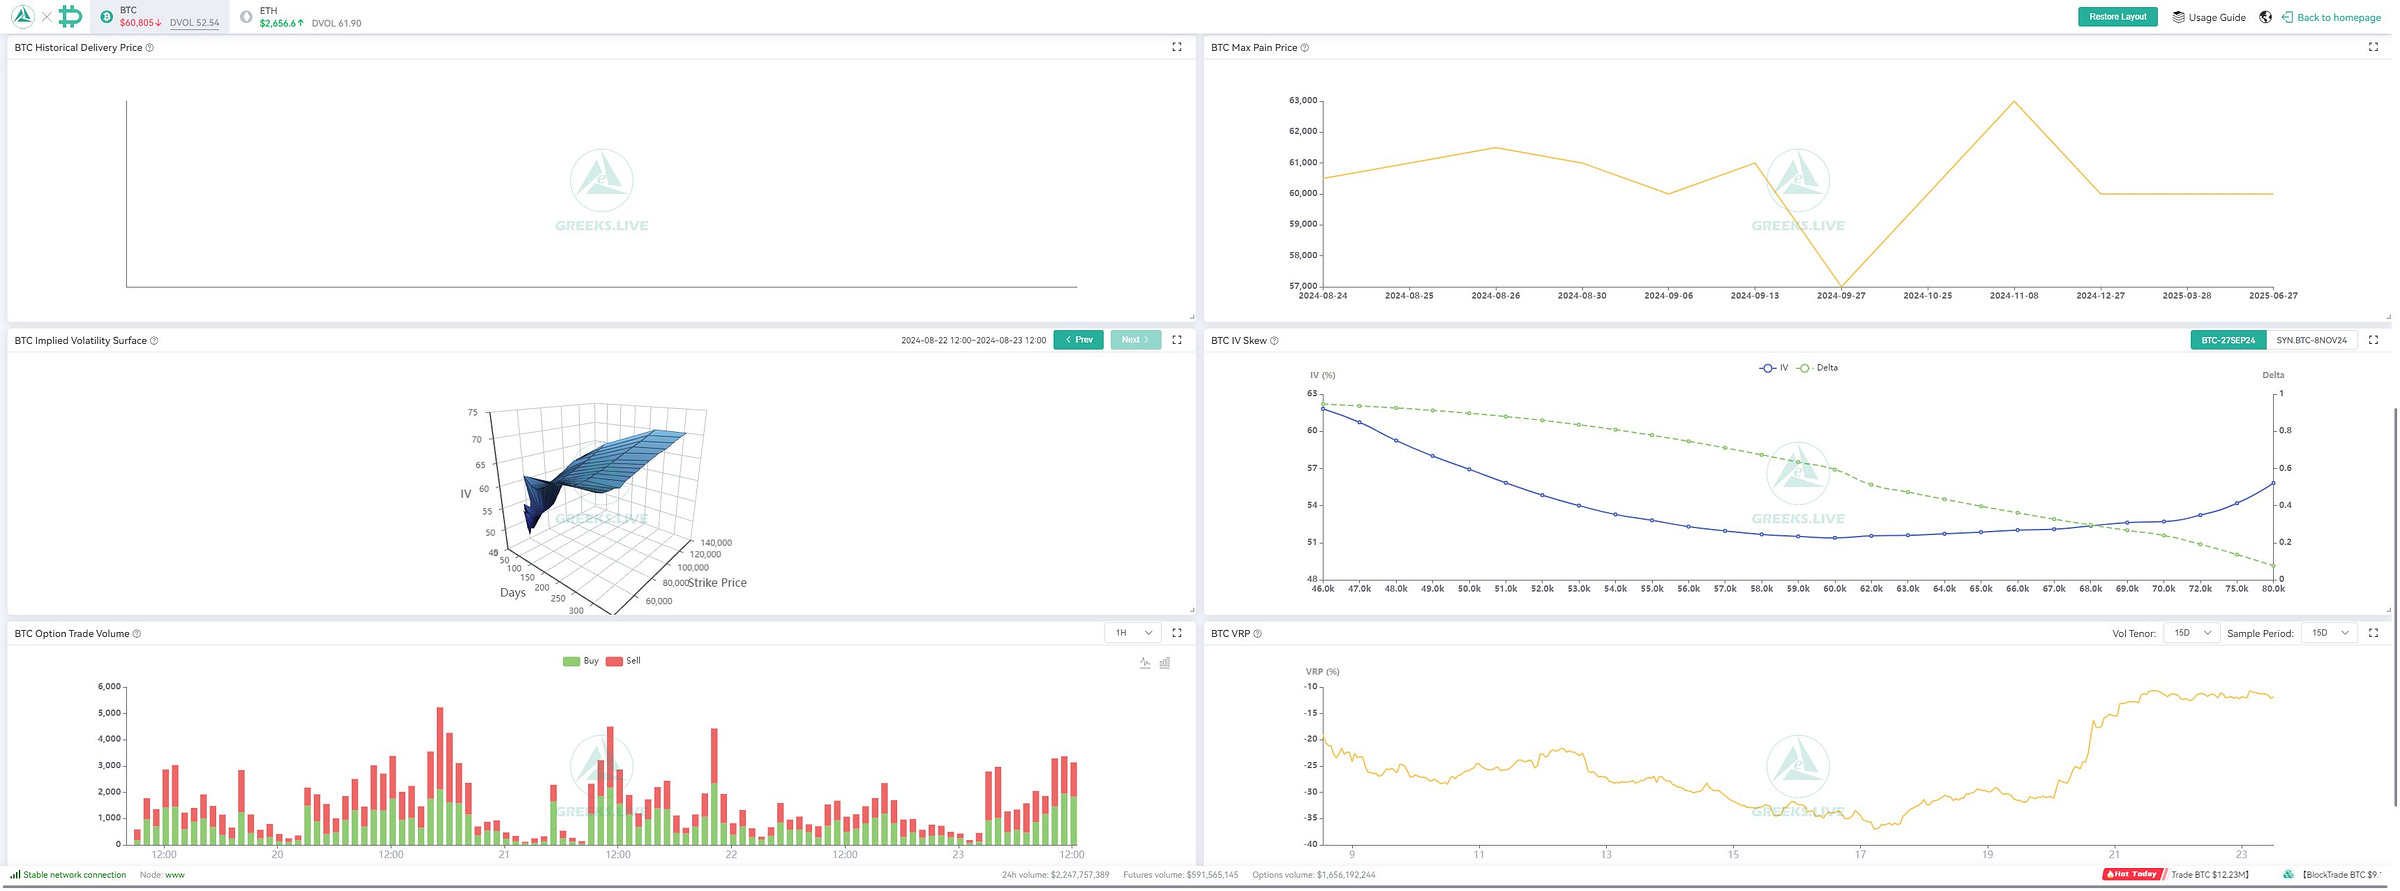
The Volatility Risk Premium (VRP) for the short-term (7 days) has slightly decreased. This narrowing gap between IV and HV suggests that traders' expectations of future volatility are becoming more aligned with recent historical volatility.
Conclusion:
A narrowing VRP indicates a more balanced market perception of risk, though the short-term outlook remains uncertain.
5. Option Flow
Todays Data Analysis:
Option flows show a mix of activity, with a slight preference for put buying. The significant call blocking suggests that traders are locking in positions, possibly in anticipation of a major move.
Conclusion:
Option flows indicate a market hedging against potential downside, with traders taking a cautious stance.
6. Strategy Flows
Todays Data Analysis:
Strategy flows reveal a mix of call and put blocks, suggesting that traders are positioning for both potential upward and downward movements, with no clear directional bias.
Conclusion:
The mixed strategy flows highlight a market in a wait-and-see mode, with traders preparing for volatility in either direction.
7. Greeks
Todays Data Analysis:
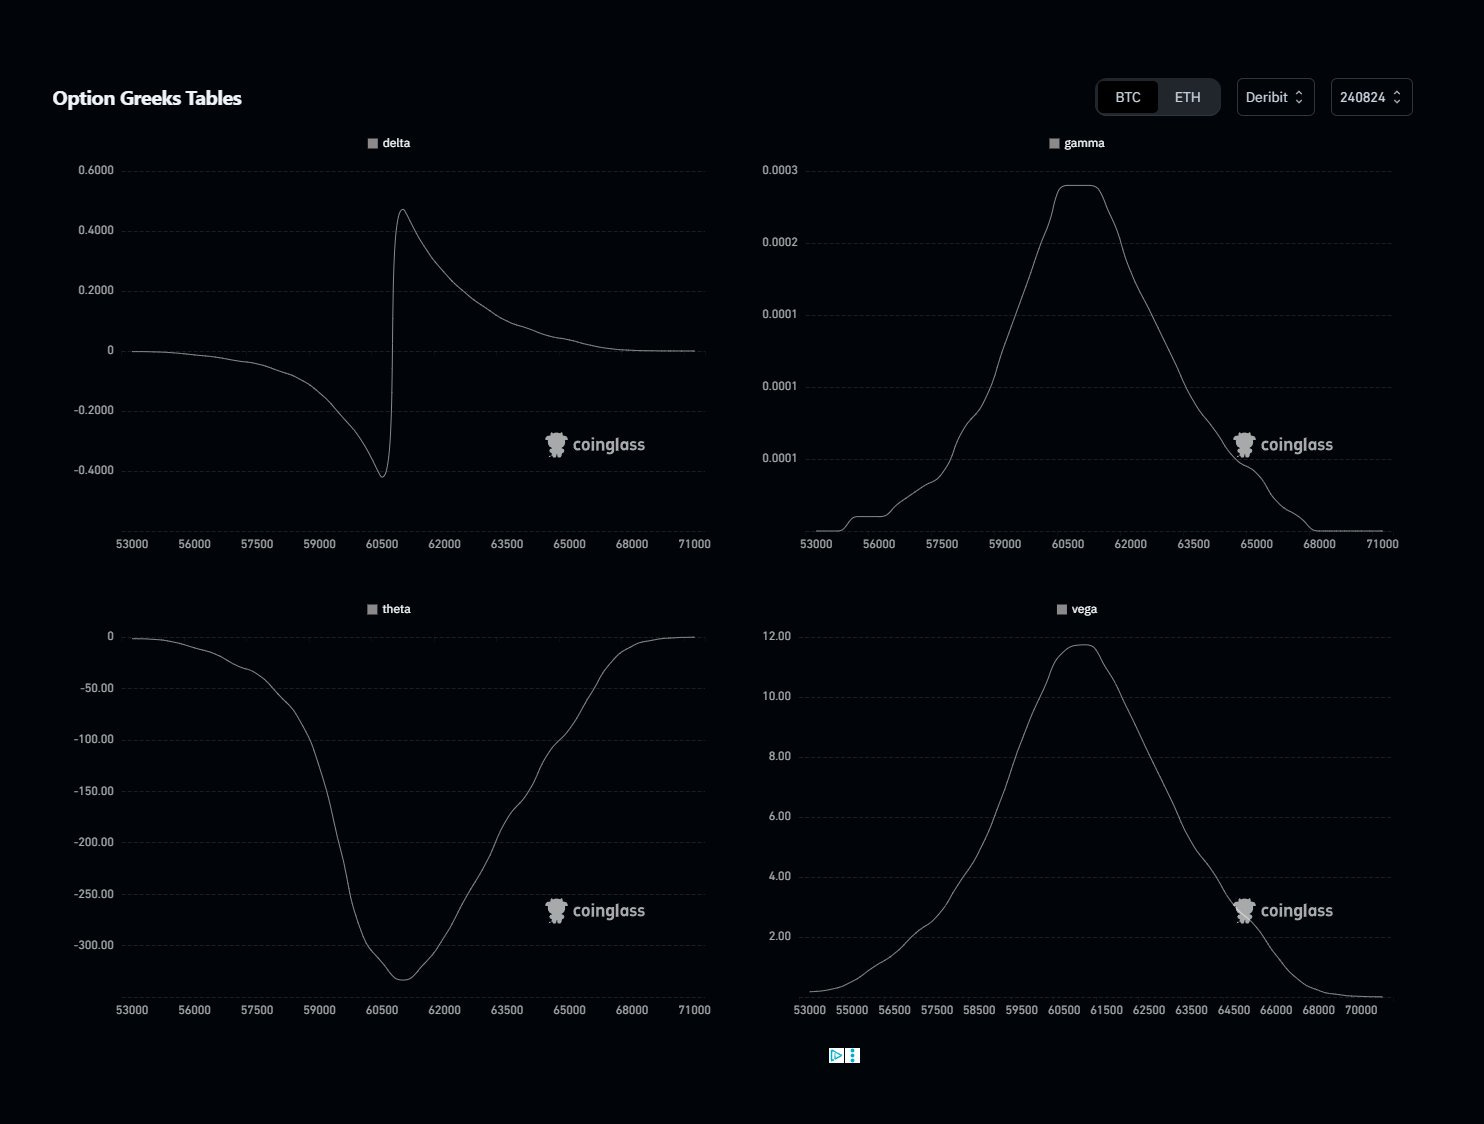
The Greeks analysis shows significant Delta and Gamma peaks around the $60,500 - $61,500 range, highlighting these as critical price levels. The sensitivity to volatility, as indicated by Vega, is also elevated.
Conclusion:
The concentration of Greek sensitivity around key levels suggests that any movement near these prices could lead to significant market reactions.
Todays Options Data Summary
The options data reflects a market preparing for short-term volatility, with a slightly bearish skew. Traders are hedging against potential price declines while positioning for possible large moves.
Possible Impact on the Market in the Next 24 Hours
Given the rise in short-term IV and skew, expect potential price volatility, with a bias towards downside risk. The market may test support levels around $60,500.
Possible Impact on the Market by the End of the Week (25.08.2024)
If the bearish sentiment persists, BTC could potentially drop towards lower support levels, possibly around $59,000. However, any significant macroeconomic news could influence this outlook.
Sentiment Evaluation:
Bewertung: 4/10 (Moderately Bearish)
The market sentiment leans towards caution, with traders preparing for possible downside risks in the immediate term.
BTC Futures Market Analysis (Based on Today's Data)
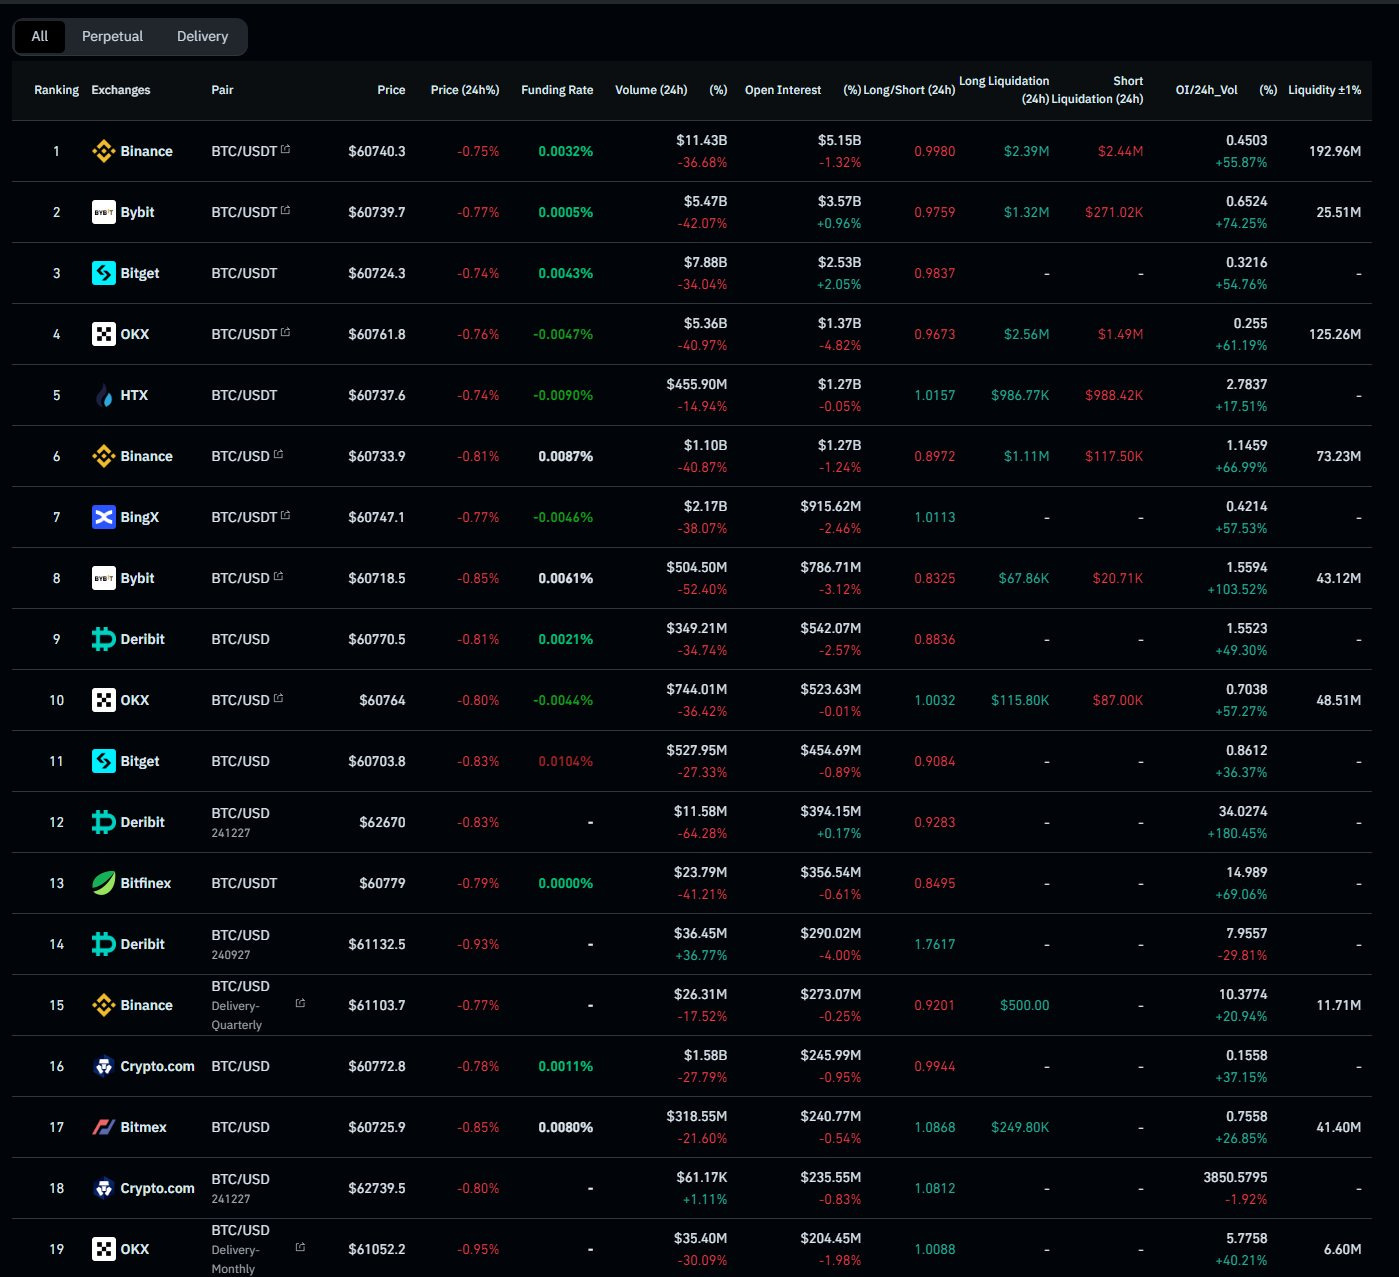
1. Price Movement and Volume
Today's Data Analysis:
BTC prices have shown a slight decline across multiple exchanges, with volume decreasing significantly, indicating a drop in trading activity.
Conclusion:
The market is experiencing reduced momentum with the potential for further downside if volume doesn't pick up.
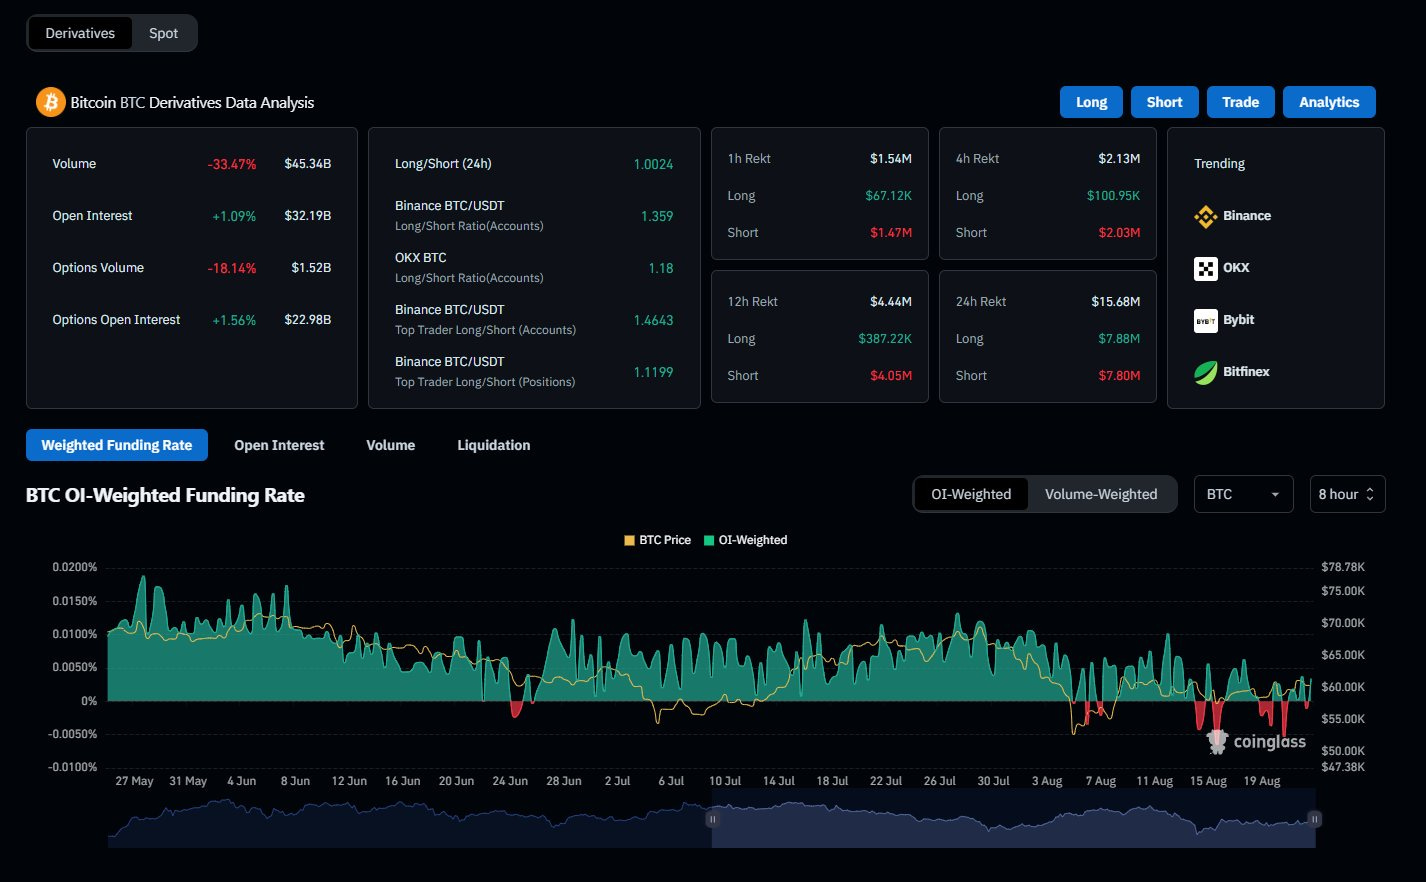
2. Funding Rate
Today's Data Analysis:
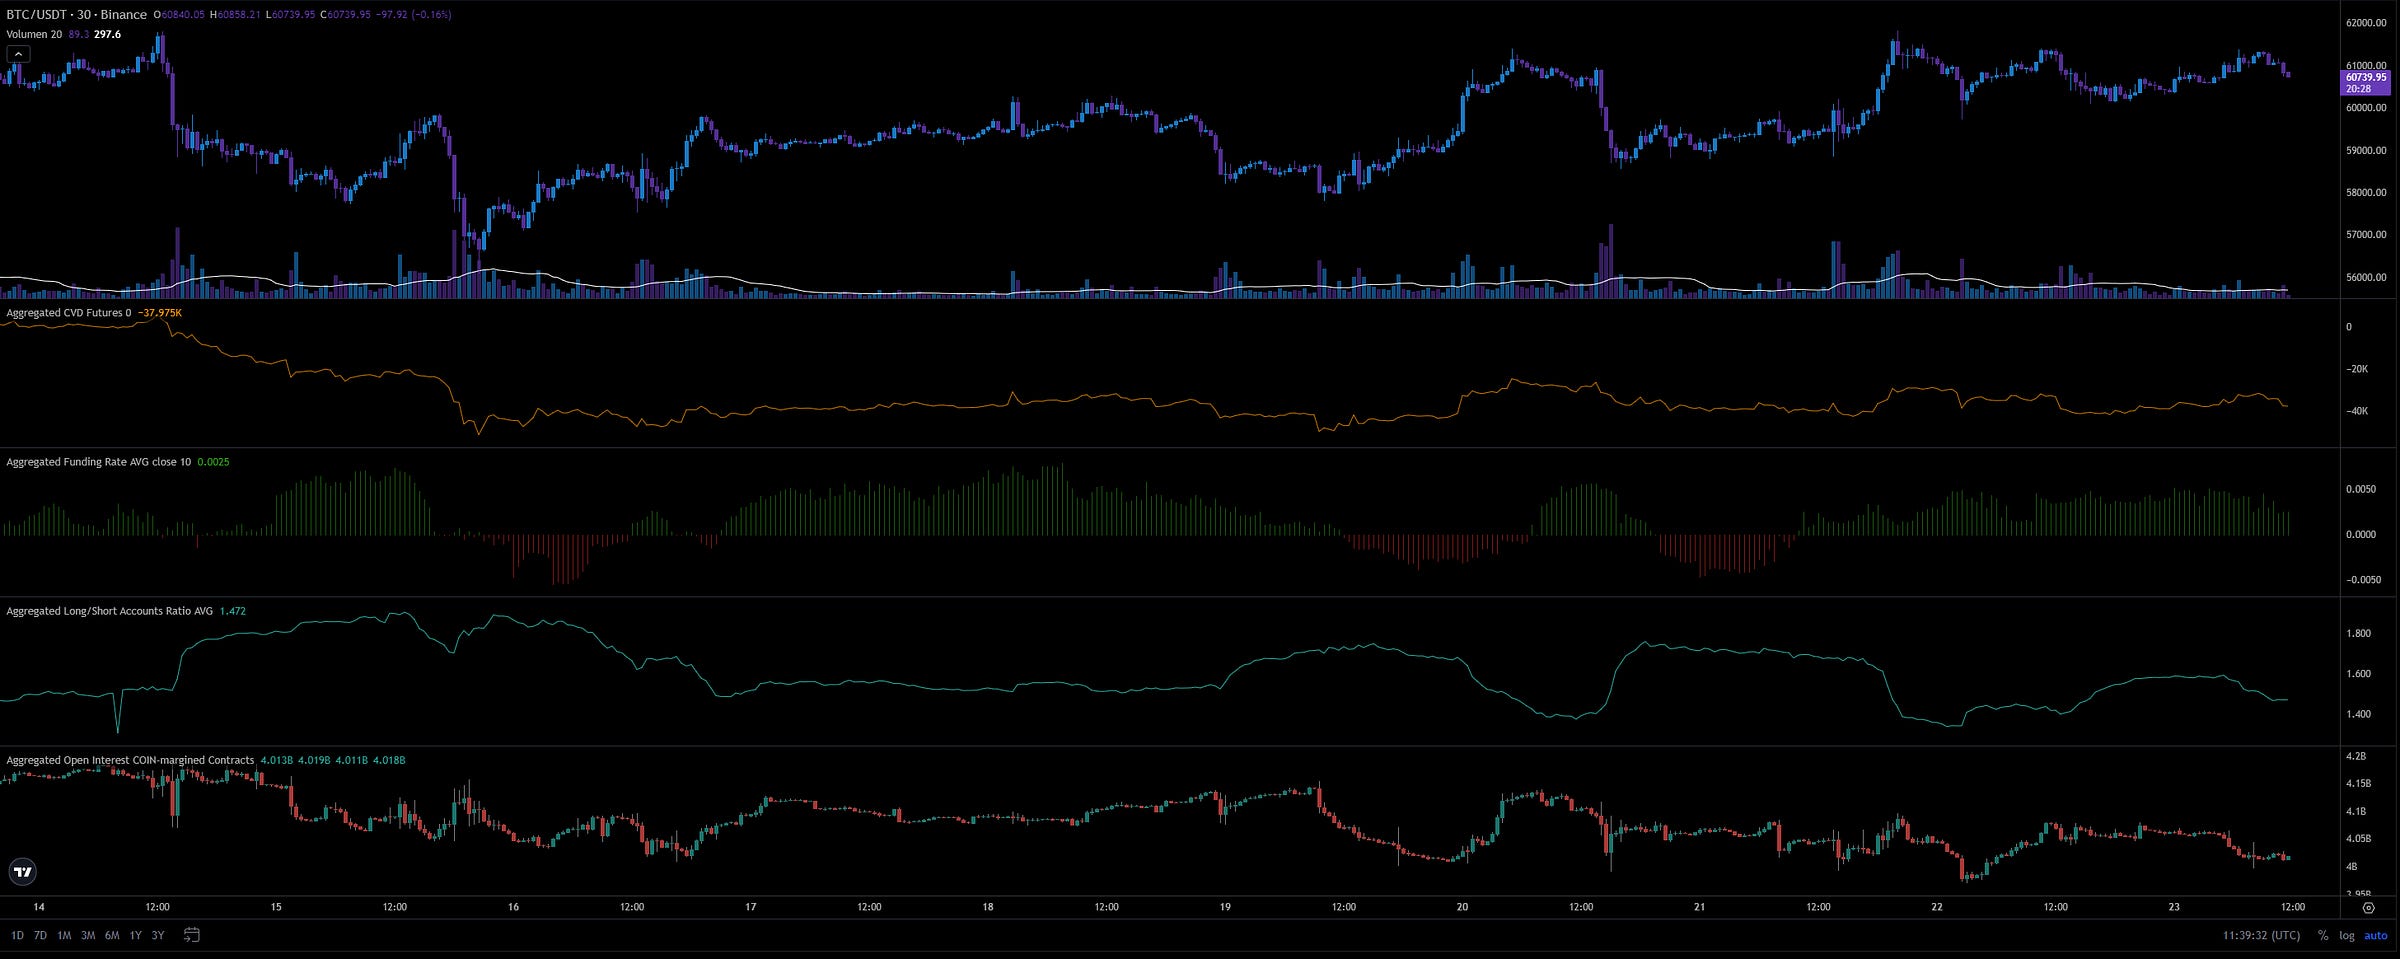
The funding rates are slightly positive but vary across exchanges, with some negative rates indicating an increase in short positions.
Conclusion:
The market sentiment is mixed, with slight bullish bias but growing short interest.
3. Cumulative Volume Delta (CVD) and Open Interest
Today's Data Analysis:
CVD indicates dominance by sellers, with a steady decline, while open interest is rising, signaling new positions, likely bearish.
Conclusion:
Increasing open interest during a price decline suggests more traders are entering short positions.
4. Long/Short Ratio
Today's Data Analysis:
The long/short ratio is close to parity, with a slight tilt toward long positions.
Conclusion:
The market is indecisive, with no clear dominance by either side.
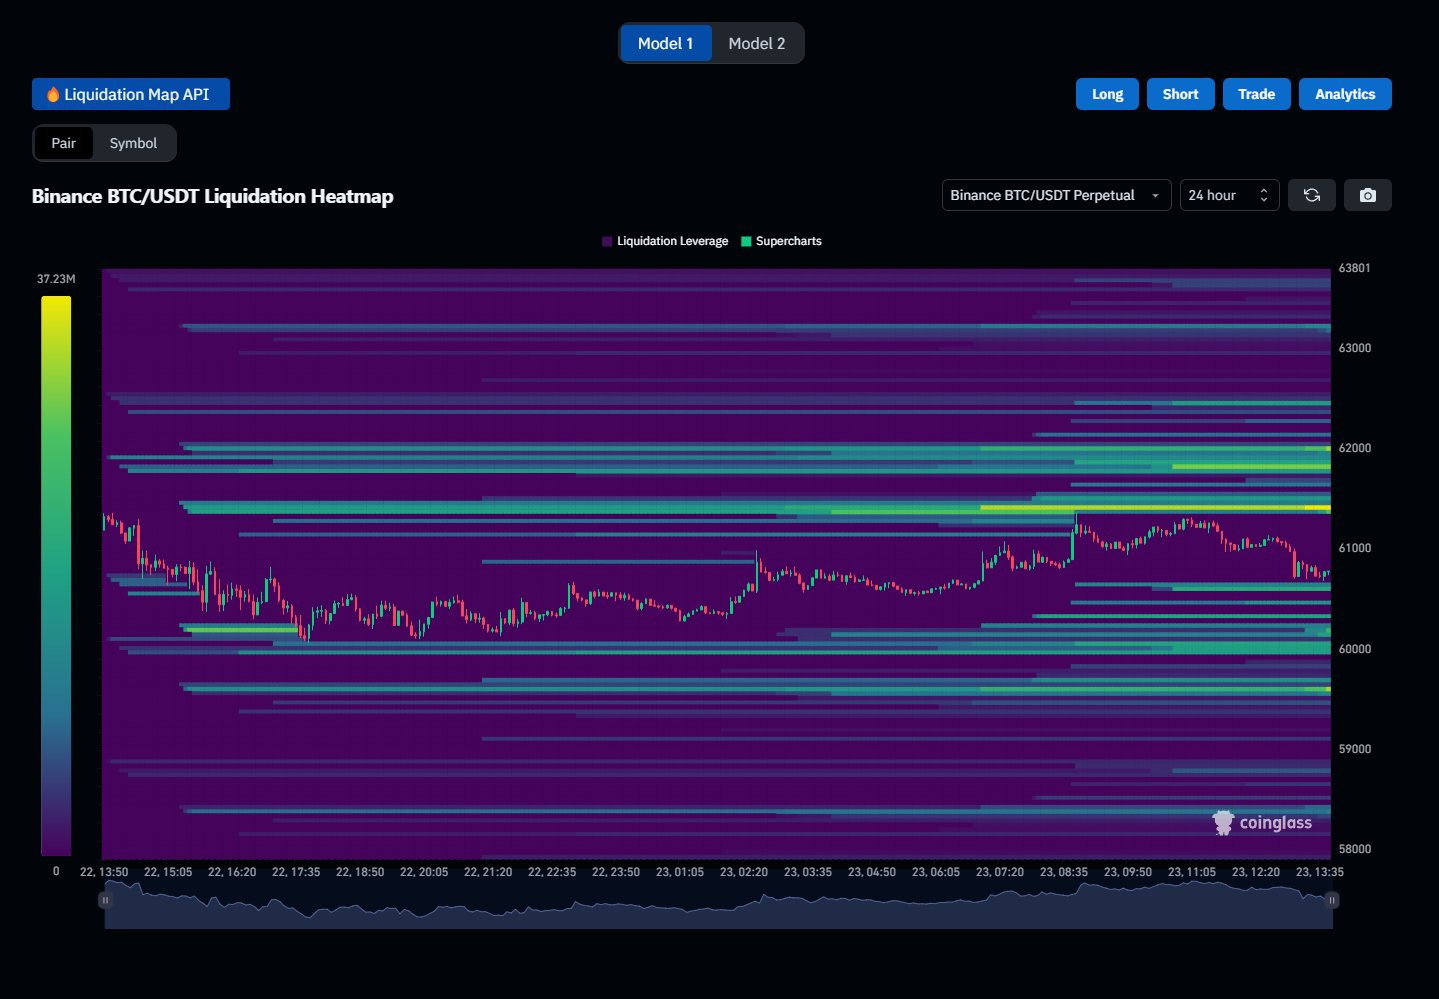
5. Binance BTC/USDT Liquidation Heatmap
Today's Data Analysis:
The heatmap shows significant liquidation levels just below current prices, indicating potential volatility if these levels are breached.
Conclusion:
A move lower could trigger a cascade of liquidations, leading to further price declines.
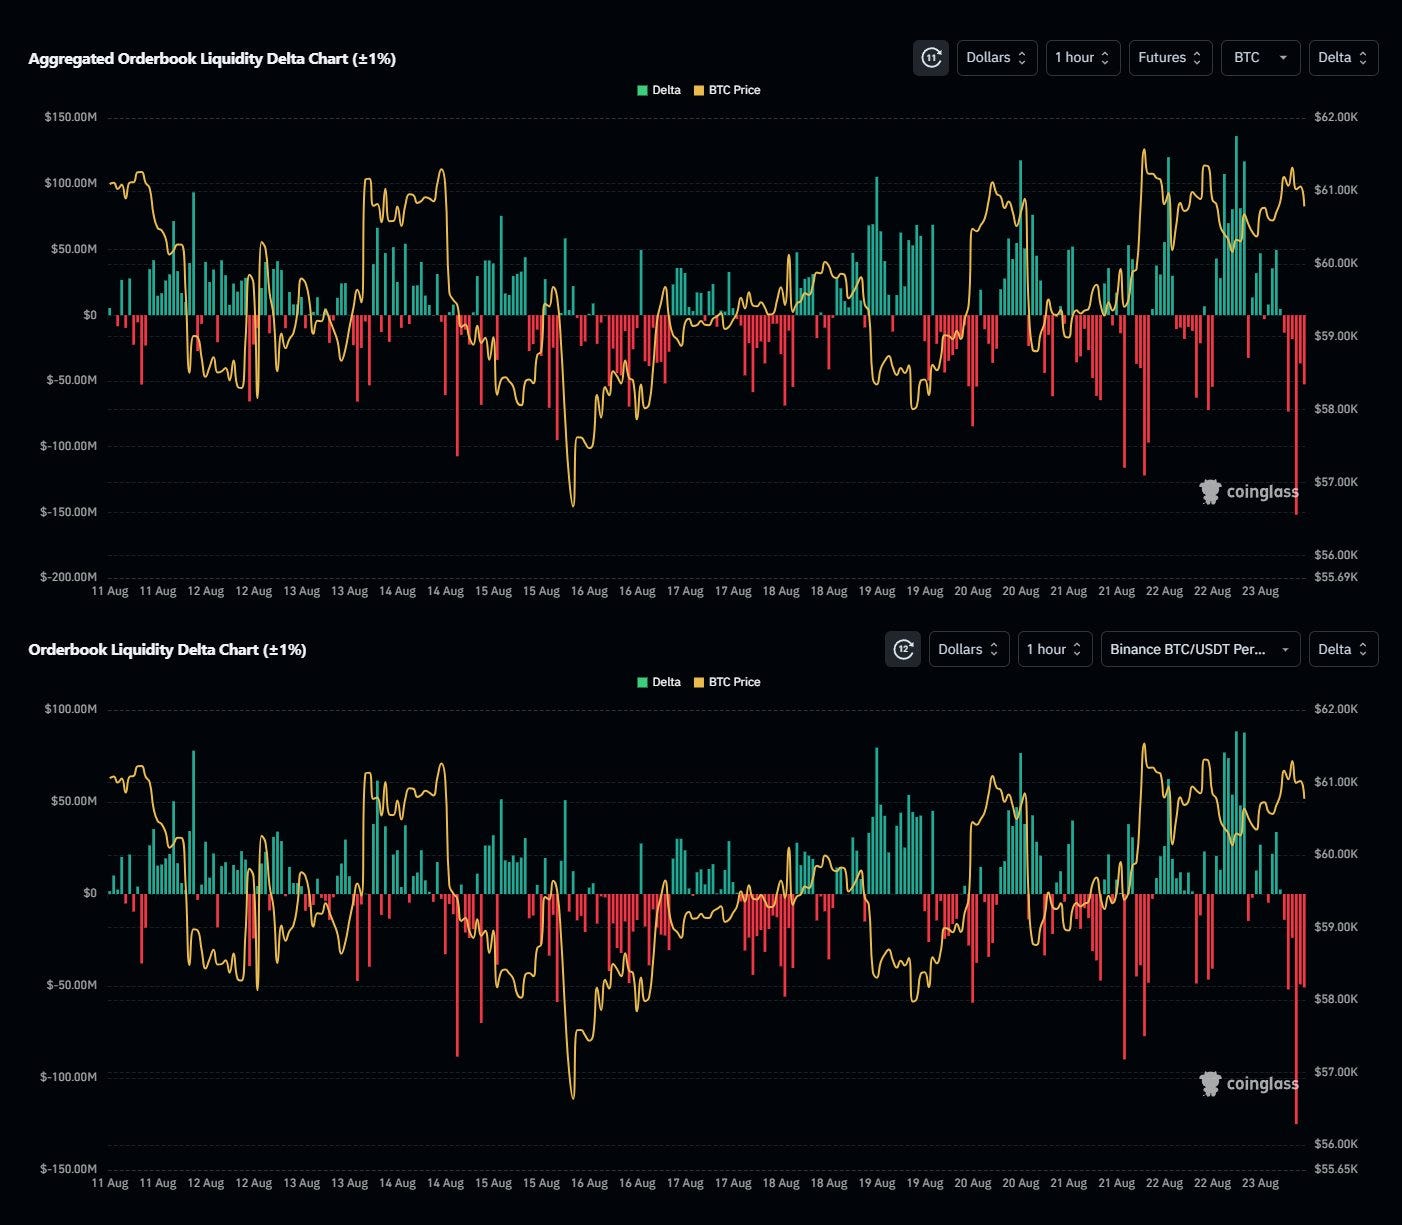
6. Futures Orderbook Liquidity Delta
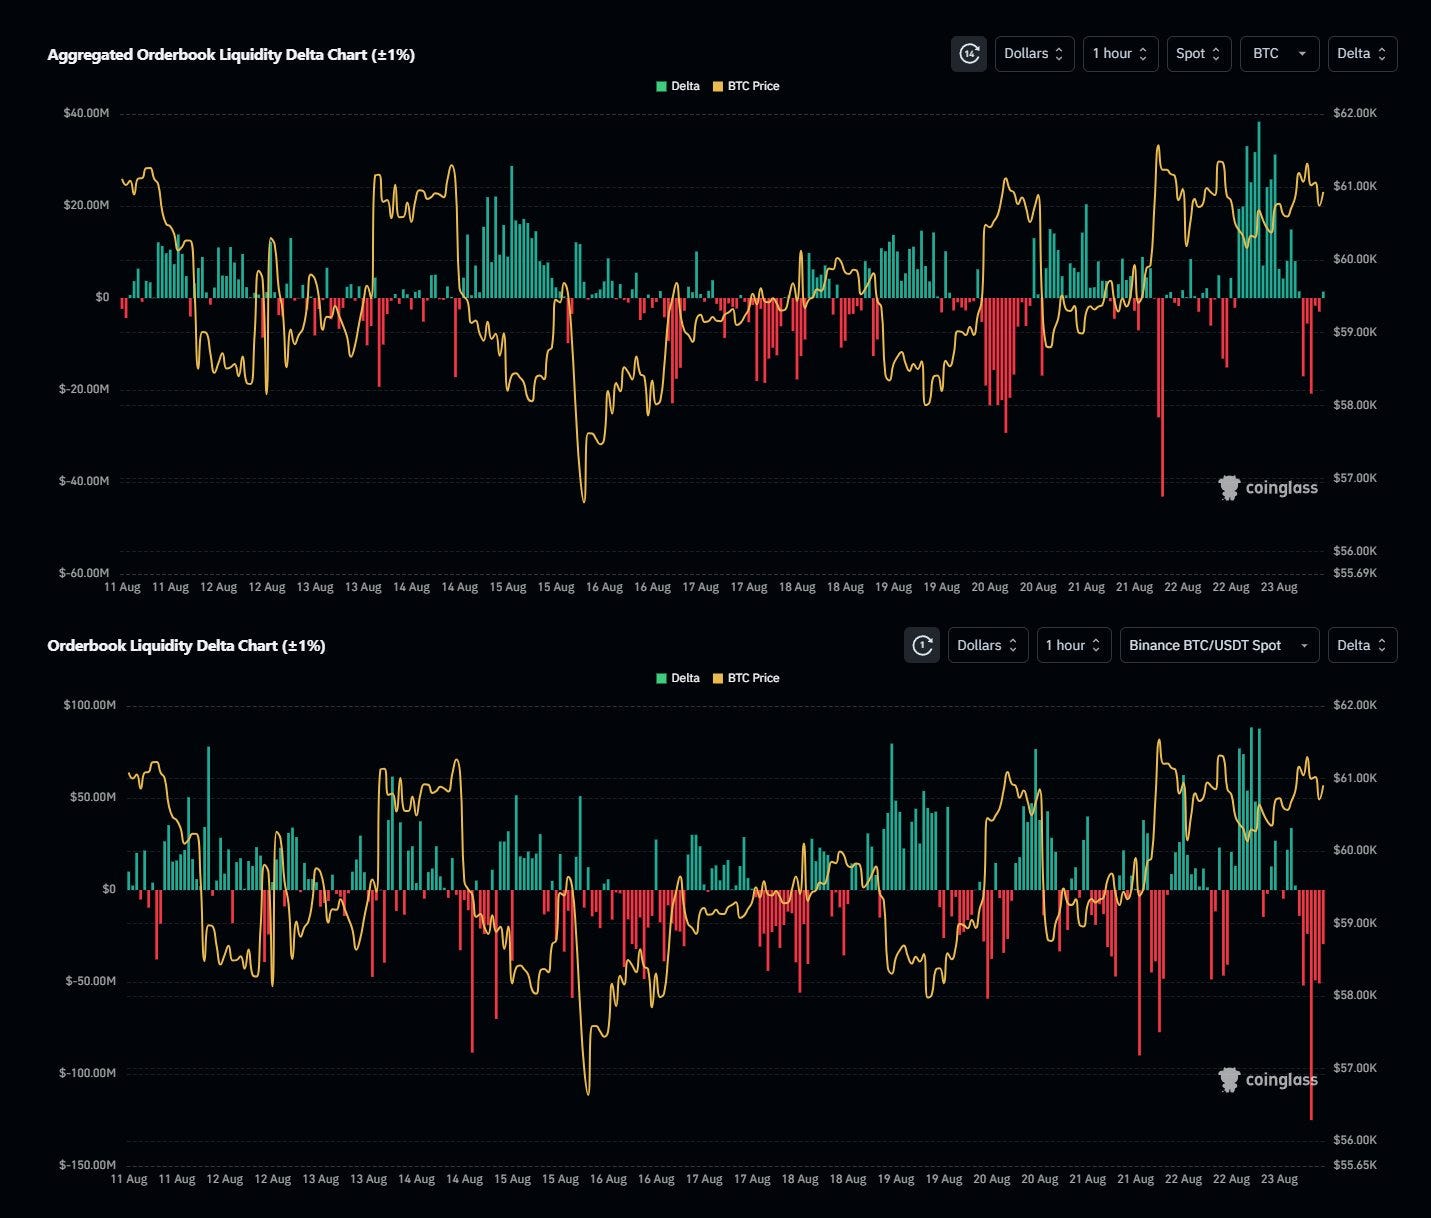
Aggregated Orderbook Liquidity Delta Chart (±1%)
Today's Data Analysis:
The chart shows a dominance of negative deltas, indicating stronger sell-side pressure.
Conclusion:
The market is under selling pressure, which could lead to further price declines.
Orderbook Liquidity Delta Chart (±1%) (Binance BTC/USDT Perpetual)
Today's Data Analysis:
Similar trends are seen on Binance, reinforcing the bearish sentiment.
Conclusion:
Sell-side pressure on Binance's order book suggests further potential downside.
Today's Futures Data Summary
Sentiment:
Bearish sentiment is evident, with increasing short interest, declining prices, and sell-side pressure in the order books.
Possible Impact on the Market in the Next 24 Hours
Expectations:
Further downside potential with a risk of increased volatility if key levels are breached, leading to liquidations.
Possible Impact on the Market by the End of the Week (25.08.2024)
Expectations:
Continued bearish momentum could persist, with a possible test of lower support levels and further liquidations.
Sentiment Evaluation
Overall Sentiment: Bearish
Rating: 3/10 (with 0 being extremely bearish and 10 being extremely bullish)
BTC Spot Market Analysis (Based on Today's Data)
1. Price Movement and Volume
Today's Data Analysis:
The price is currently hovering around $60,967, with relatively stable volume. There was an attempt to push above $61,000, but it encountered resistance.
Conclusion:
The market is testing key resistance levels around $61,000. A successful break above this level could trigger a bullish move, but low volume suggests cautious trading.
2. Spot Orderbook Liquidity Delta
Aggregated Orderbook Liquidity Delta Chart (±1%)
Today's Data Analysis:
The aggregated orderbook shows fluctuating liquidity, with a slight tilt towards selling pressure as BTC approaches $61,000.
Conclusion:
The market is experiencing mixed sentiment, with sell orders capping upward momentum. A break above this resistance could shift sentiment.
Orderbook Liquidity Delta Chart (±1%) (Binance BTC/USDT)
Today's Data Analysis:
The Binance-specific data mirrors the aggregated chart, showing resistance at $61,000 with increased sell-side liquidity.
Conclusion:
Spot market participants on Binance are contributing to the resistance at $61,000, suggesting this is a critical level to watch for a potential breakout.
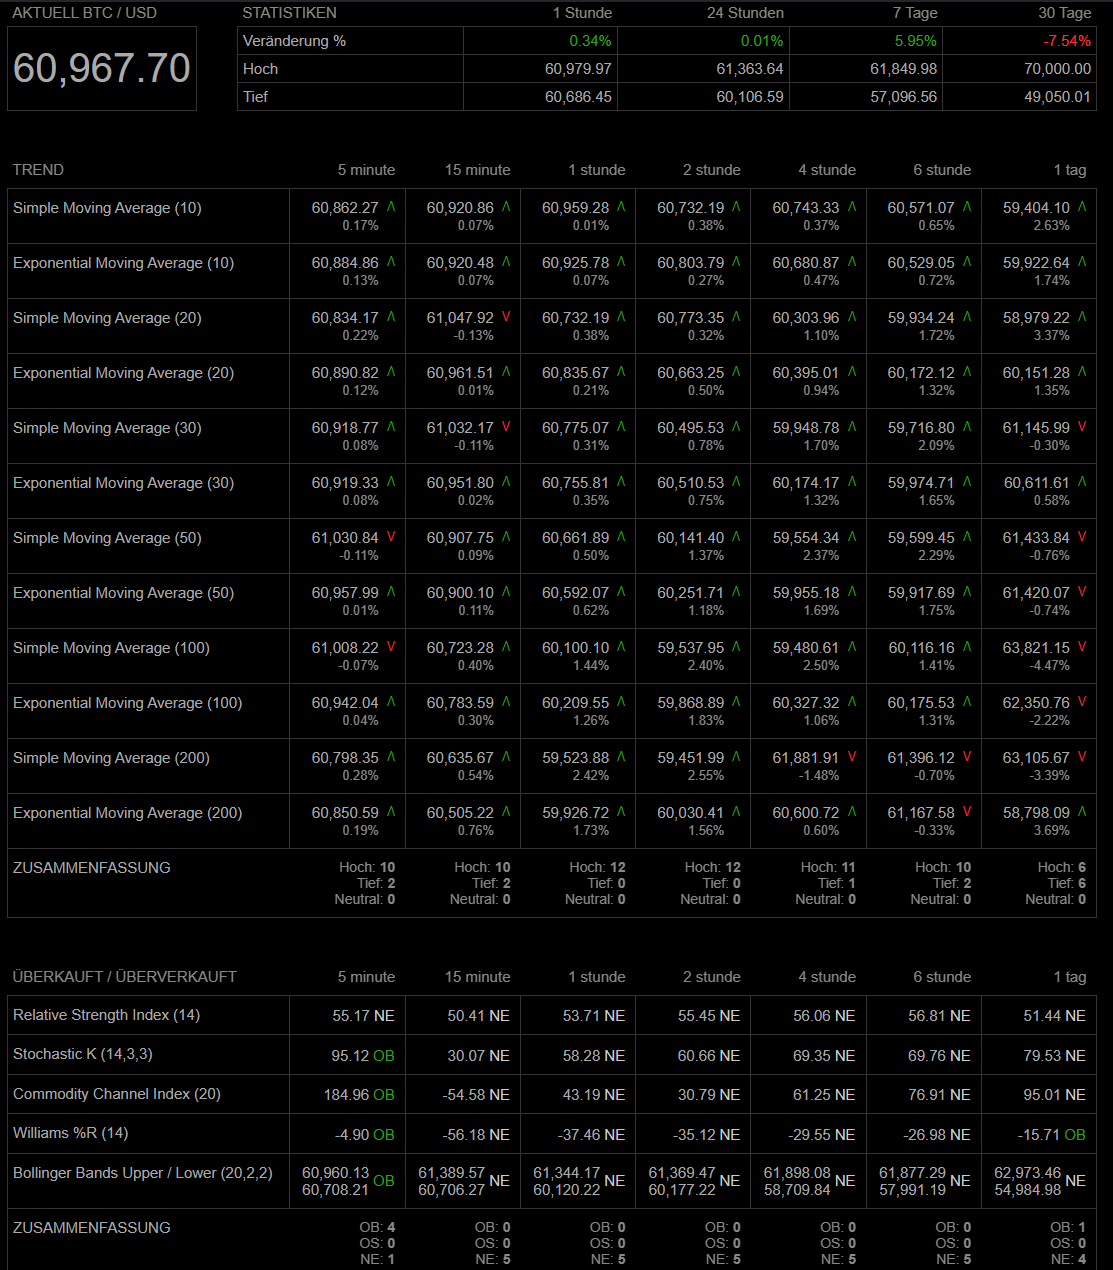
3. Technical Analysis
Today's Data Analysis:
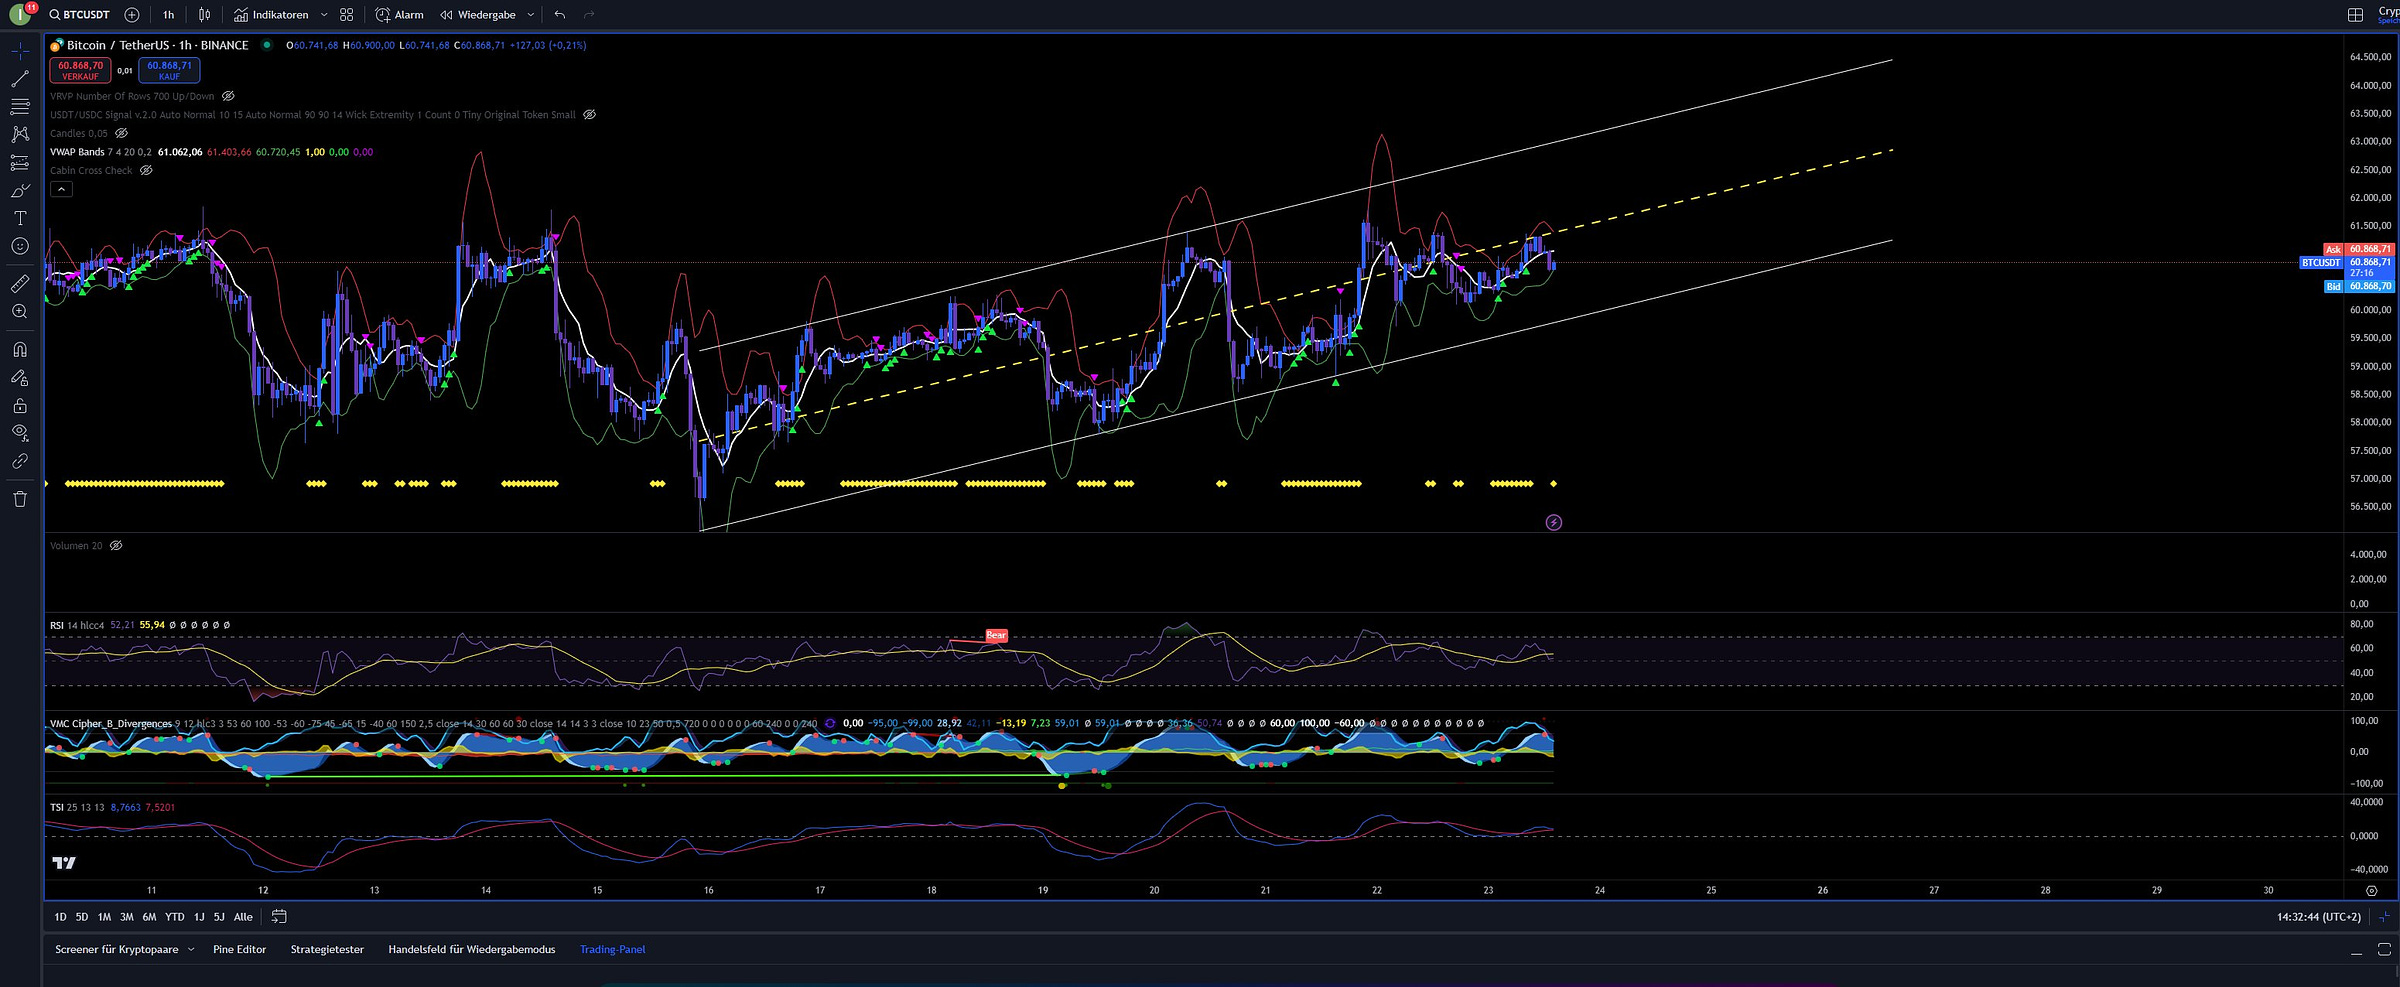
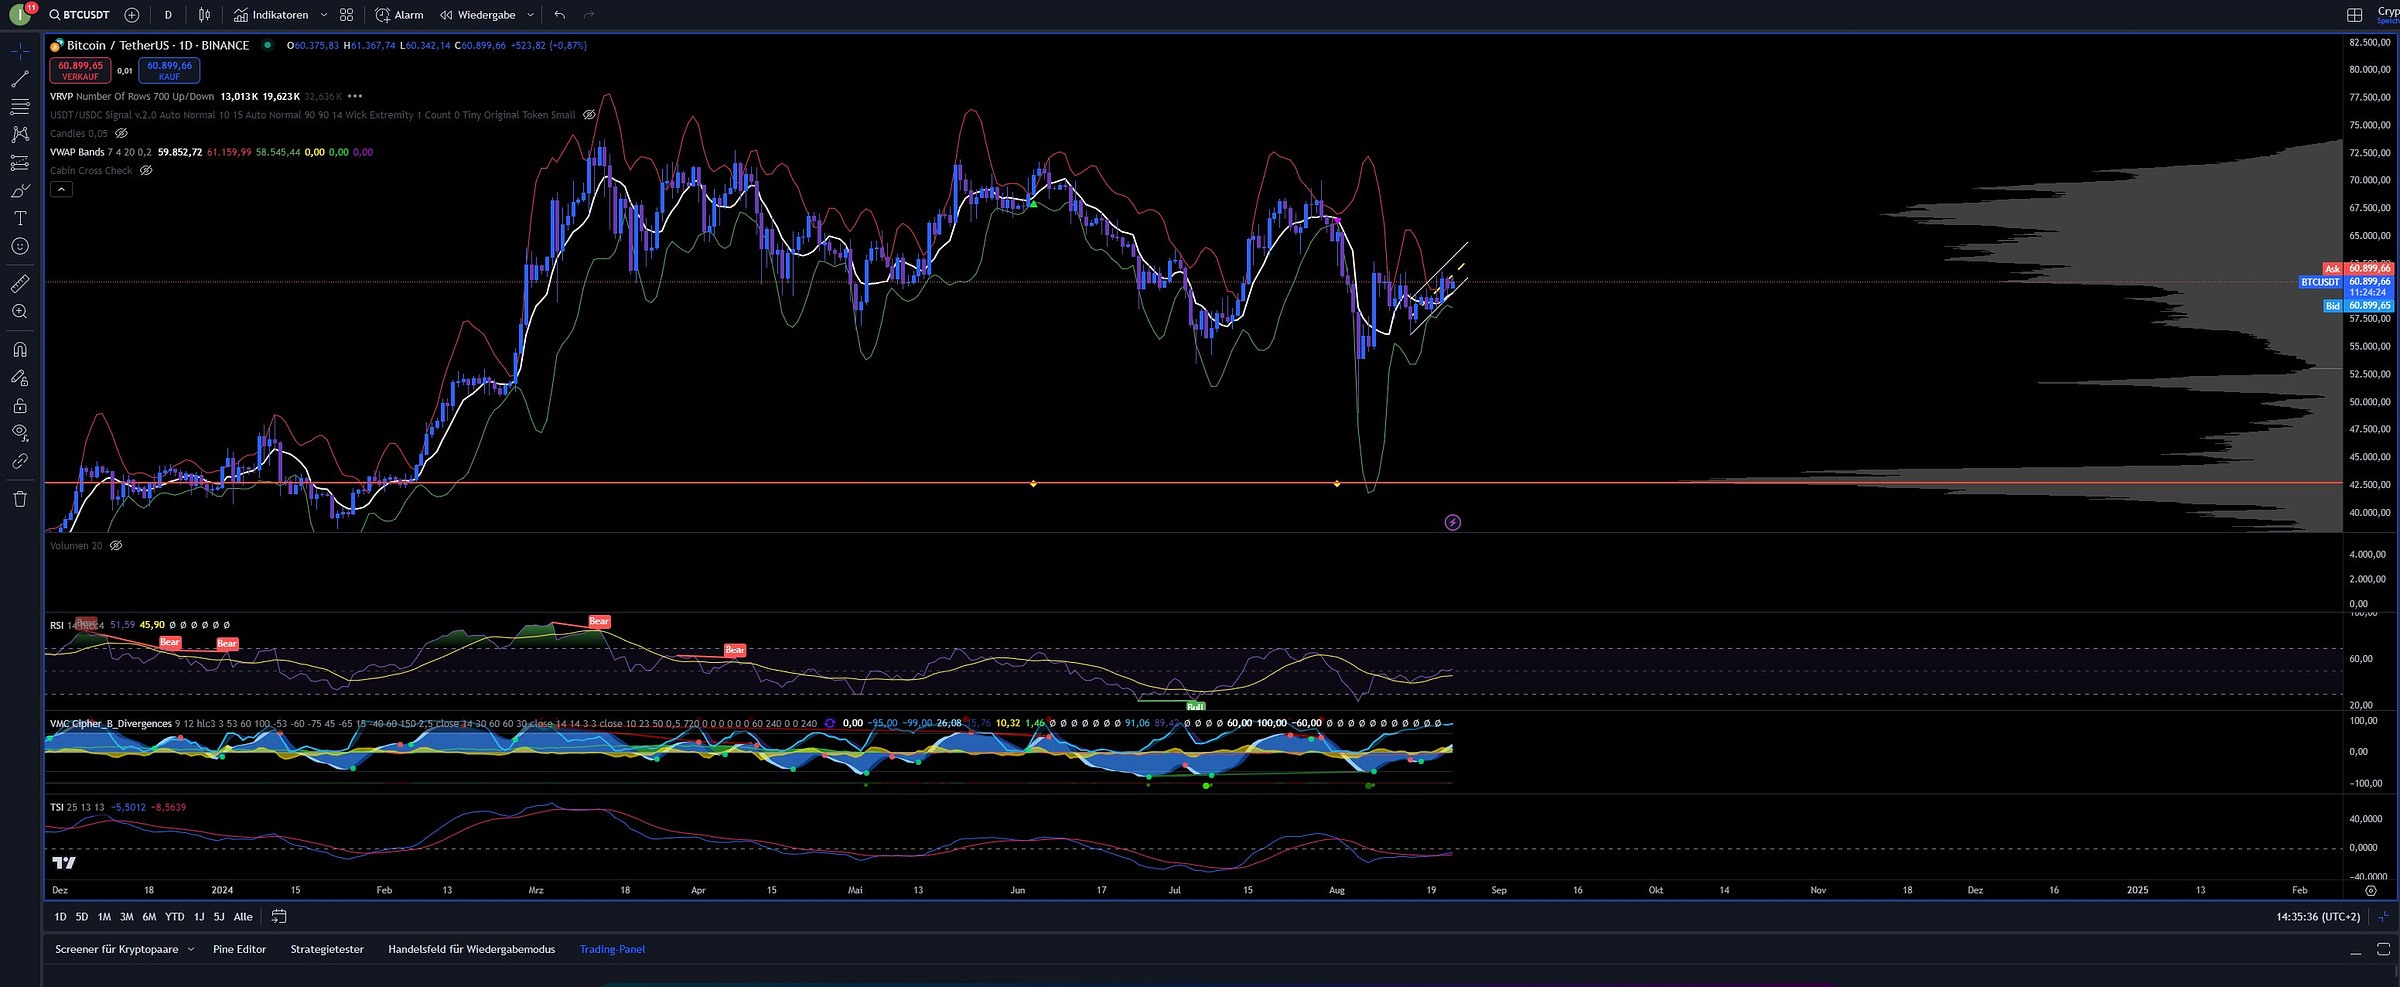
Indicators like RSI on the 1H TF suggest neutral to slightly bullish momentum, but the 1D chart shows bearish divergences and bearish momentum in the TSI.
Conclusion:
The market is in a consolidation phase, with mixed signals from technical indicators. The immediate price action will depend on whether BTC can break through $61,000.
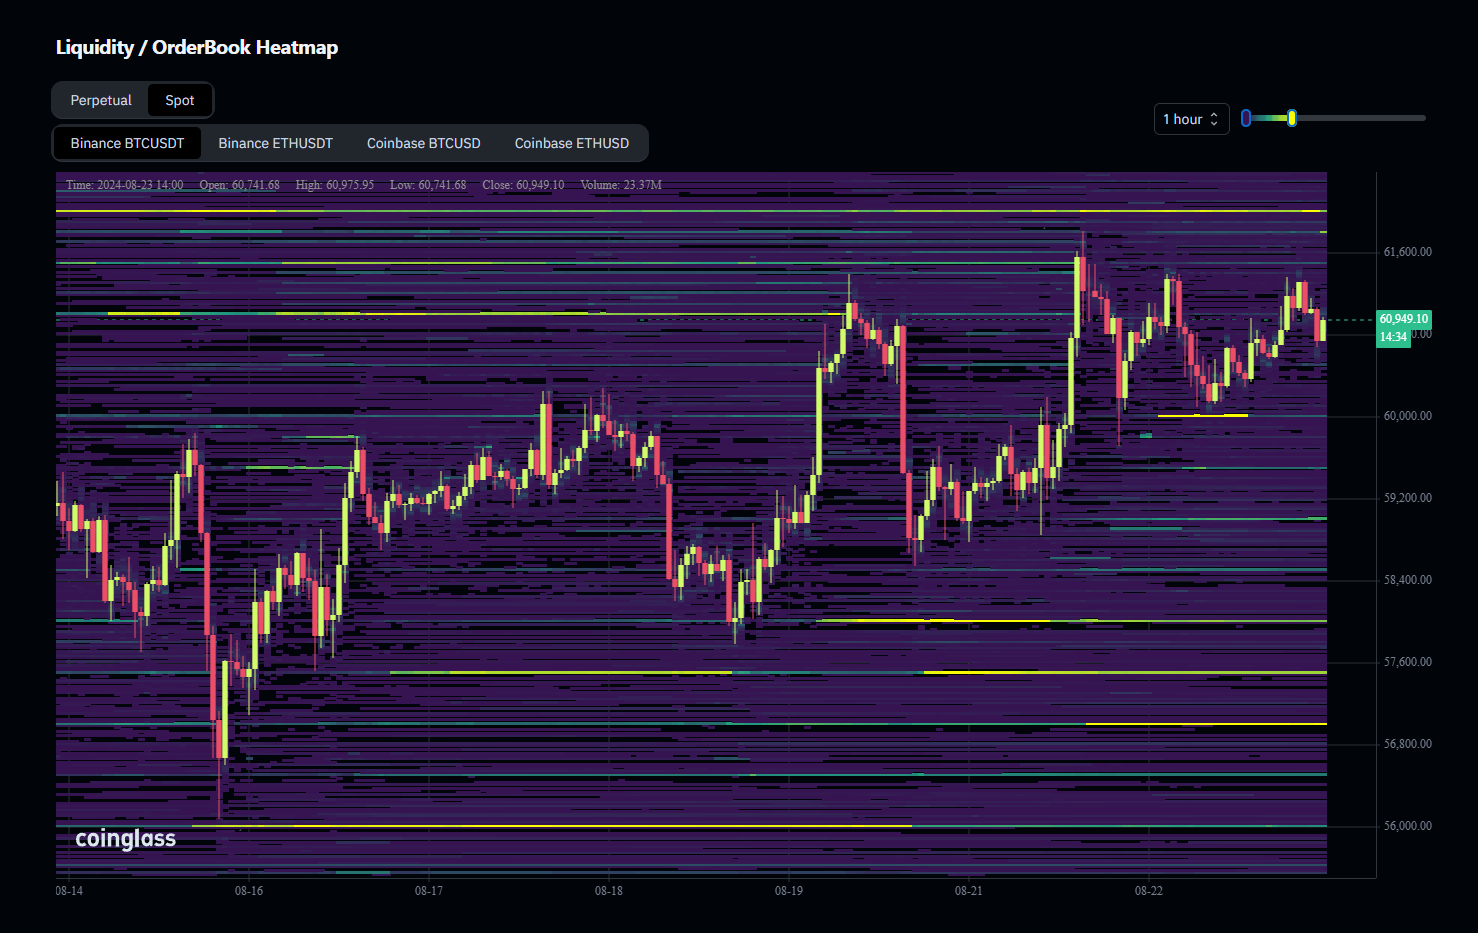
4. Spot Liquidity / OrderBook Heatmap (Binance BTC/USDT)
Today's Data Analysis:
The heatmap shows strong liquidity clusters around $61,000 and $60,000, with heavier sell orders at the upper range.
Conclusion:
The $61,000 level remains a critical resistance point. A break above could lead to a rally, but failure may result in a pullback to $60,000 or lower.
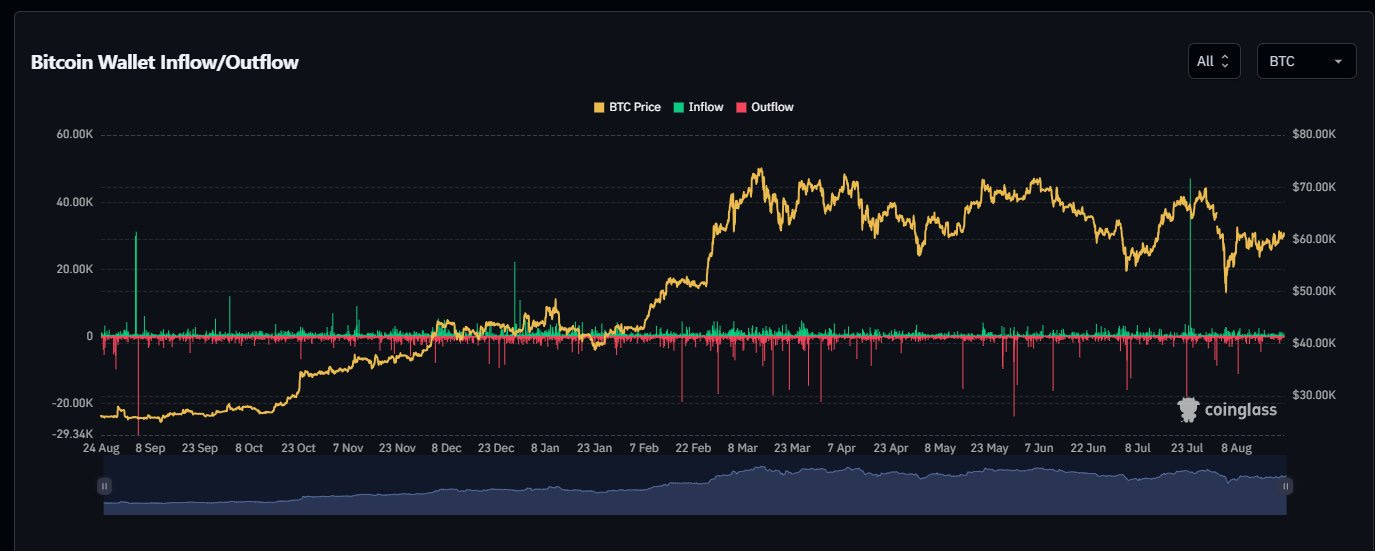
5. BTC Spot Wallet Inflow/Outflow
Today's Data Analysis:
The net flow of BTC shows a slight outflow dominance, indicating that more BTC is leaving exchanges than entering, typically a bullish signal.
Conclusion:
The outflow suggests accumulation and a potential for upward price movement if resistance levels are broken.
Today's Spot Data Summary
BTC is trading near a critical resistance level of $61,000. Market sentiment is mixed, with resistance holding so far, but net outflows suggest underlying bullish sentiment.
Possible Impact on the Market in the Next 24 Hours
A break above $61,000 could lead to a rally towards $62,500, but failure to break this level might result in a retest of $60,000.
Possible Impact on the Market by the End of the Week (25.08.2024)
If $61,000 resistance is broken and held, the market could target $63,000-$64,000. If not, expect consolidation or a potential dip towards $58,000.
Sentiment Evaluation
Rating: 5/10 (Neutral)
The market is currently balanced, with mixed signals from both order book liquidity and technical indicators. Traders are likely to wait for a decisive move.
Market Evaluation Based on Today's Options, Futures, and Spot/TA Data
Overall Market Sentiment
Average Sentiment Rating: 5.5/10 (Neutral)
Traders exhibit cautious optimism, with mixed signals across the board. There is neither strong bullish nor bearish consensus.
24-Hour Price Forecast
Prediction: The market is likely to remain range-bound between $60,000 and $61,500. A breakout above $61,000 could trigger a move towards $62,000, but failure to break this level may result in a pullback to $59,500.
End-of-Week Price Forecast (25.08.2024)
Prediction: If $61,000 is convincingly broken, expect a move towards $63,000-$64,000. However, if resistance holds, the market may test lower support around $58,500.
Key Support and Resistance Levels:
Major Support: $60,000
Major Resistance: $61,000
Factors to Watch:
Volume: A true breakout requires increasing volume on the upside.
Order Book Liquidity: Watch for thinning sell-side liquidity above $61,000.
Funding Rates: Rising positive funding rates may signal bullish sentiment strengthening, while negative rates might indicate bearish sentiment.
My Personal Opinion
The data still points to a neutral sentiment. The fact is, in the short term, traders are divided on whether the price will go up or down. BTC is following the upward channel almost perfectly, but if it breaks down, things could get ugly. On the other hand, if the selling pressure eases, we could quickly reach the $63,000 - $65,000 range again.
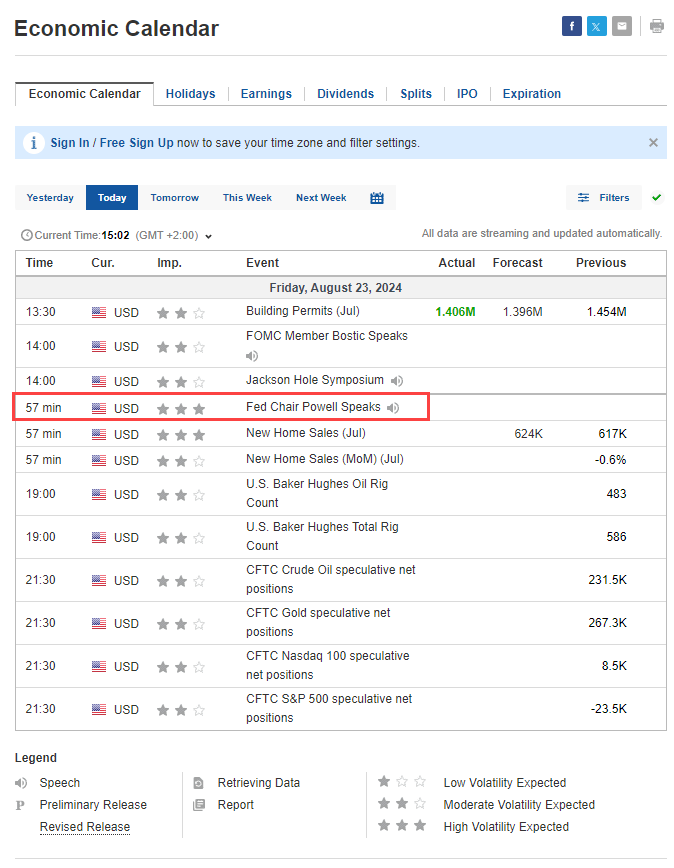
The markets are reacting cautiously to news from the Fed, and Powell is set to hold a press conference in an hour. Will interest rates be lowered before the US elections? If so, markets could respond bullishly, but what if rates are only cut afterward to avoid appearing as election interference? How will markets react then?
Currently, I see no clear trend, and while we can expect some volatility, I don't anticipate a breakout, either downwards or upwards. Let's see what happens shortly.


