#BTC Market Outlook: Consolidation, Key Levels, and Sentiment Analysis
BTC Options Market Analysis (Based on Today's Data)
1. Implied Volatility (IV)
Today's Data Analysis:
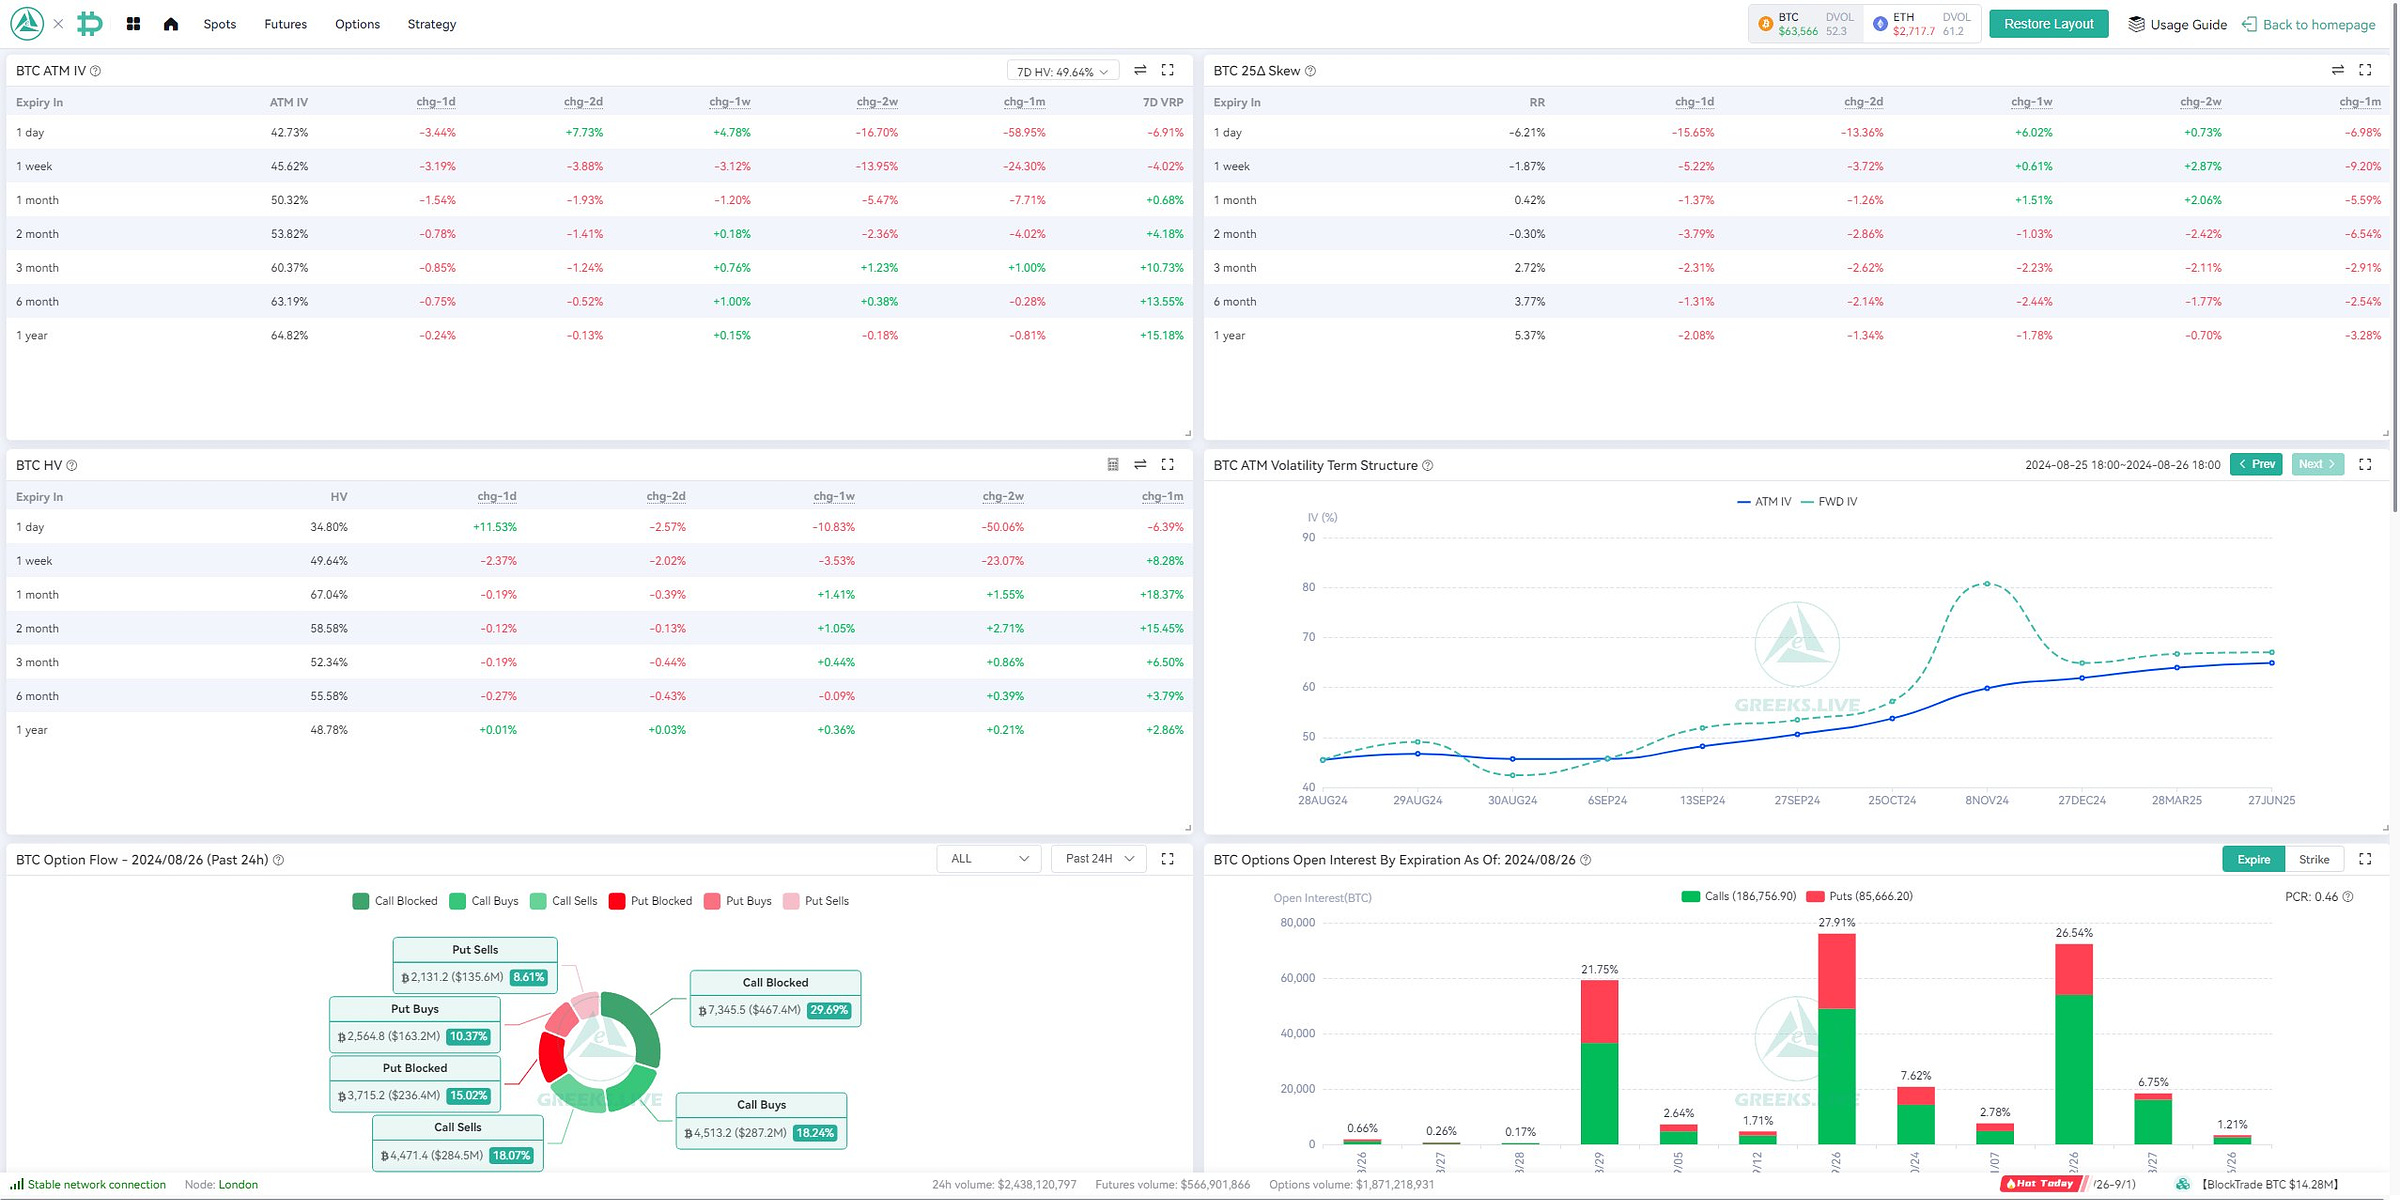
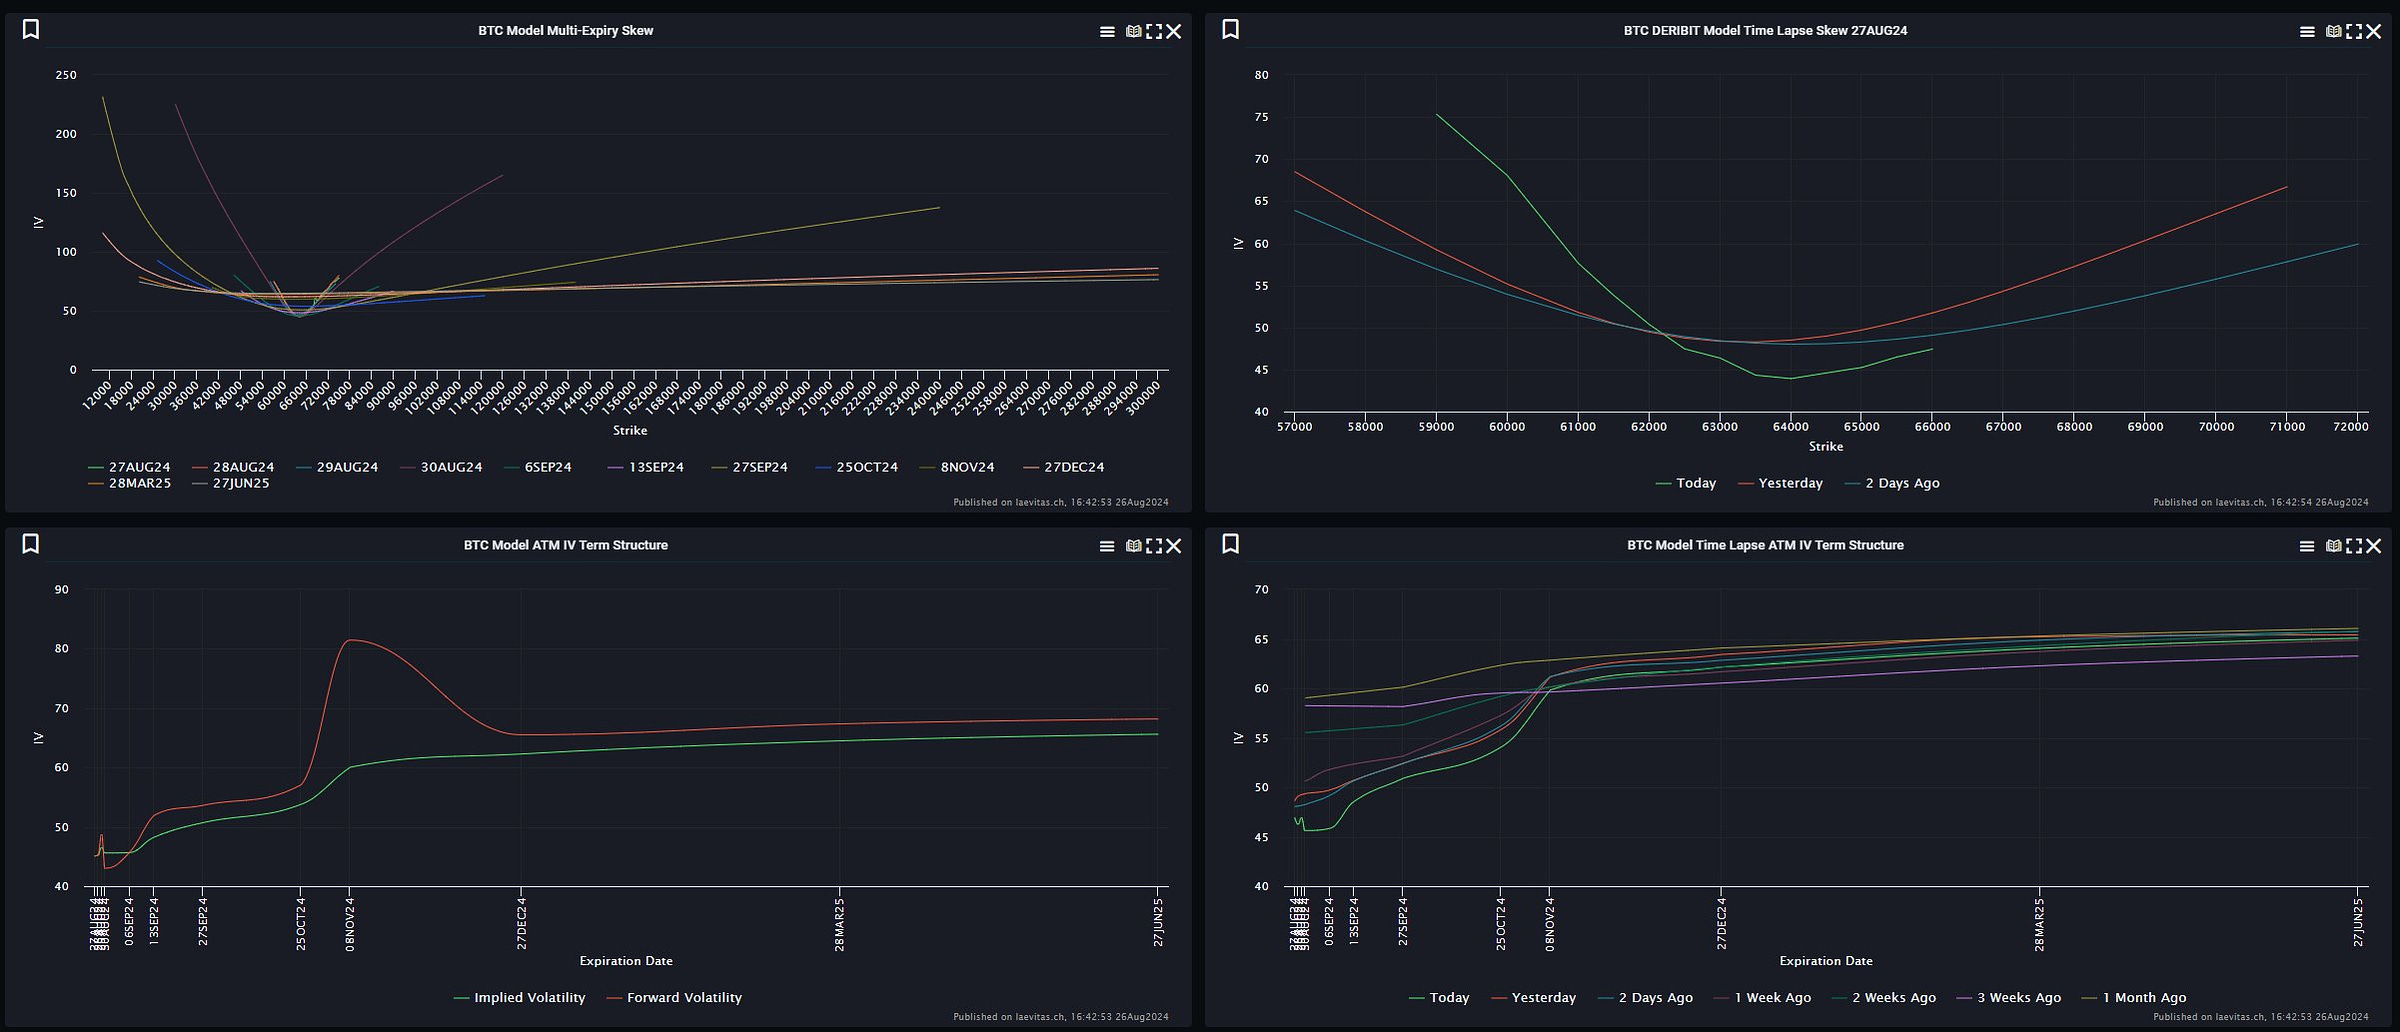
The ATM IV for 1-day options is at 42.73%, showing an increase of +7.73%. This suggests heightened market uncertainty in the short term, with potential for significant price movement. Longer-term IVs (1-month to 1-year) show stability or slight increases, indicating that the market anticipates continued volatility but at a lesser intensity as time progresses.
Conclusion:
The rise in short-term IV indicates market participants are preparing for immediate volatility, likely due to upcoming events or anticipated news.
2. 25 Delta Skew
Today's Data Analysis:
The 25 Delta Skew shows a significant reduction, especially in shorter durations like 1-day (-15.65%) and 1-week (-5.22%). This indicates a shift in market sentiment, with participants showing less demand for downside protection.
Conclusion:
The decrease in skew suggests a more neutral to slightly bullish outlook in the near term, as the demand for puts has decreased.
3. Historical Volatility (HV)
Today's Data Analysis:
HV has seen notable increases in the short term, with 1-day HV rising by +11.53%. However, the longer-term HVs remain relatively stable, indicating that recent price action has injected some volatility into the market but it hasn't yet translated into a long-term trend.
Conclusion:
The spike in short-term HV implies recent market movements have been more erratic, but it's unclear if this will be sustained.
4. Volatility Risk Premium (VRP)
Today's Data Analysis:
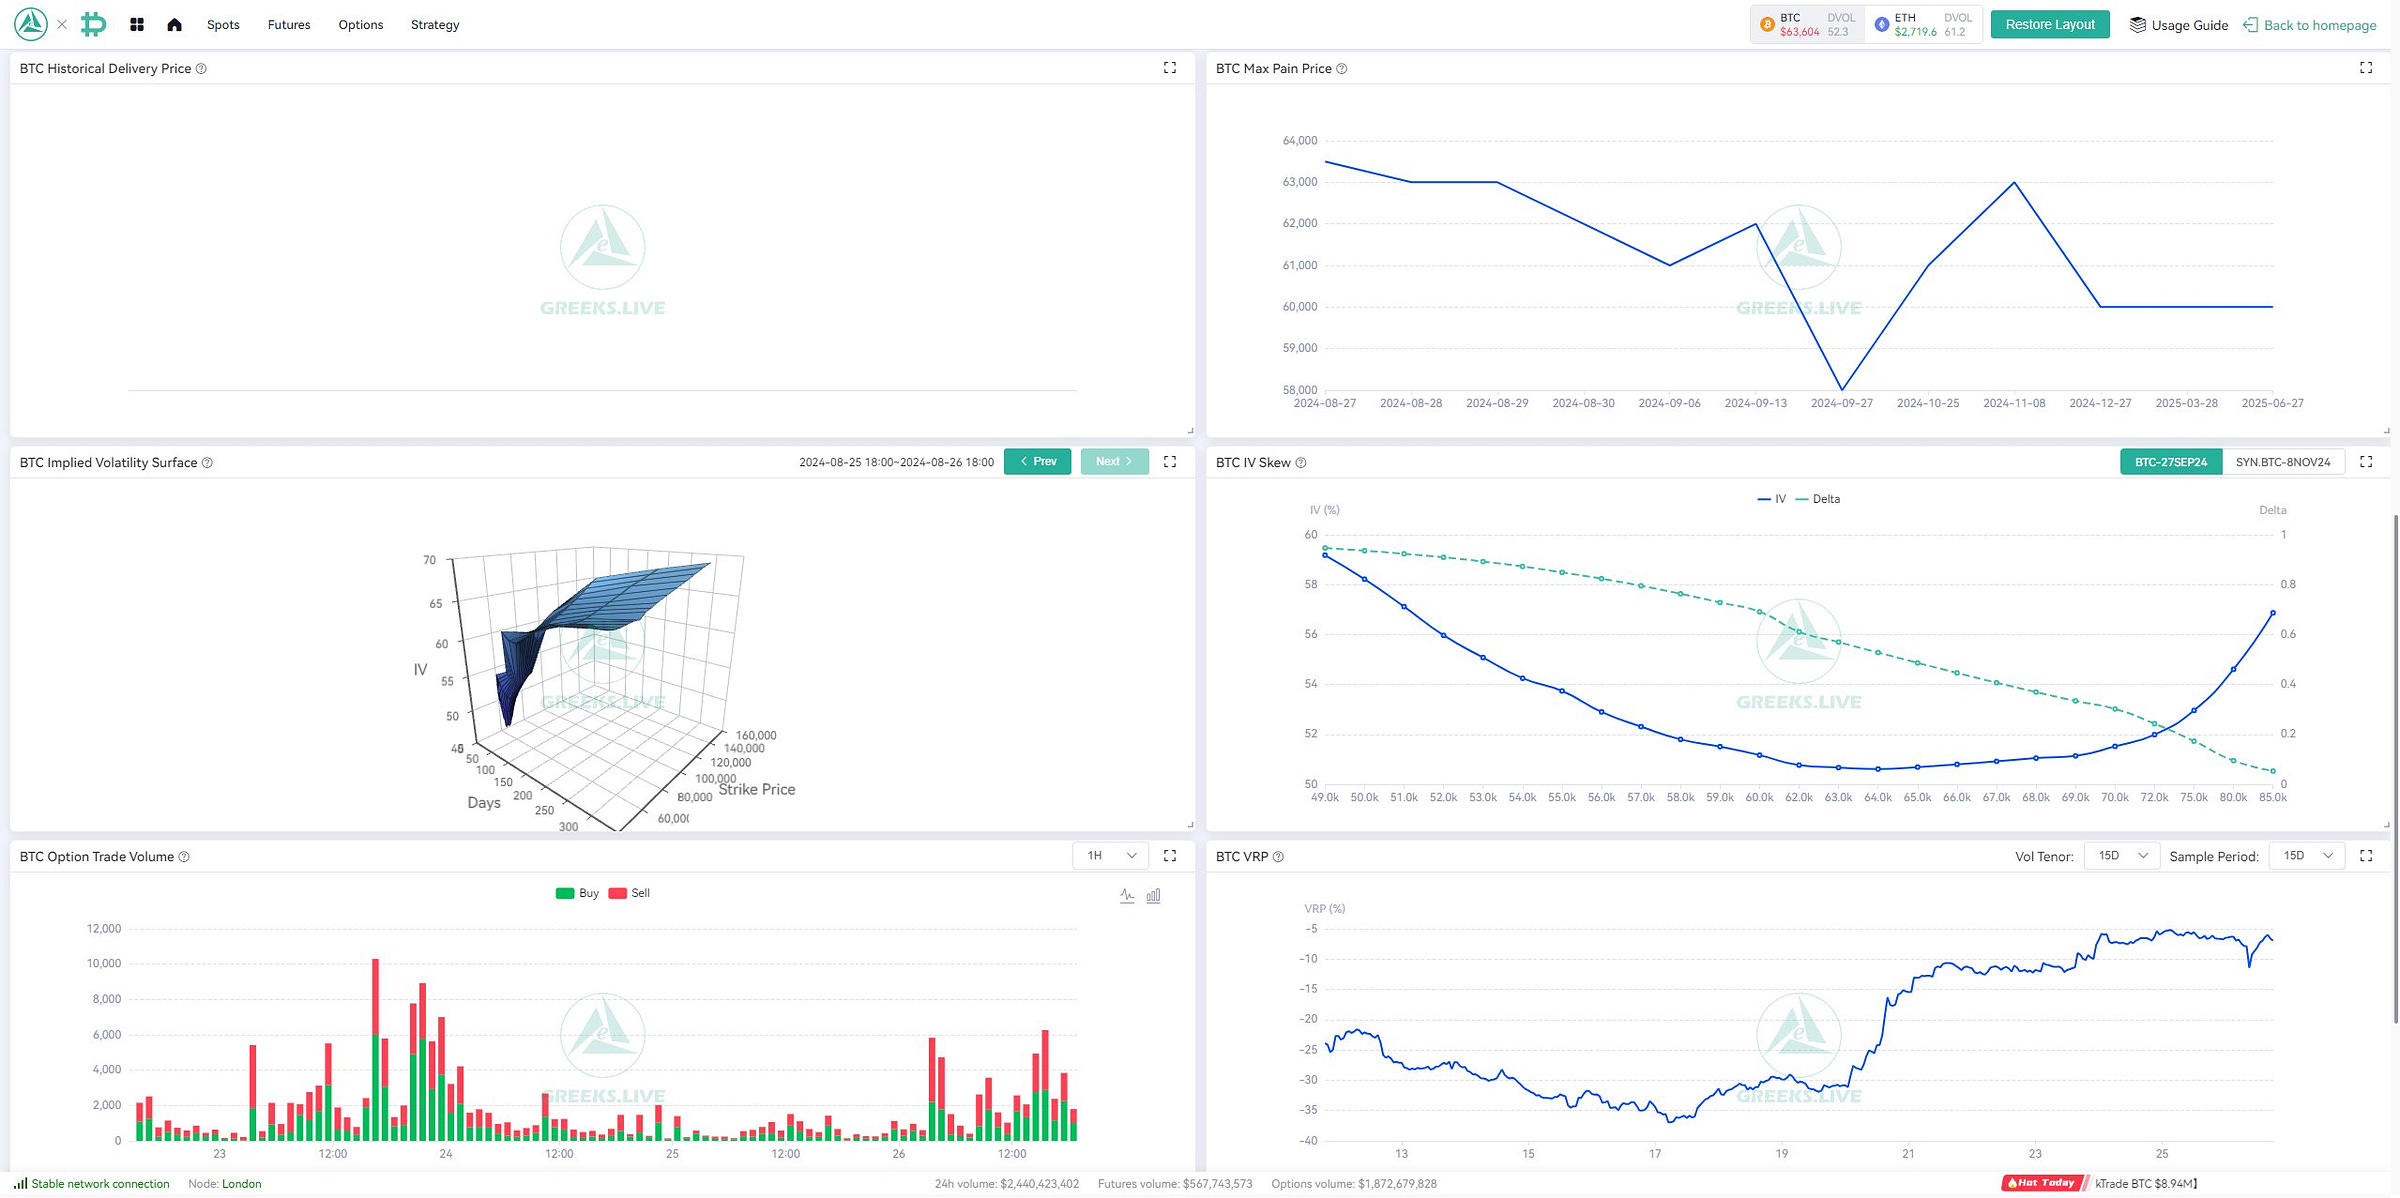
The VRP has decreased across most timeframes, indicating that the premium for holding options is lower compared to realized volatility. This suggests the market may be underpricing the risk of future volatility.
Conclusion:
A lower VRP could signal that traders are expecting a reduction in market volatility or are underestimating future risks.
5. Option Flow
Today's Data Analysis:
Call buying dominates the option flow, with a notable 18.07% in call sells and 29.69% in call buys, indicating a bullish sentiment among traders. The put-to-call ratio stands at 0.5, which further supports this bullish outlook.
Conclusion:
The current option flow is heavily skewed towards call options, suggesting that market participants are positioning for a price increase.
6. Strategy Flows
Today's Data Analysis:
The most popular strategies are the Short Ratio Call Spread and Long Ratio Put Spread. These are generally neutral to bullish strategies, indicating that traders are betting on limited upside with controlled risk.
Conclusion:
Strategy flows suggest a cautious bullish sentiment, where traders are expecting upside but are also hedging against potential risks.
7. Greeks
Today's Data Analysis:
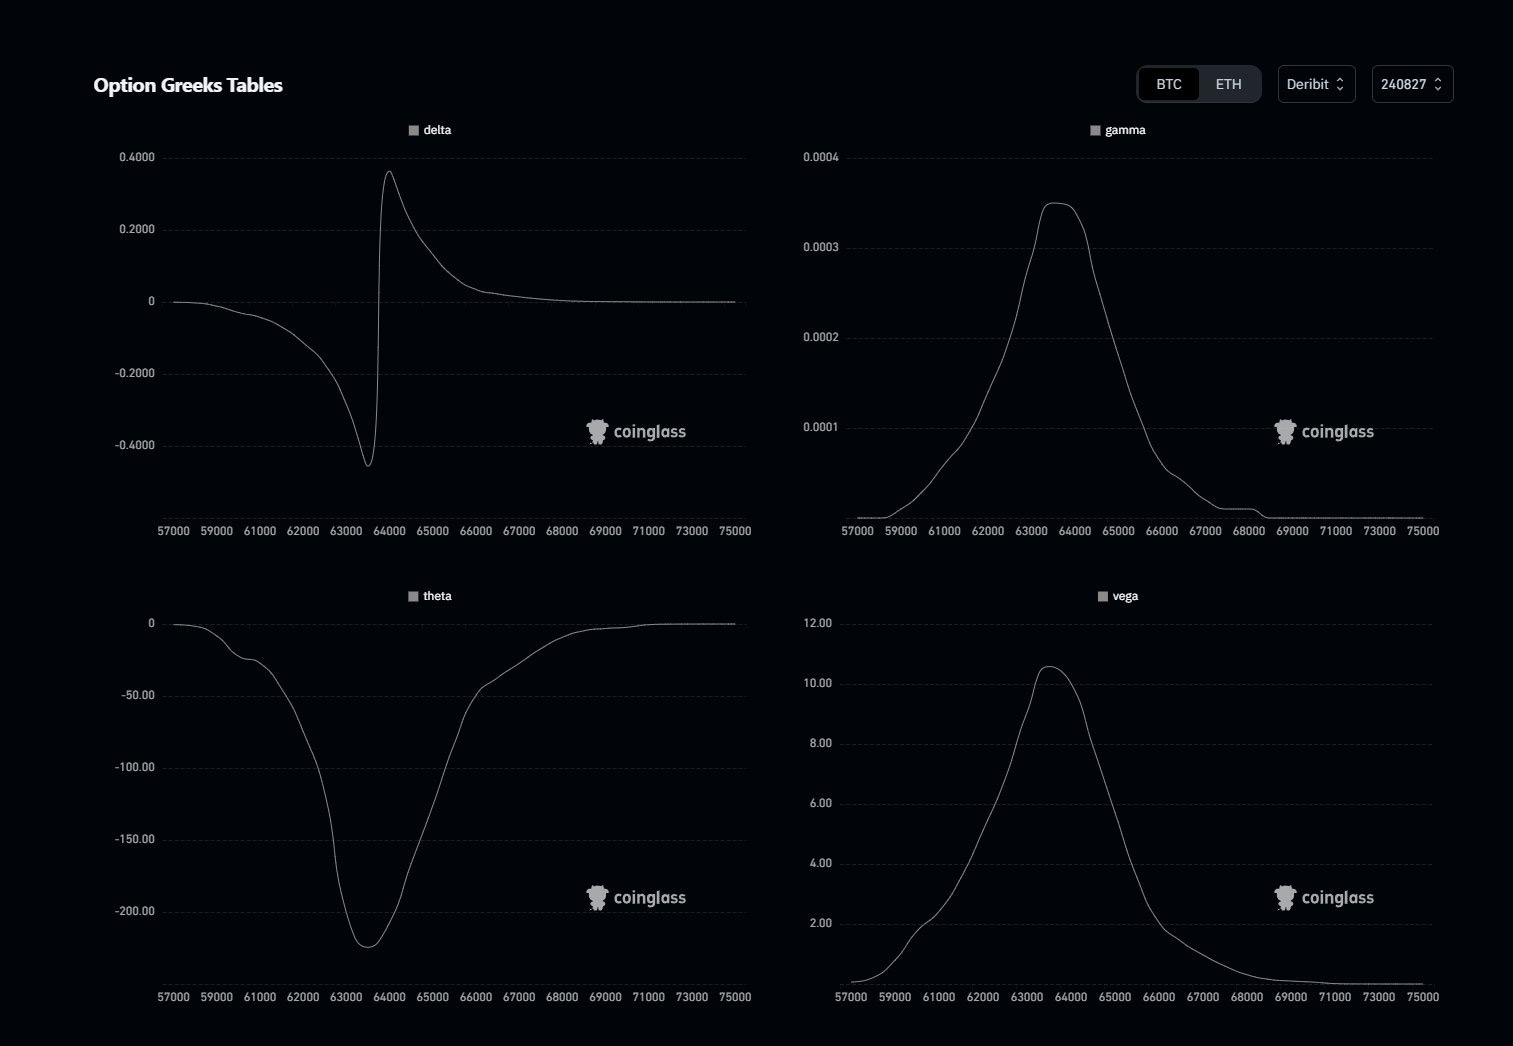
The Greeks indicate that delta is concentrated around the $64,000 strike, showing that this level is critical for current option holders. Gamma is elevated, indicating that price moves around this strike could become more volatile.
Conclusion:
The concentration of delta and elevated gamma at key strike levels suggests that small price movements could lead to larger swings due to hedging activities.
Today's Options Data Summary
IV: Increased, especially in the short term, indicating anticipated volatility.
25 Delta Skew: Decreasing, suggesting a neutral to bullish outlook.
HV: Short-term volatility is rising, but long-term remains stable.
VRP: Lower, indicating potential underpricing of future risks.
Option Flow: Bullish sentiment dominates.
Strategy Flows: Cautiously bullish, with traders positioning for controlled upside.
Greeks: Key levels around $64,000 could trigger volatility.
Possible Impact on the Market in the Next 24 Hours
The market could see increased volatility with the potential for sharp movements as it approaches key levels like $64,000. The combination of high IV and concentrated deltas suggests that any move could be exaggerated due to hedging activities.
Possible Impact on the Market by the End of the Week (01.09.2024)
By the end of the week, the market may either stabilize around the Max Pain level of $61,000 or break through to test higher levels, given the current bullish sentiment in the options flow. The key will be whether the short-term volatility sustains or calms down.
Sentiment Evaluation
Rating: 6/10
The sentiment leans bullish, but there is caution due to the recent increase in volatility and the significant resistance around $64,000.
BTC Futures Market Analysis (Based on Today's Data)
1. Price Movement and Volume
Today's Data Analysis:
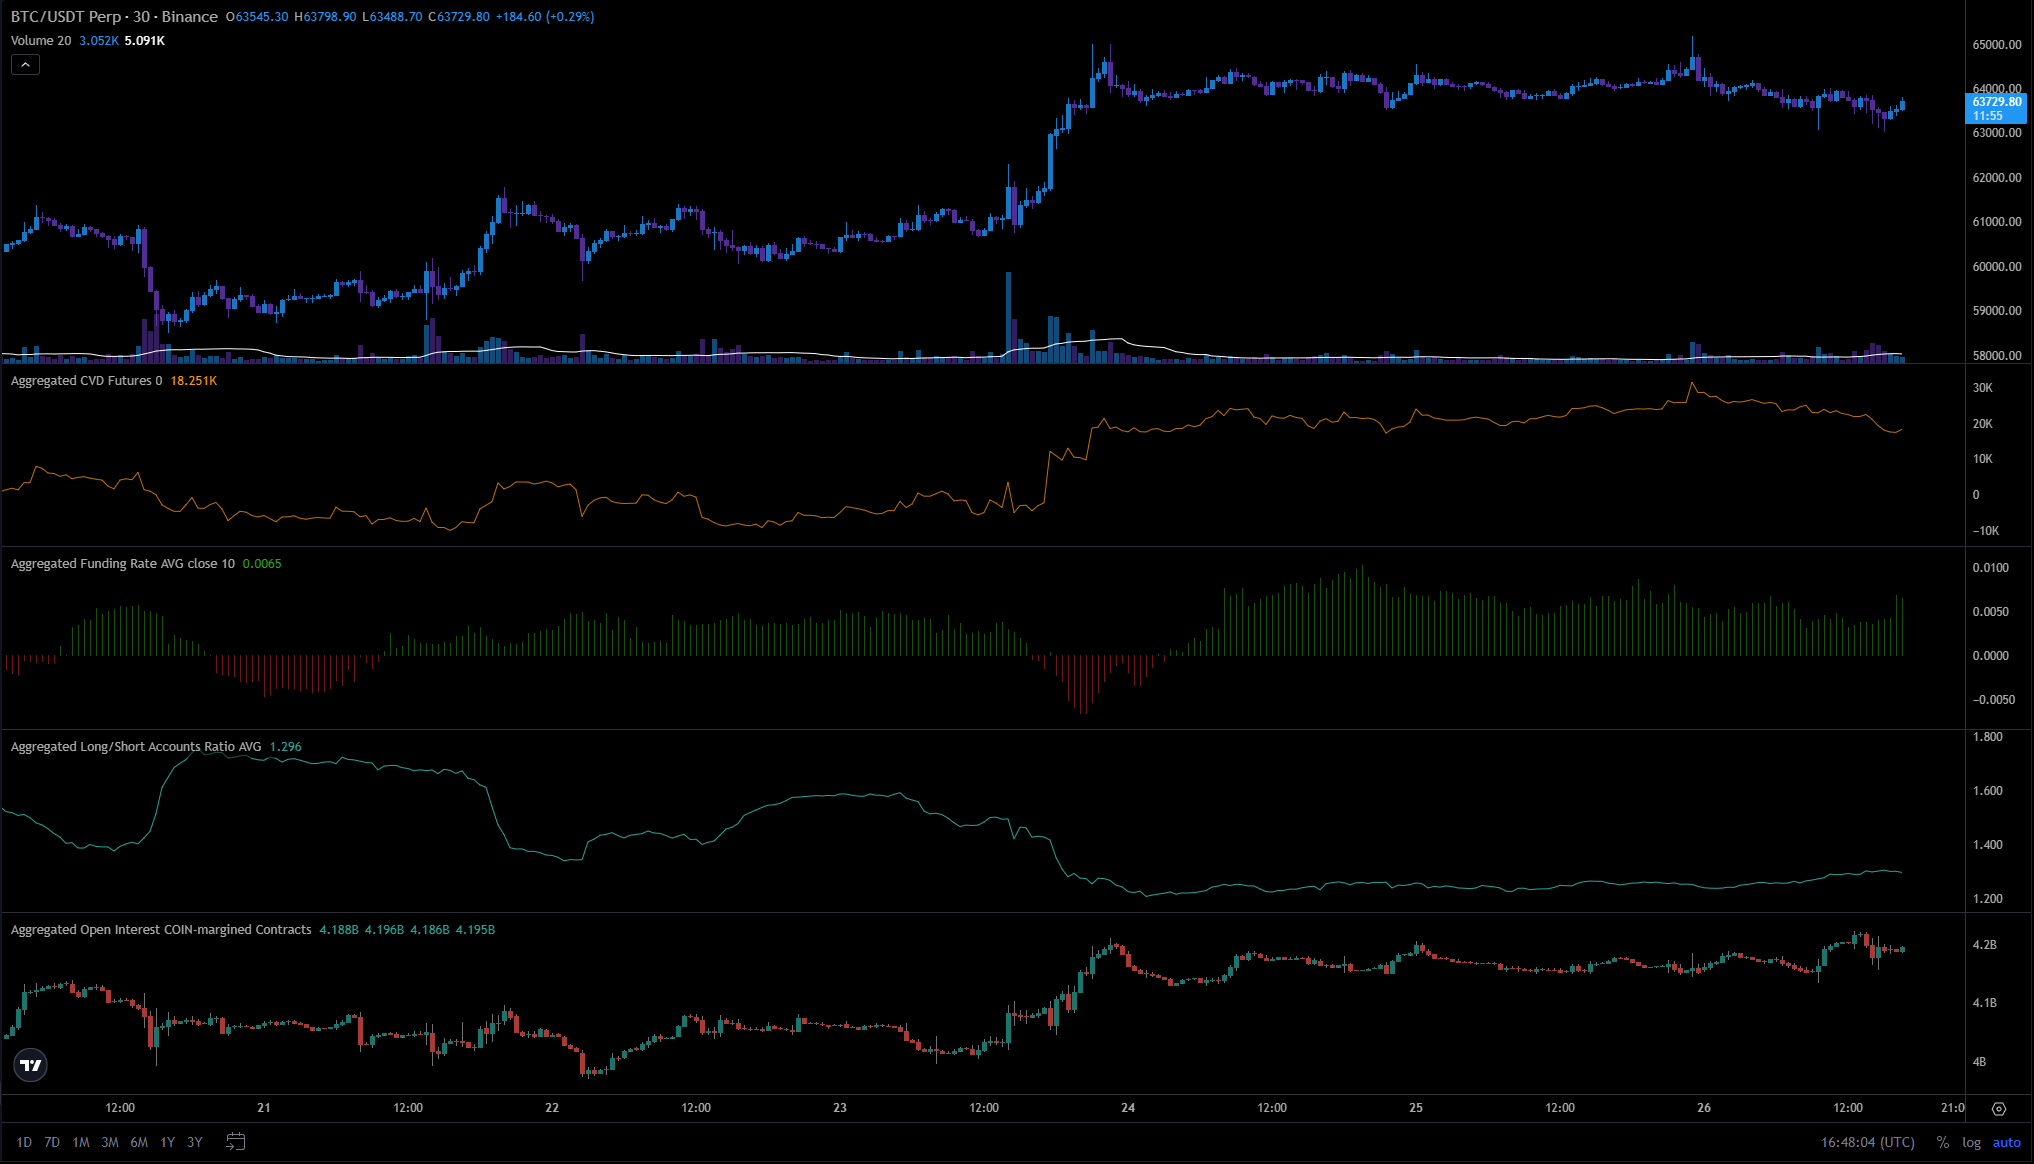
BTC has traded within a narrow range with a slight pullback observed after reaching $64,000. Volume has been relatively low, indicating reduced trading activity compared to previous days.
Conclusion:
The market appears to be in a consolidation phase, with participants possibly awaiting further signals before committing to new positions.
2. Funding Rate
Today's Data Analysis:
Funding rates across major exchanges remain positive, with values ranging from +0.0038% to +0.0122%. This suggests that longs are paying shorts, indicating a bullish bias in the market.
Conclusion:
The positive funding rates support the idea that traders are still optimistic about BTC's upward movement, though the high rates could lead to funding cost pressure if prices don't rise soon.
3. Cumulative Volume Delta (CVD) and Open Interest
Today's Data Analysis:
CVD data shows that sellers have been slightly more aggressive recently, leading to a minor decrease in price. Open Interest remains high, particularly on Binance and CME, indicating strong market participation.
Conclusion:
The slight increase in selling pressure could lead to short-term price weakness, but the overall high Open Interest suggests that the market remains engaged and could see strong moves in either direction.
4. Long/Short Ratio
Today's Data Analysis:
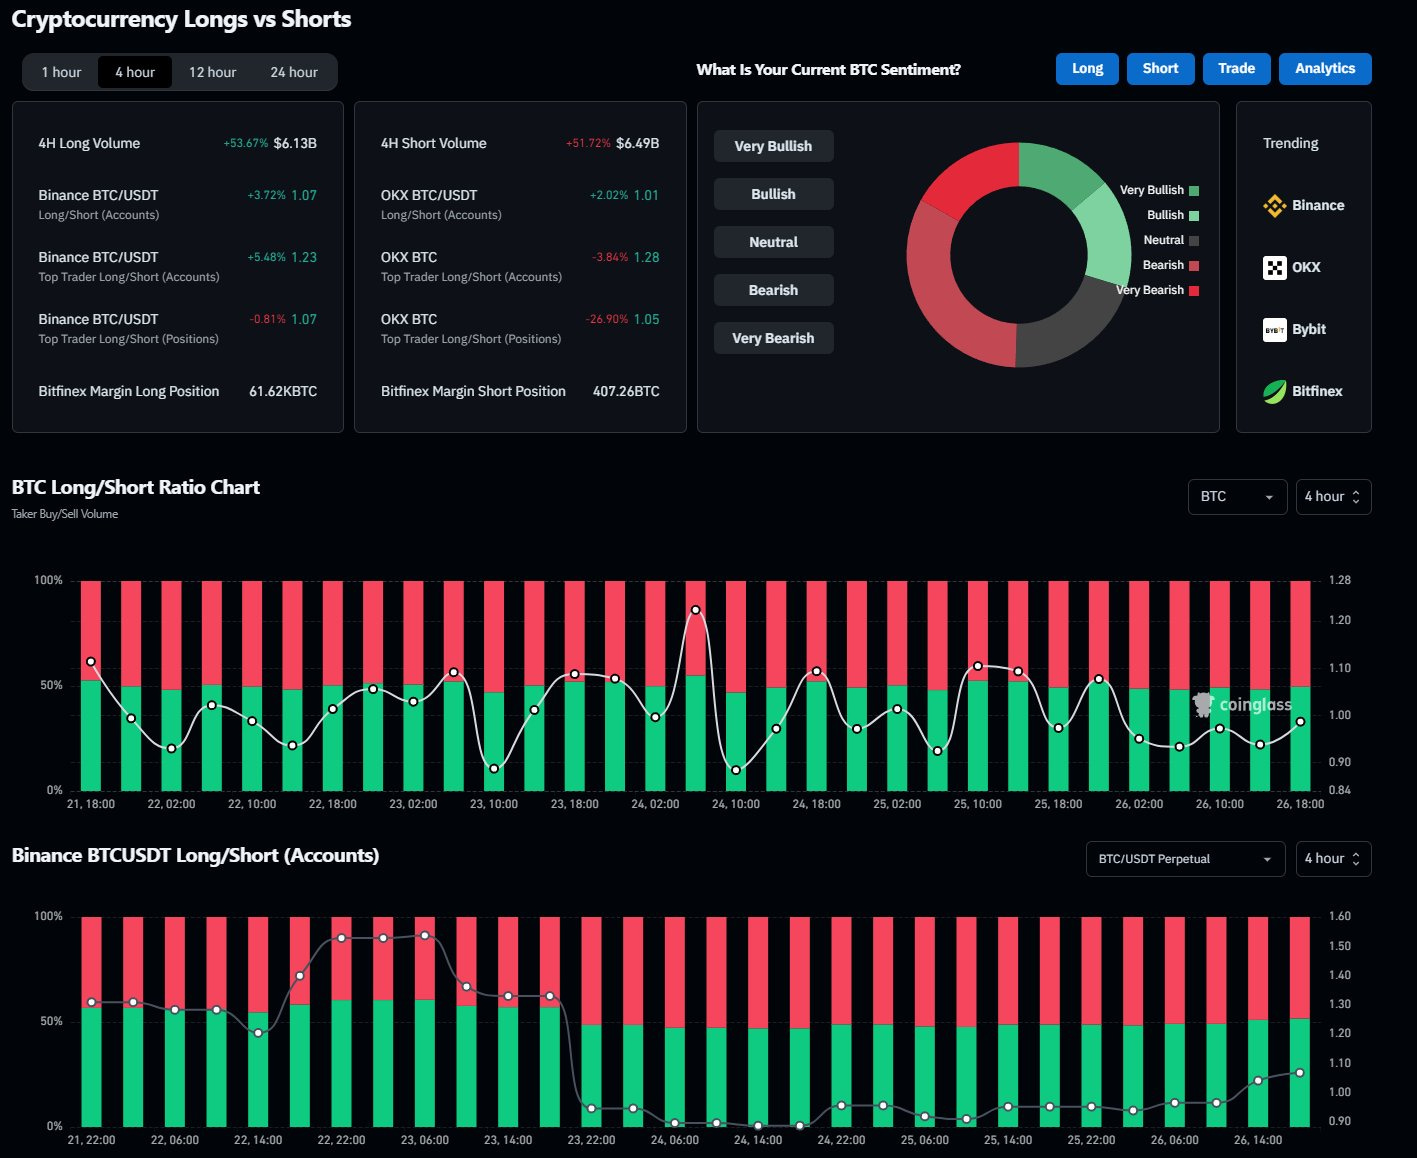
The Long/Short Ratio indicates a mixed sentiment, with a slight preference towards longs in the 4-hour timeframe. Binance data shows a ratio above 1, while other platforms like OKX are more balanced.
Conclusion:
The mixed Long/Short ratio suggests that while there is a slight bullish bias, the market is not overwhelmingly confident in the direction, indicating potential for volatility.
5. Binance BTC/USDT Liquidation Heatmap
Today's Data Analysis:
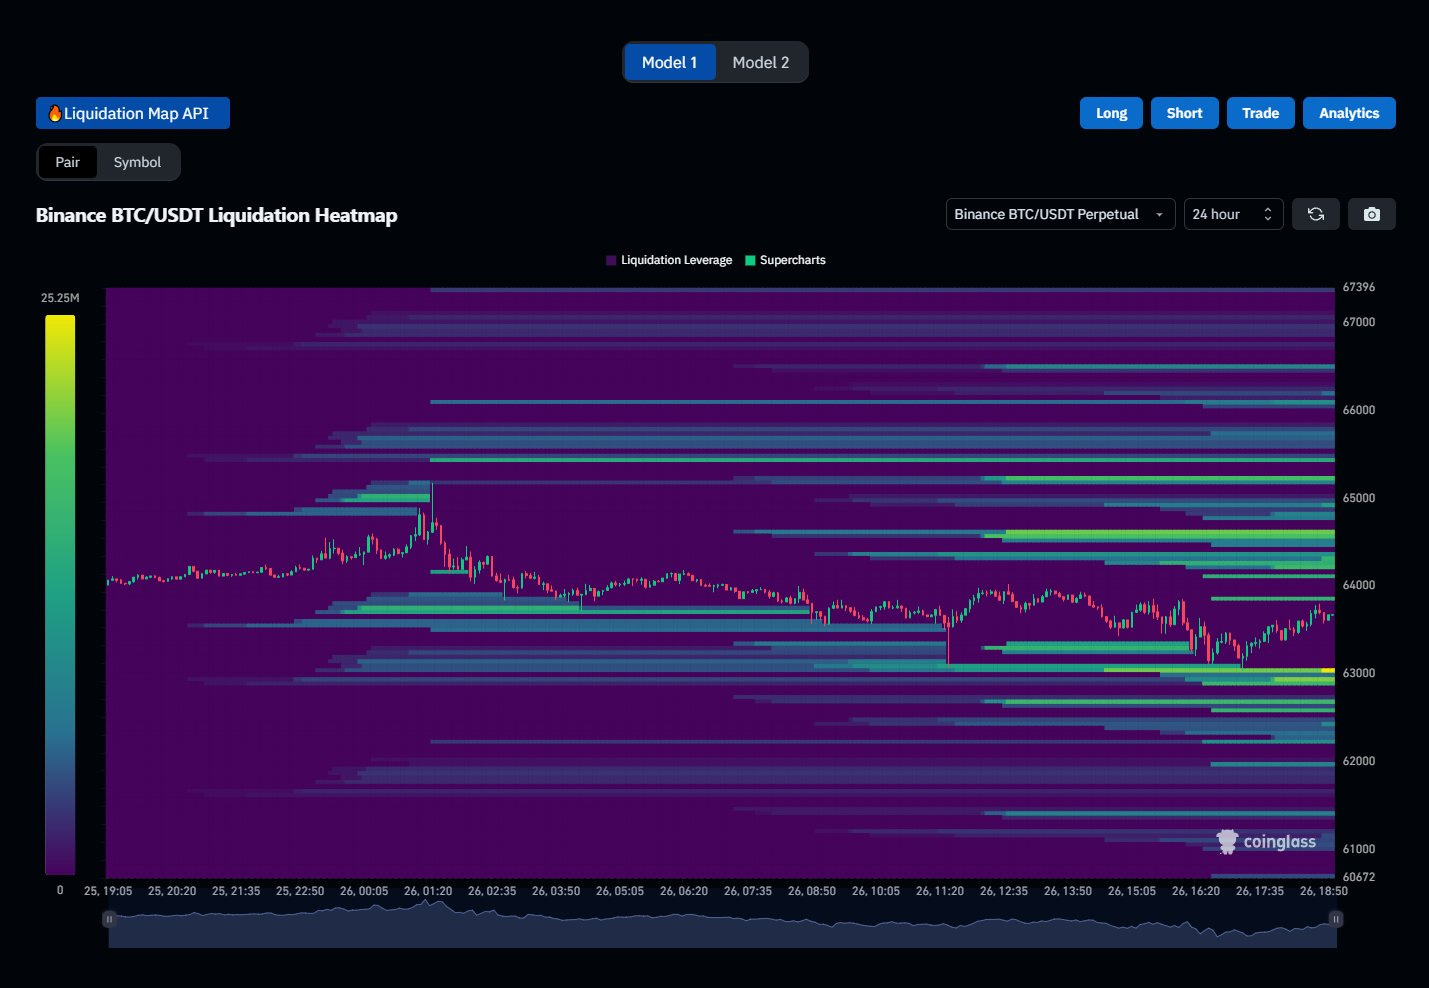
The liquidation heatmap shows concentrated liquidation levels between $63,000 and $64,000. There's also a high level of leverage present in the market, making it susceptible to rapid moves.
Conclusion:
With significant liquidation levels around current prices, any sudden price movements could trigger a cascade of liquidations, leading to sharp volatility.
6. Futures Orderbook Liquidity Delta
Aggregated Orderbook Liquidity Delta Chart (±1%):
Today's Data Analysis:
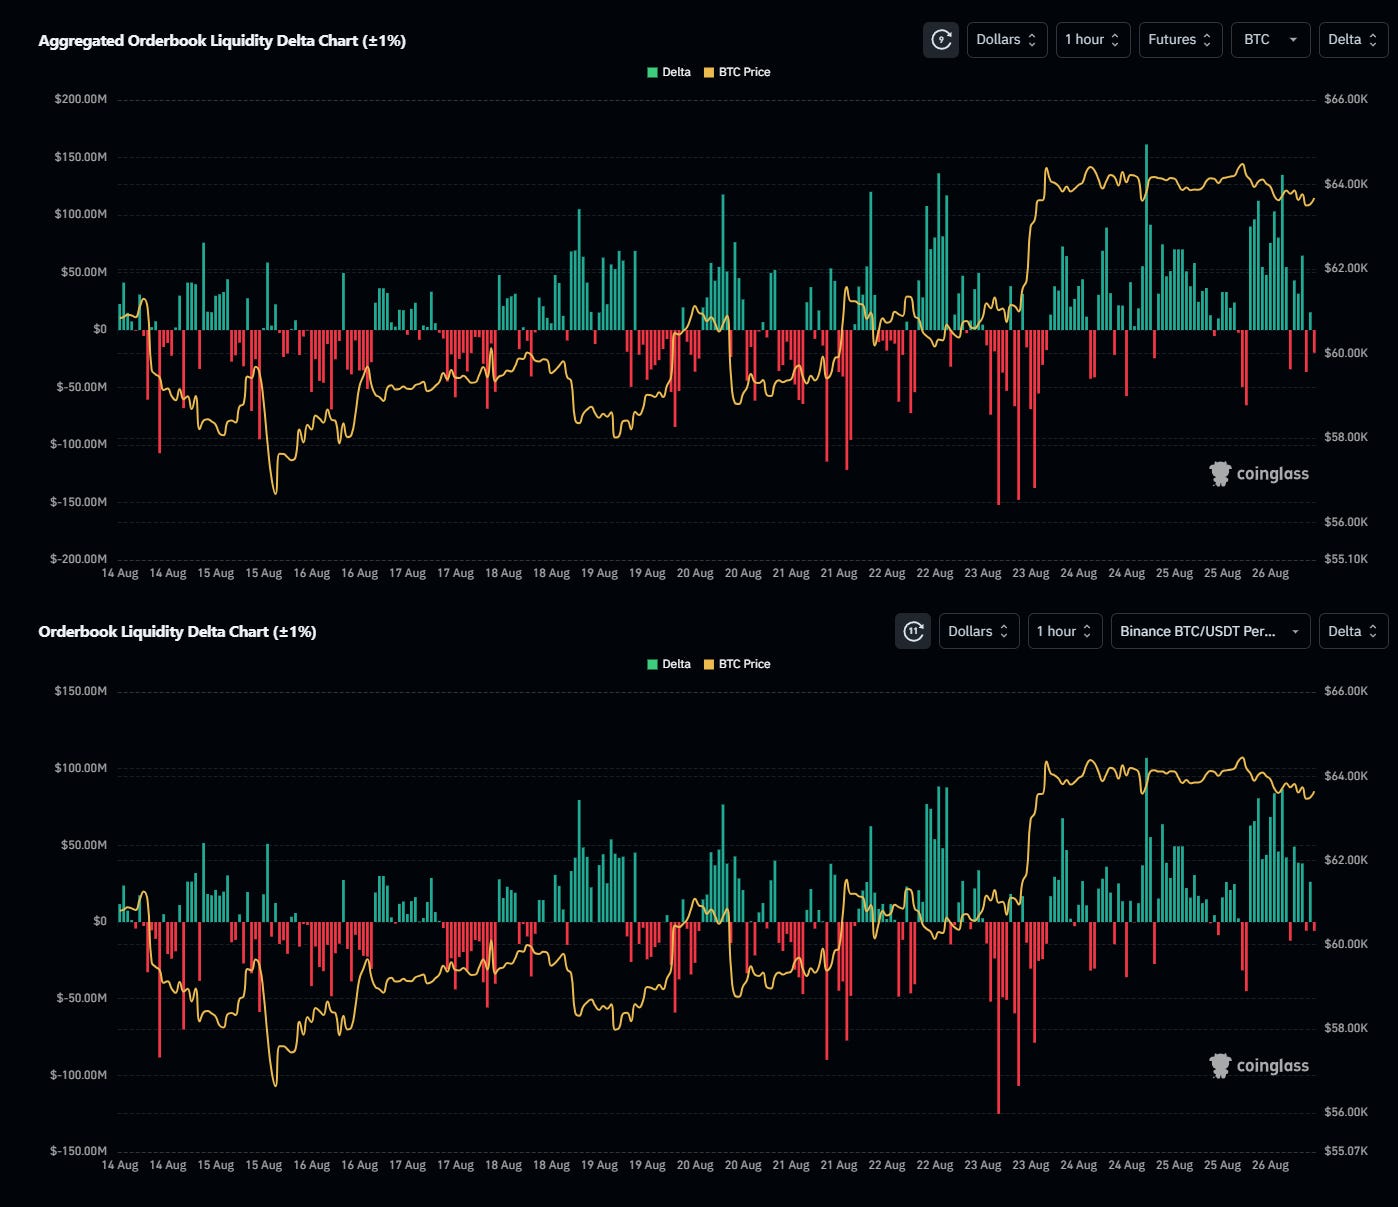
The chart shows a recent uptick in sell-side liquidity, especially during periods of price decline. This suggests that sellers are stepping in at key resistance levels.
Conclusion:
Increased sell-side liquidity could create resistance for BTC's upward movement, potentially leading to a range-bound market in the short term.
Orderbook Liquidity Delta Chart (±1%) (Binance BTC/USDT Perpetual)
Today's Data Analysis:
The Binance-specific data also reflects similar trends, with more sell-side liquidity appearing during recent price declines. However, buy-side liquidity is present, though weaker.
Conclusion:
The Binance order book indicates a cautious market with sellers placing orders at higher levels, which could cap any short-term price gains.
Today's Futures Data Summary
Price Movement: Consolidation with low volume.
Funding Rate: Positive, indicating a bullish sentiment.
CVD and Open Interest: Sellers gaining slight control; high Open Interest suggests potential for significant moves.
Long/Short Ratio: Slight bullish bias, but overall mixed sentiment.
Liquidation Heatmap: High leverage around current prices could lead to volatility.
Orderbook Liquidity: Increased sell-side pressure might prevent immediate price gains.
Possible Impact on the Market in the Next 24 Hours
Expect continued consolidation with potential for sharp moves if key liquidation levels are breached, particularly around $63,000 to $64,000. Funding rates suggest potential upward pressure, but this could be limited by sell-side liquidity.
Possible Impact on the Market by the End of the Week (01.09.2024)
If the consolidation continues, the market could either stabilize around the current levels or experience a breakout, depending on the resolution of the current liquidity and Open Interest dynamics.
Sentiment Evaluation
Rating: 5/10
The sentiment is neutral to slightly bullish. While there is some optimism in the market (as indicated by positive funding rates), the mixed signals from the Long/Short Ratio and increased sell-side liquidity suggest caution.
BTC Spot Market Analysis (Based on Today's Data)
1. Price Movement and Volume
Today's Data Analysis:
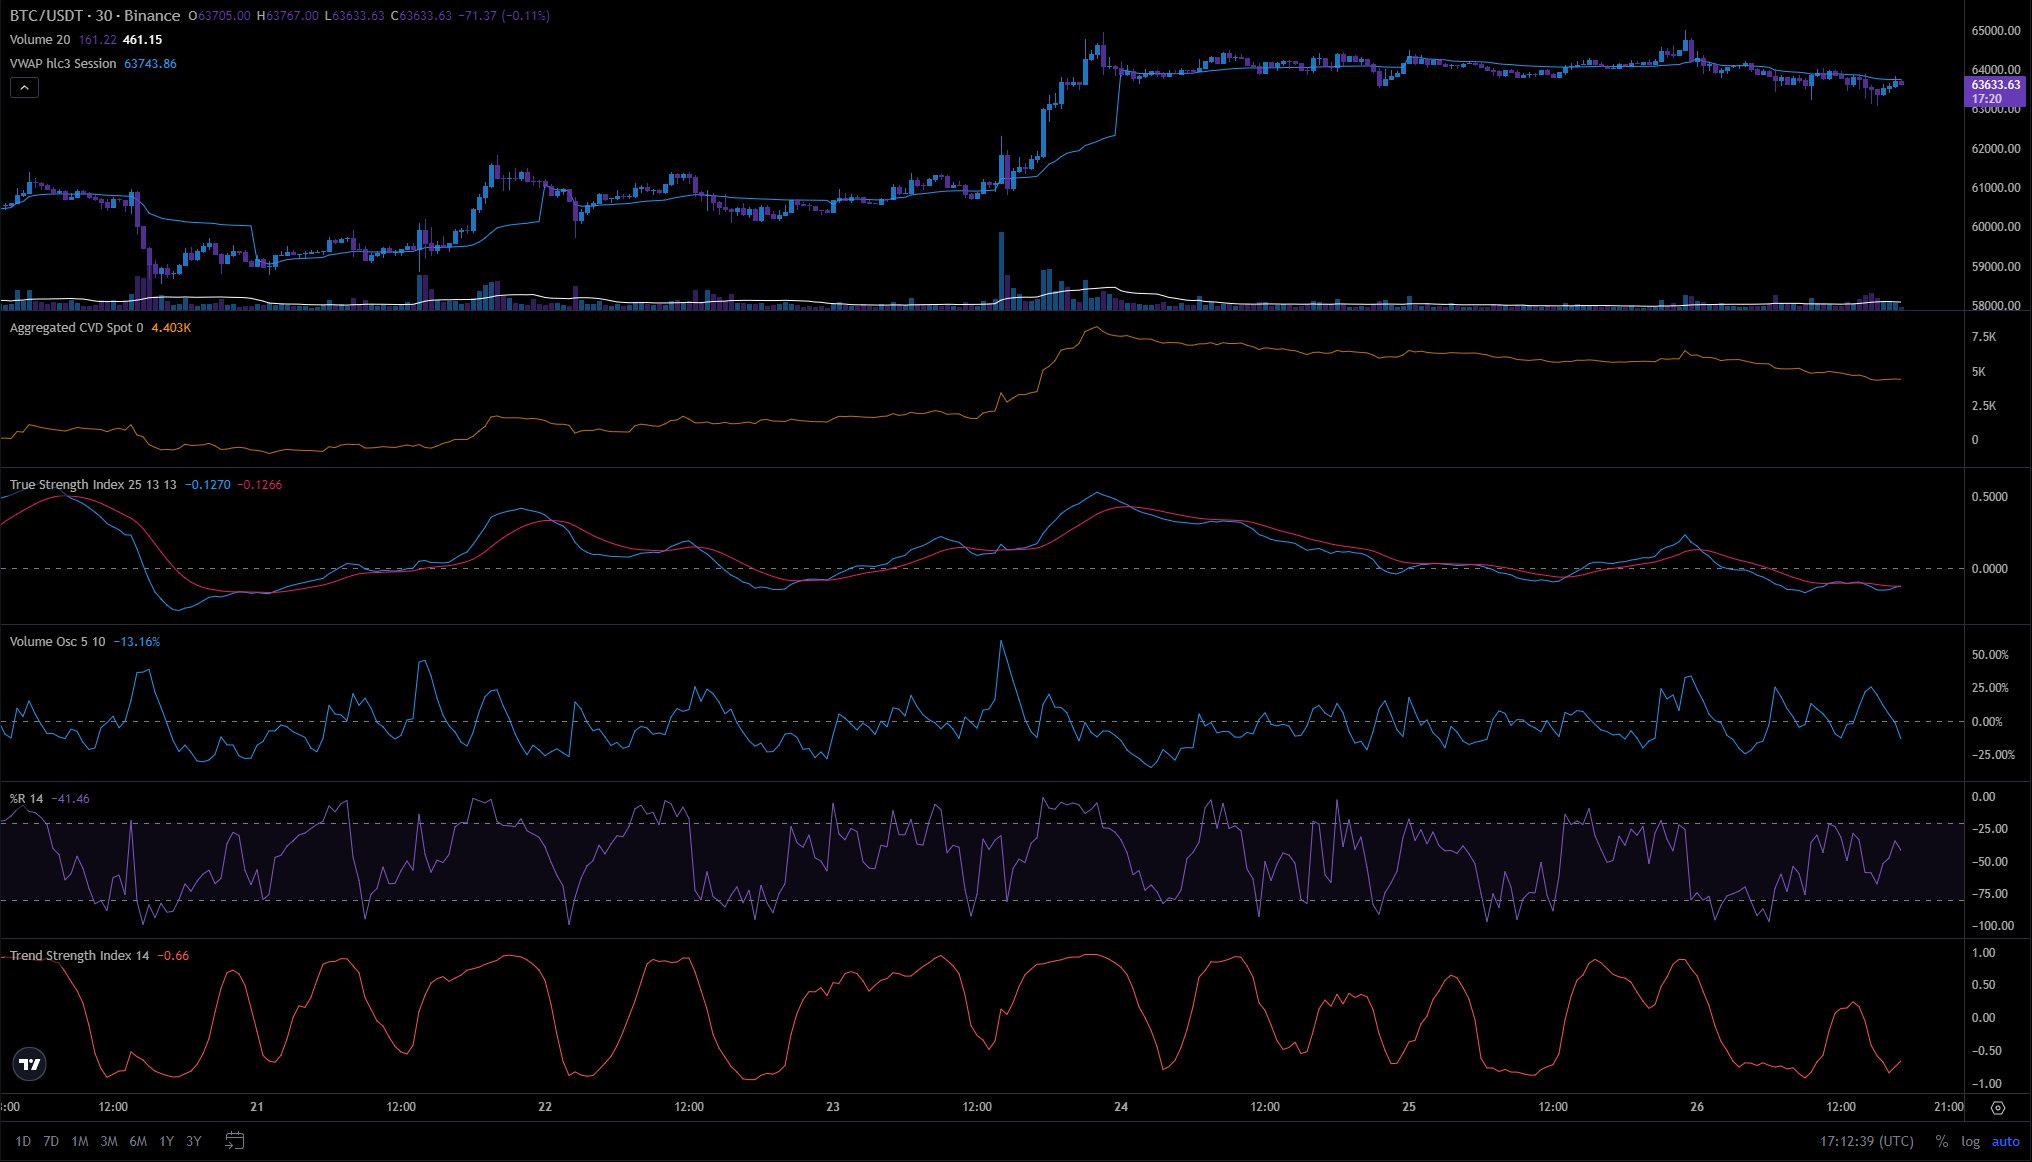
The BTC/USDT pair has been trading within a tight range, with minor fluctuations around the $63,700 level. Volume has been low, indicating decreased market participation or a pause in major trading activity.
Conclusion:
The market appears to be consolidating with low volatility. This could be a sign of an upcoming breakout, depending on the next significant volume spike.
2. Spot Orderbook Liquidity Delta
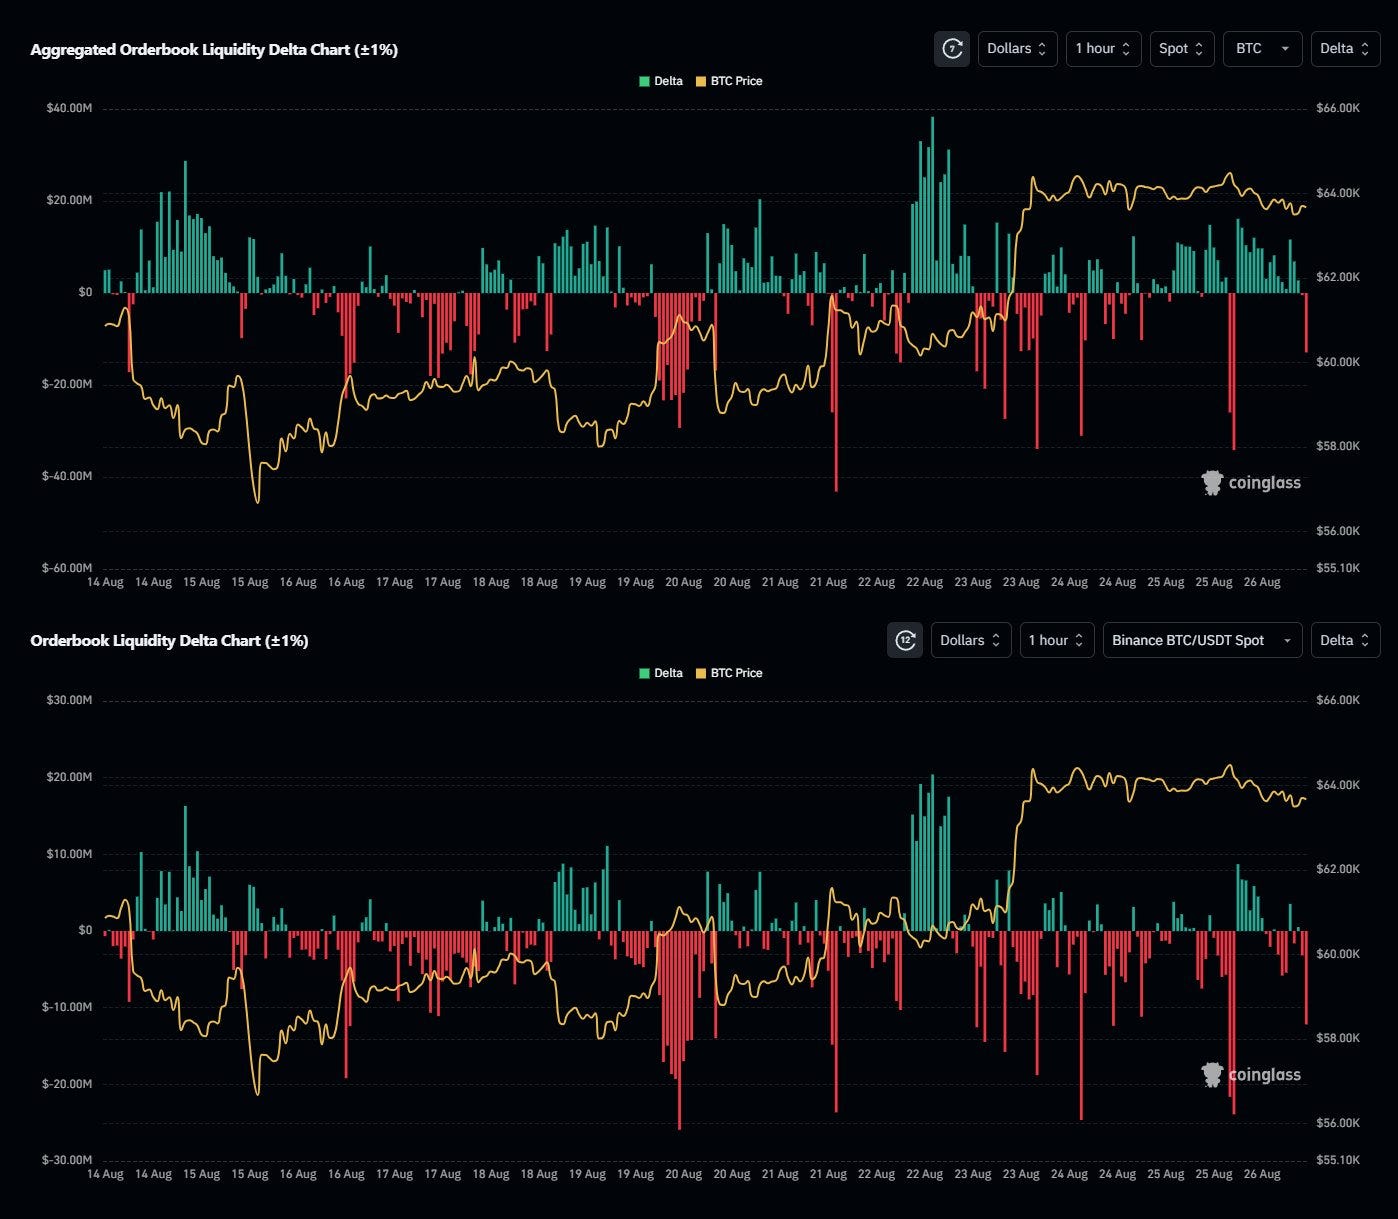
Aggregated Orderbook Liquidity Delta Chart (±1%)
Today's Data Analysis:
The aggregated liquidity shows a balance between buy and sell orders with a slight increase in sell-side liquidity at higher price levels.
Conclusion:
The presence of sell-side liquidity above the current price suggests that there may be resistance to upward price movements in the near term.
Orderbook Liquidity Delta Chart (±1%) (Binance BTC/USDT)
Today's Data Analysis:
Similar to the aggregated data, Binance's order book shows stronger sell-side liquidity, particularly as prices approach $64,000.
Conclusion:
The order book dynamics on Binance indicate potential selling pressure as BTC approaches resistance levels, which could limit any short-term gains.
3. Technical Analysis
Today's Data Analysis:
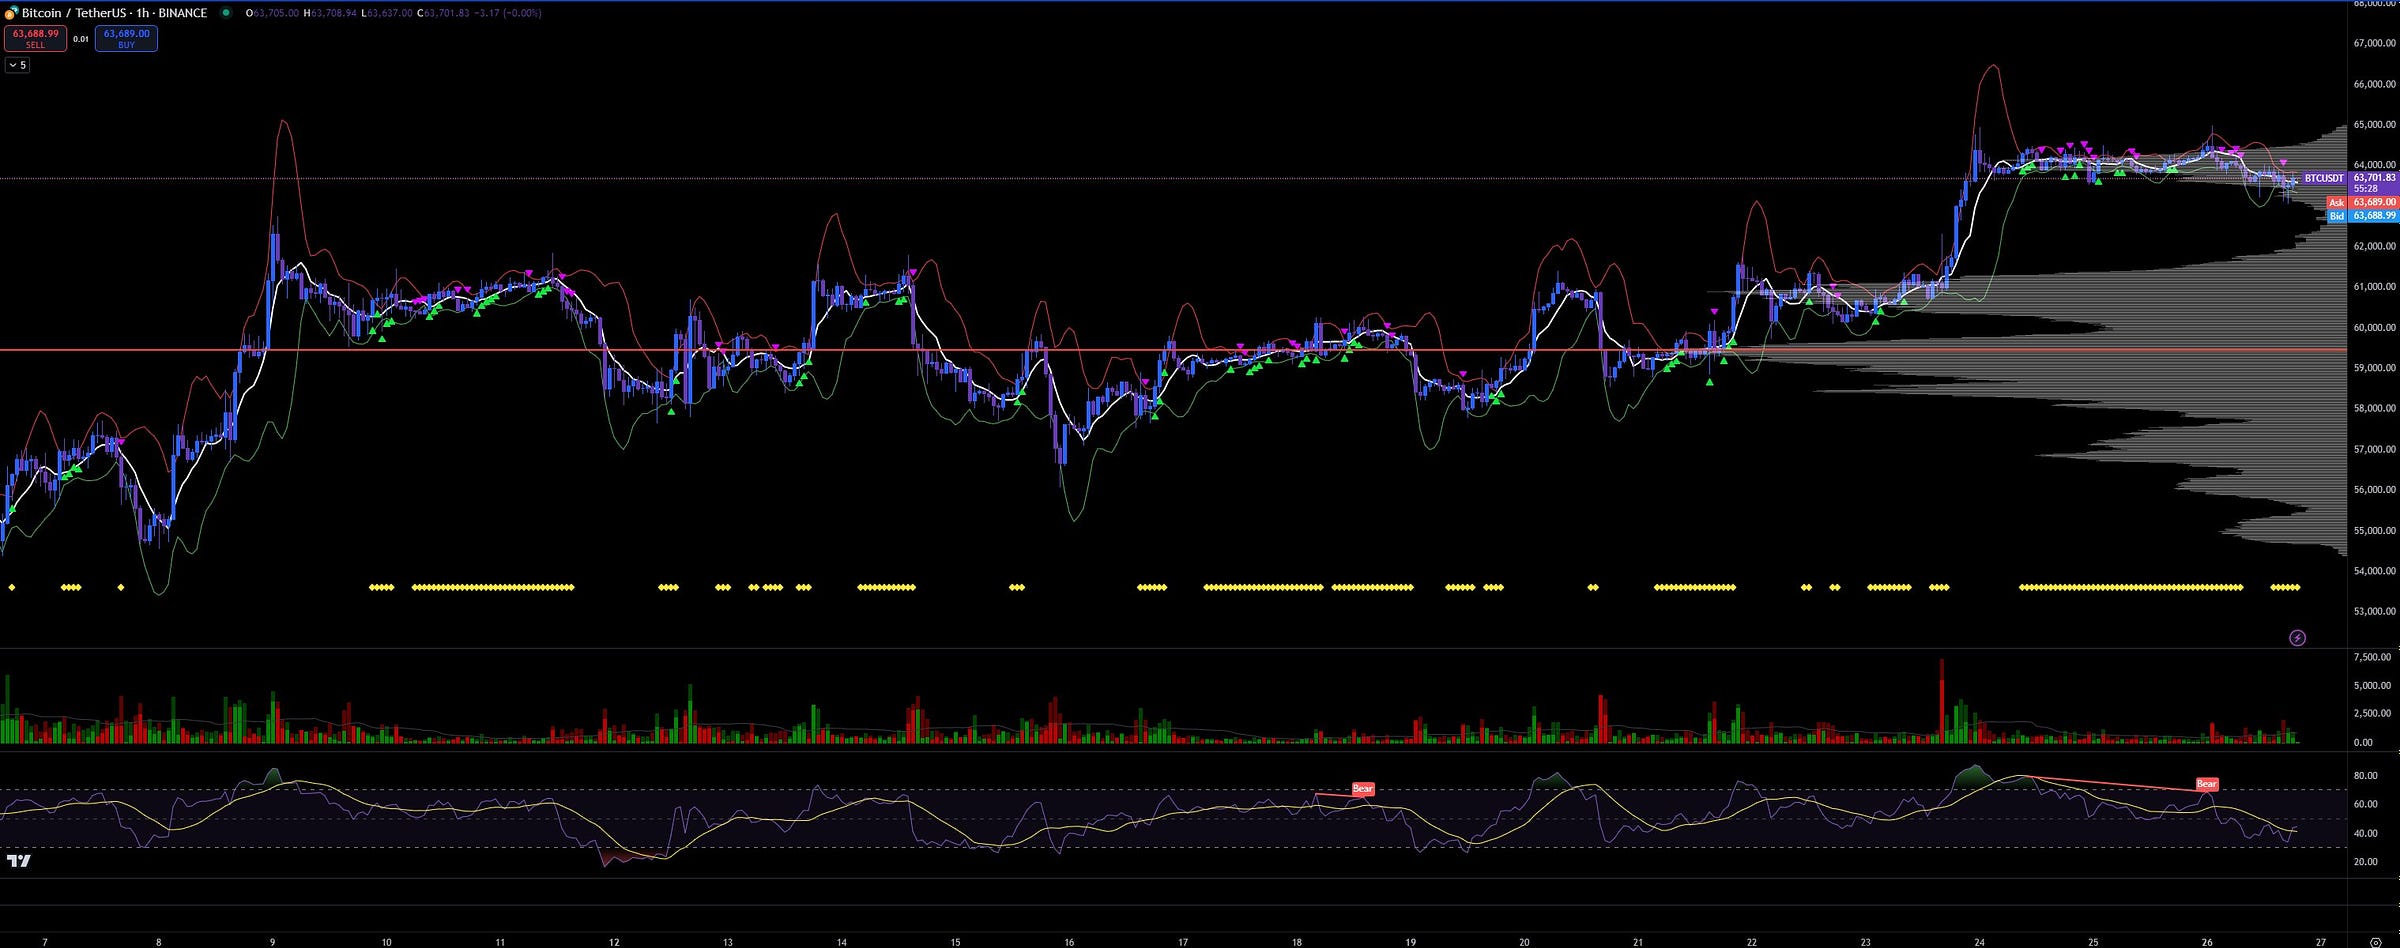
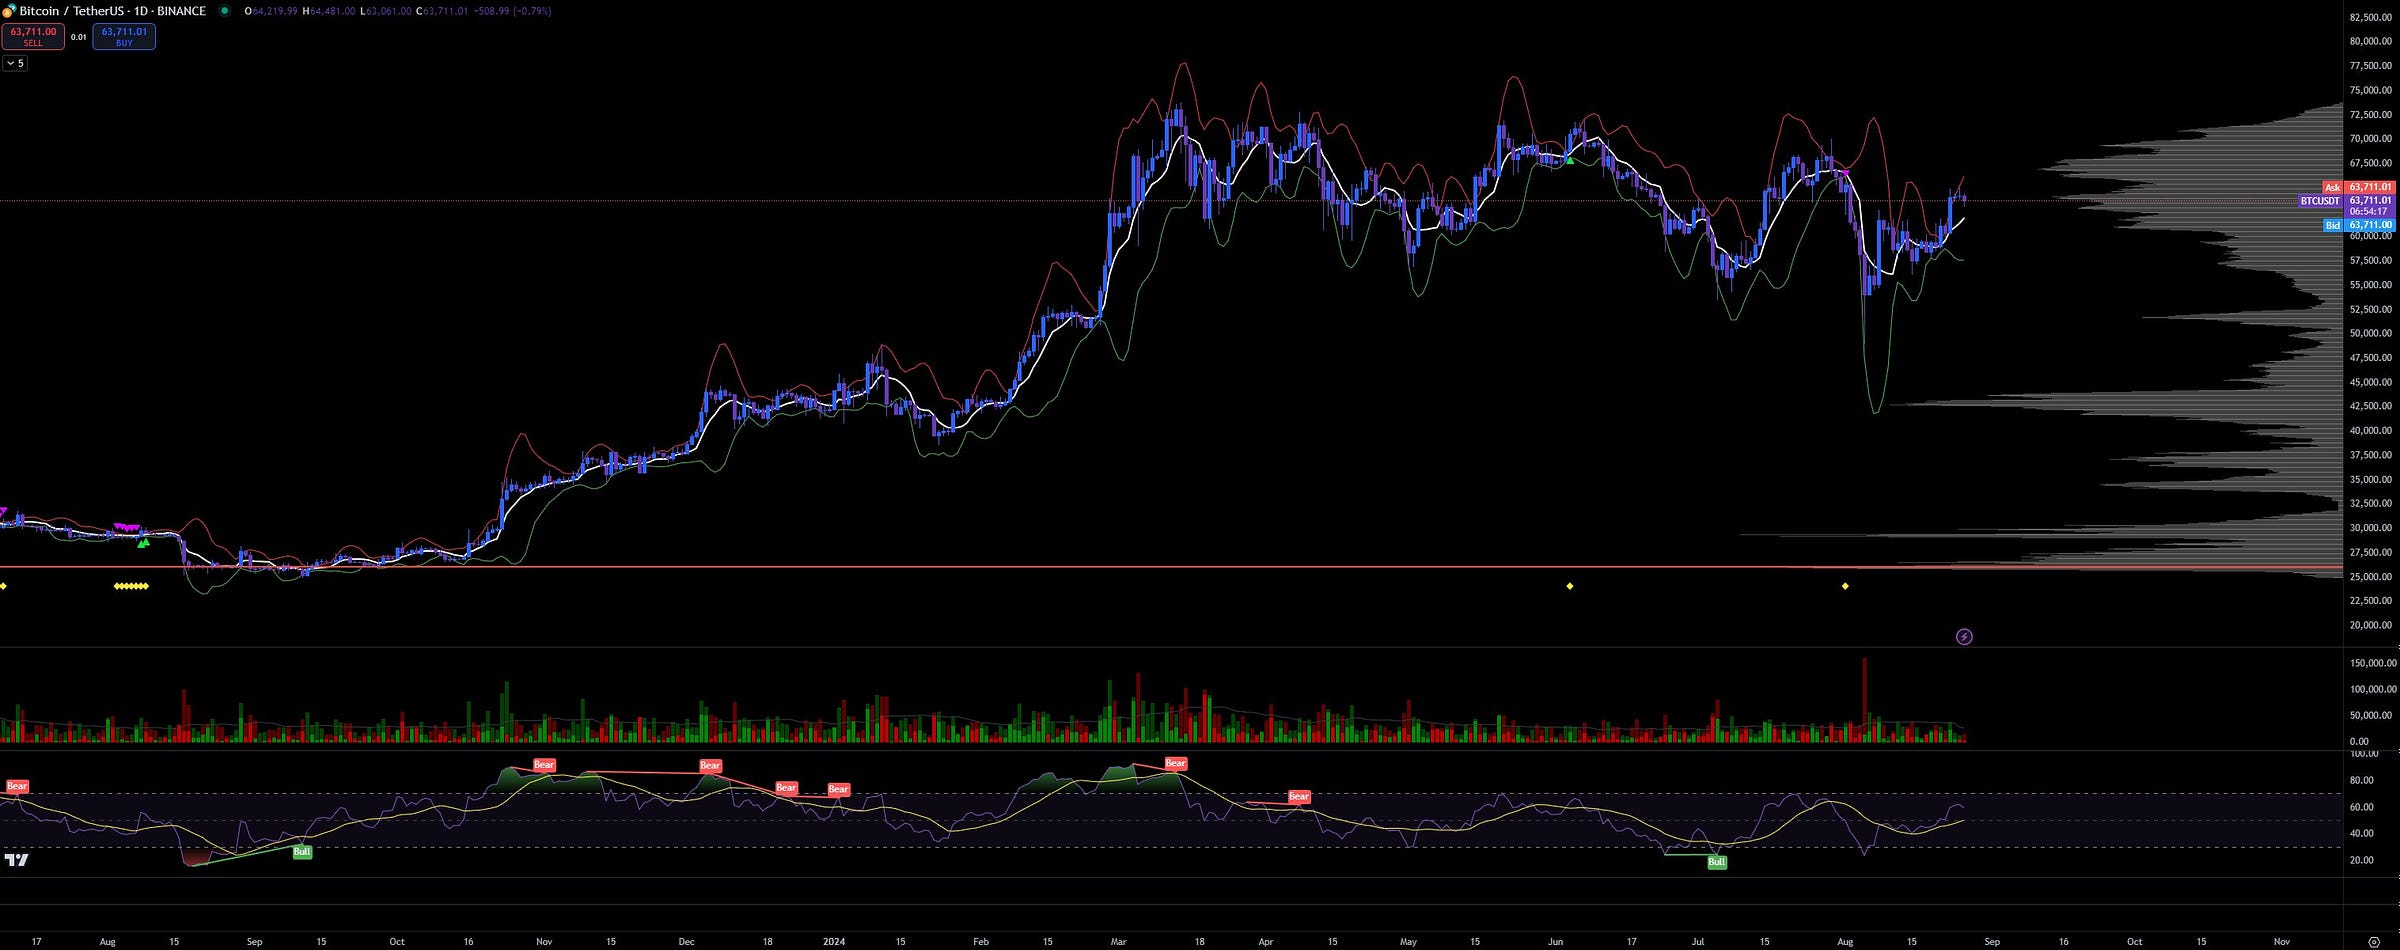
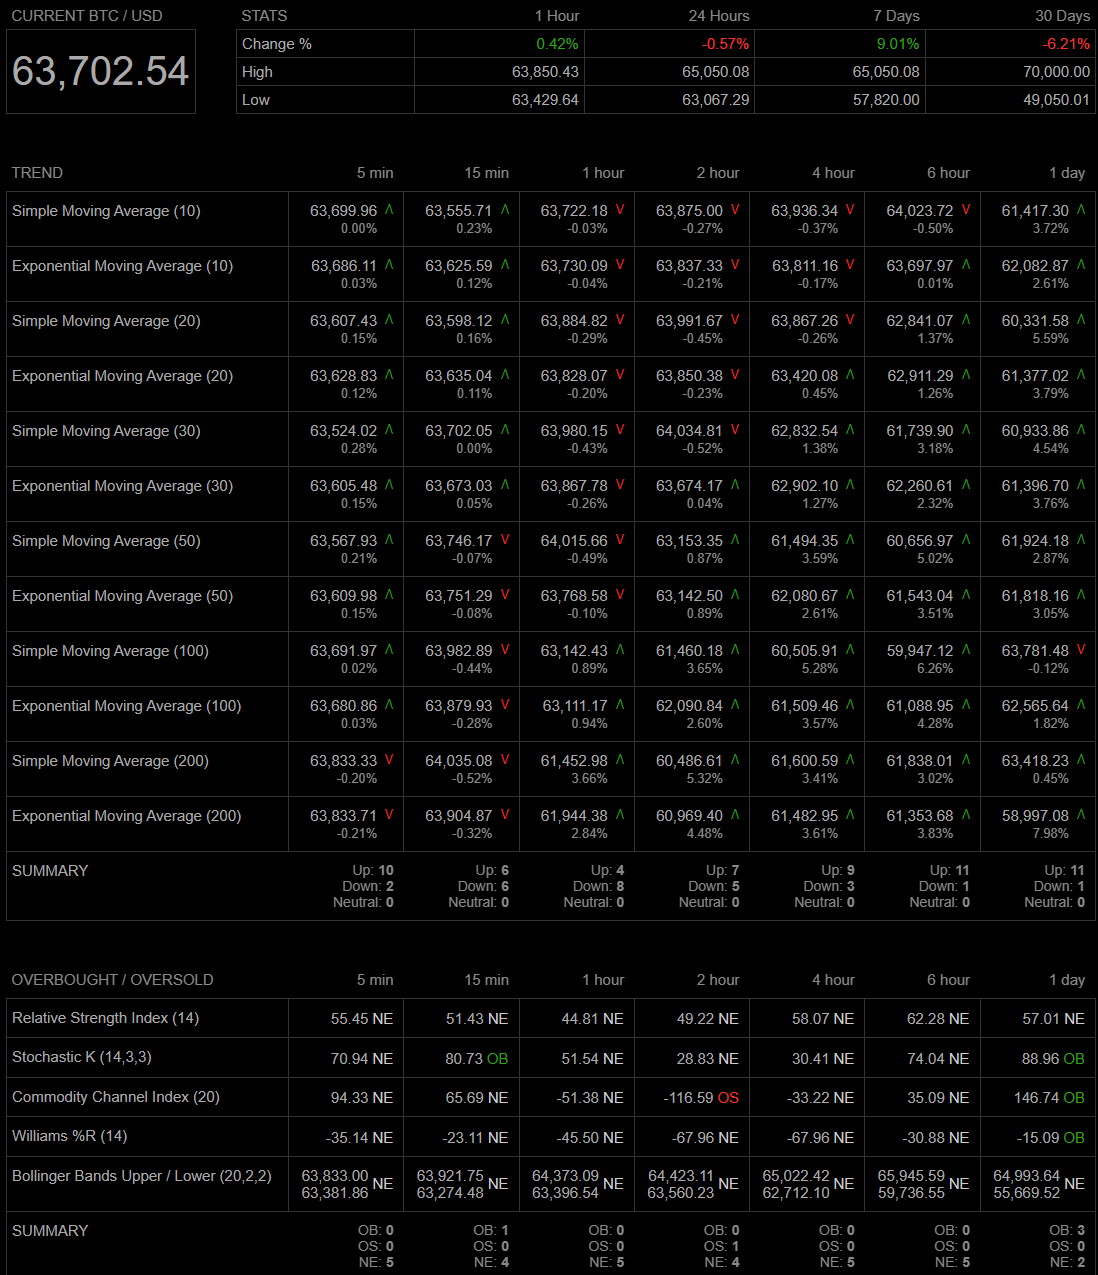
Technical indicators on the 1D and 1H timeframes suggest mixed signals. RSI is in a neutral position on the daily chart, while shorter timeframes show potential overbought conditions. Bollinger Bands are narrowing, indicating reduced volatility.
Conclusion:
The technical setup suggests that BTC is in a consolidation phase, with potential for either a breakout or breakdown depending on upcoming market catalysts.
4. Spot Liquidity / OrderBook Heatmap (Binance BTC/USDT)
Today's Data Analysis:
The heatmap shows significant liquidity between $63,000 and $64,000, with heavier concentrations just above and below this range. This indicates key levels where traders are positioning themselves.
Conclusion:
Liquidity clusters around current prices suggest that any move outside this range could be met with significant resistance or support, potentially leading to sharp price movements.
5. BTC Spot Inflow/Outflow
Today's Data Analysis:
Recent data shows balanced inflows and outflows, with no significant net movement indicating large transfers into or out of exchanges.
Conclusion:
The balanced inflow and outflow data suggests a lack of strong directional bias in the spot market, supporting the idea of a consolidation phase.
Today's Spot Data Summary
Price Movement: Low volatility, trading in a tight range.
Orderbook Liquidity: Strong sell-side liquidity at higher levels.
Technical Analysis: Consolidation with mixed signals from technical indicators.
Liquidity Heatmap: Key levels around $63,000 to $64,000.
Inflow/Outflow: Balanced, indicating no strong market direction.
Possible Impact on the Market in the Next 24 Hours
The market is likely to remain range-bound unless there is a significant increase in volume or a large influx of orders that disrupt the current balance.
Possible Impact on the Market by the End of the Week (01.09.2024)
If the consolidation continues, BTC could see a breakout or breakdown depending on market sentiment and external catalysts, such as economic news or large institutional movements.
Sentiment Evaluation
Rating: 4/10
The sentiment is slightly bearish due to the presence of strong sell-side liquidity and mixed technical signals. However, the balanced inflows and low volatility suggest caution rather than a decisive move in either direction.
1. Summary Overview of Options, Futures, and Spot Market in the Last 24 Hours
Options Market:
The implied volatility (IV) shows mixed signals, with short-term contracts indicating increased volatility. The 25-Delta Skew leans slightly bearish, while historical volatility (HV) is decreasing, suggesting reduced market momentum. The options flow indicates a higher volume of put options, reflecting hedging behavior.
Futures Market:
BTC futures present a slightly bearish outlook with low volume. The funding rate remains stable, and CVD with open interest shows neutral to slightly bearish sentiment. Long/Short ratios suggest balanced positioning, but liquidation data hints at potential selling pressure.
Spot Market:
The spot market is in a tight consolidation phase with low volume. The order book liquidity indicates strong resistance above $64,000, suggesting selling pressure. Technical indicators are mixed, leaning toward consolidation.
2. Market Sentiment Assessment
The overall market sentiment is slightly bearish, with a sentiment rating of 4/10. This rating is based on the dominant presence of sell orders in order books, higher put option volumes, and mixed signals from the futures and spot markets.
3. Forecast for Price Movement in the Next 12 Hours with Support and Resistance Areas
Forecast:
The price is likely to continue consolidating within the range of $63,000 to $64,000. A potential upward breakout may face resistance at $64,500, while a downward move could test the support at $62,500.
Support Areas: $63,000, $62,500
Resistance Areas: $64,000, $64,500
In the short term, the market is expected to remain in a low-volume consolidation phase, with increased volatility risk if either of these key zones is breached.


