1. Options Data
Implied Volatility (IV) & Historical Volatility (HV):
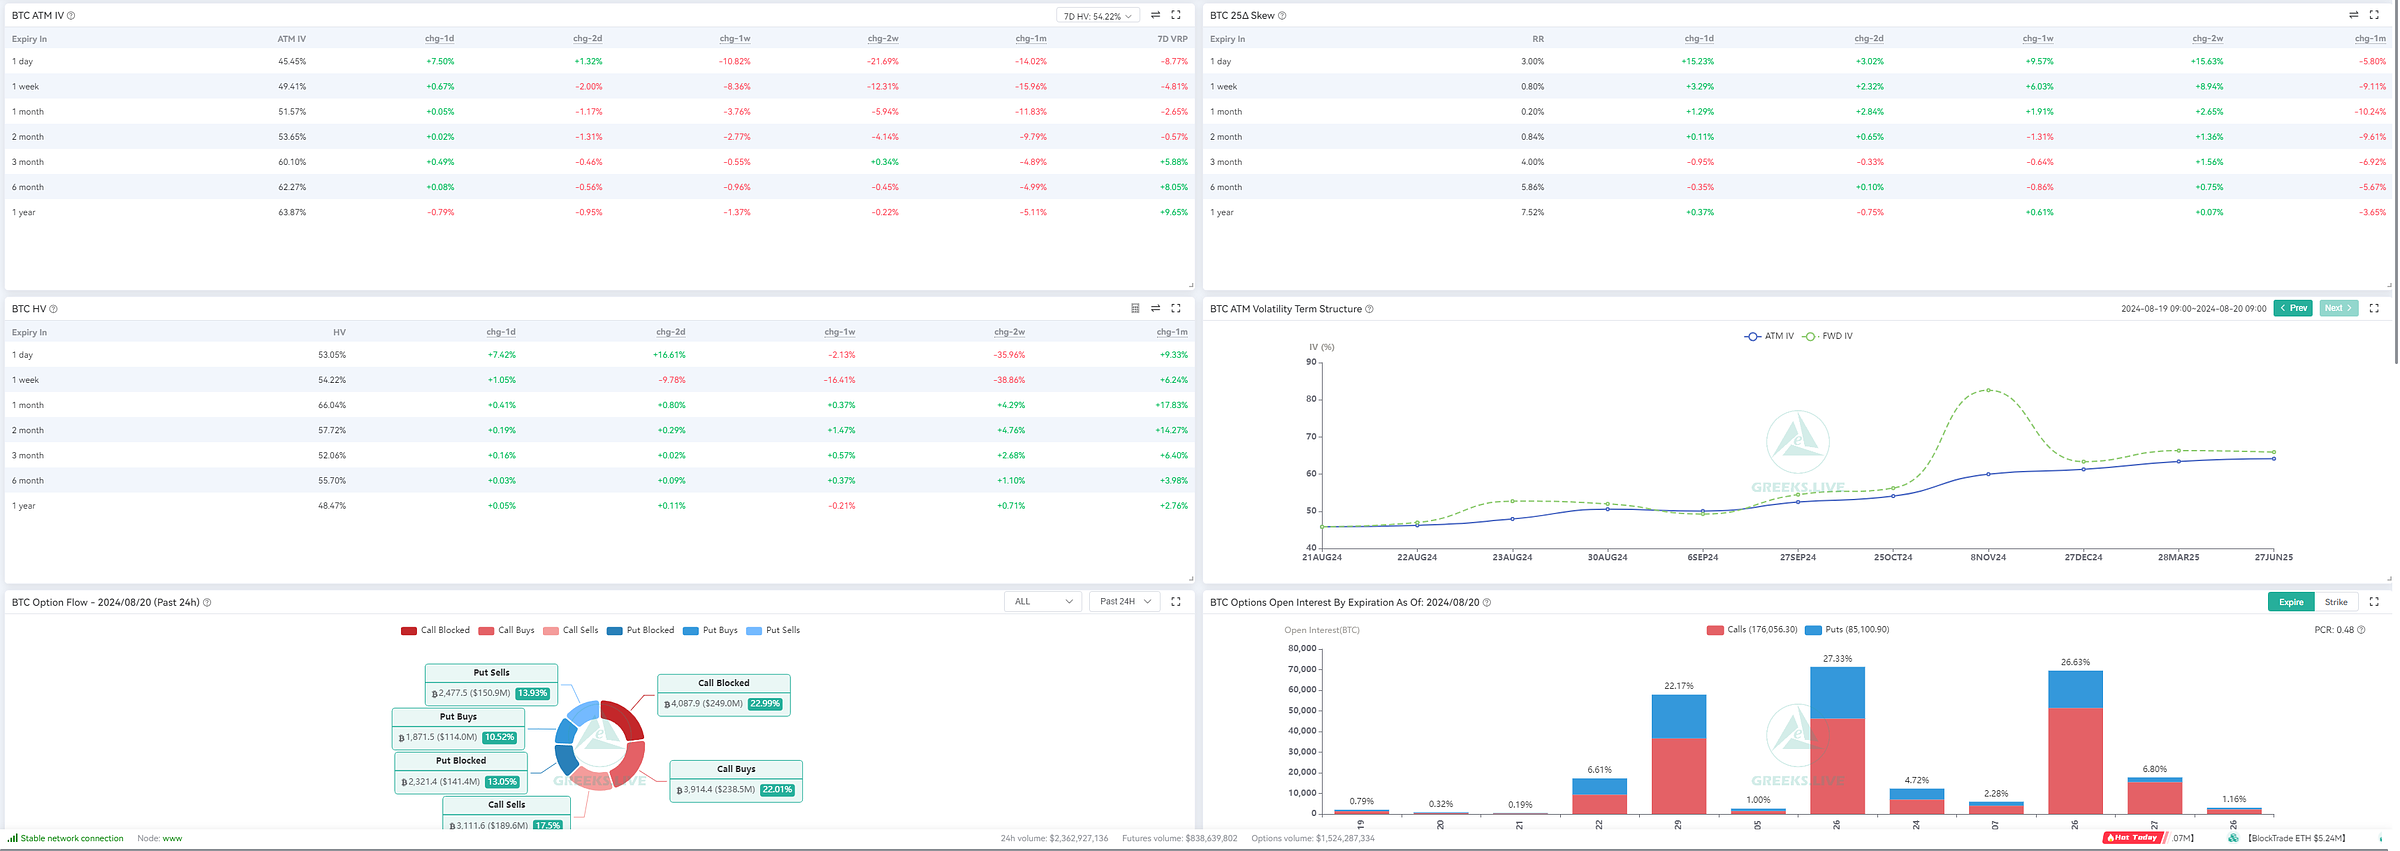
1-Day IV: 45.45% (+7.50%) with a significant short-term increase, indicating potential volatility within the next 24 hours.
1-Week IV: 49.41% (+0.67%) reflects moderate volatility expected over the week.
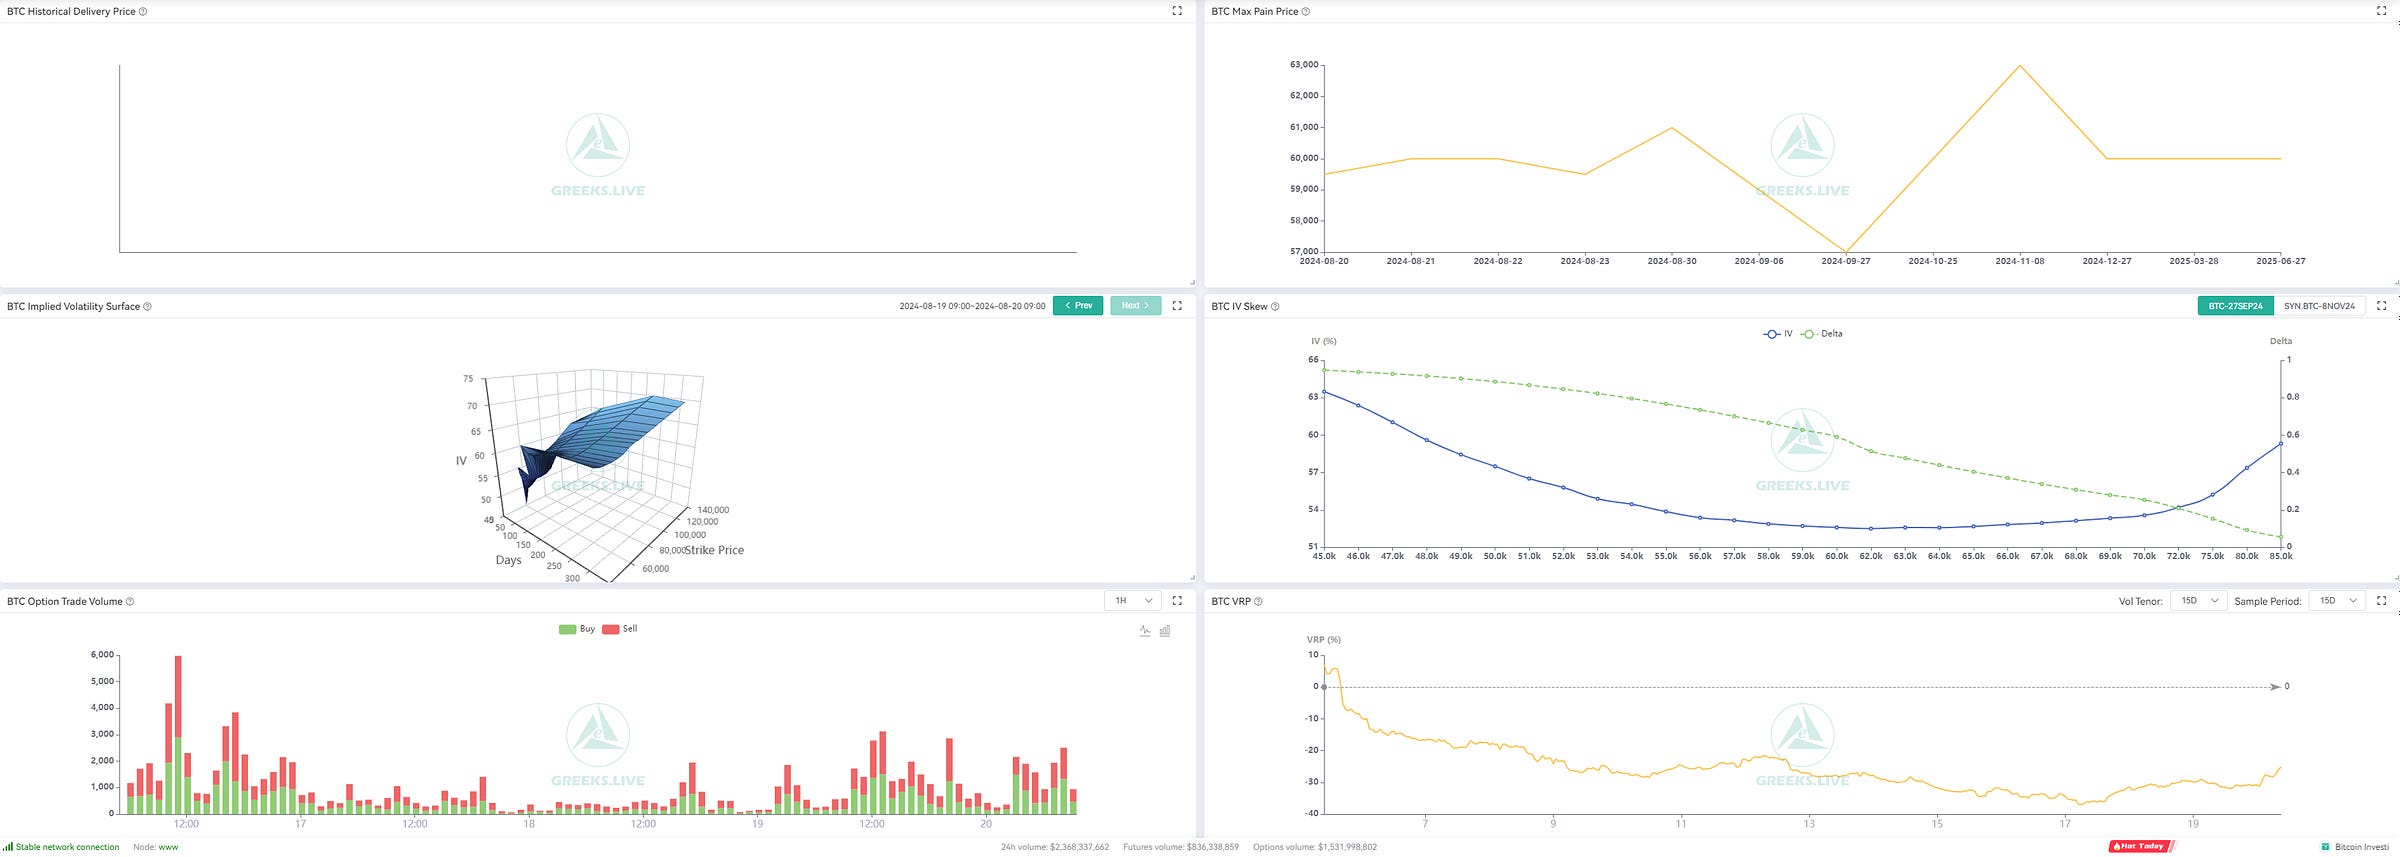
Max Pain Price: The range of $57,000 to $63,000 suggests that the market could stabilize within this band to maximize the number of expiring worthless options.
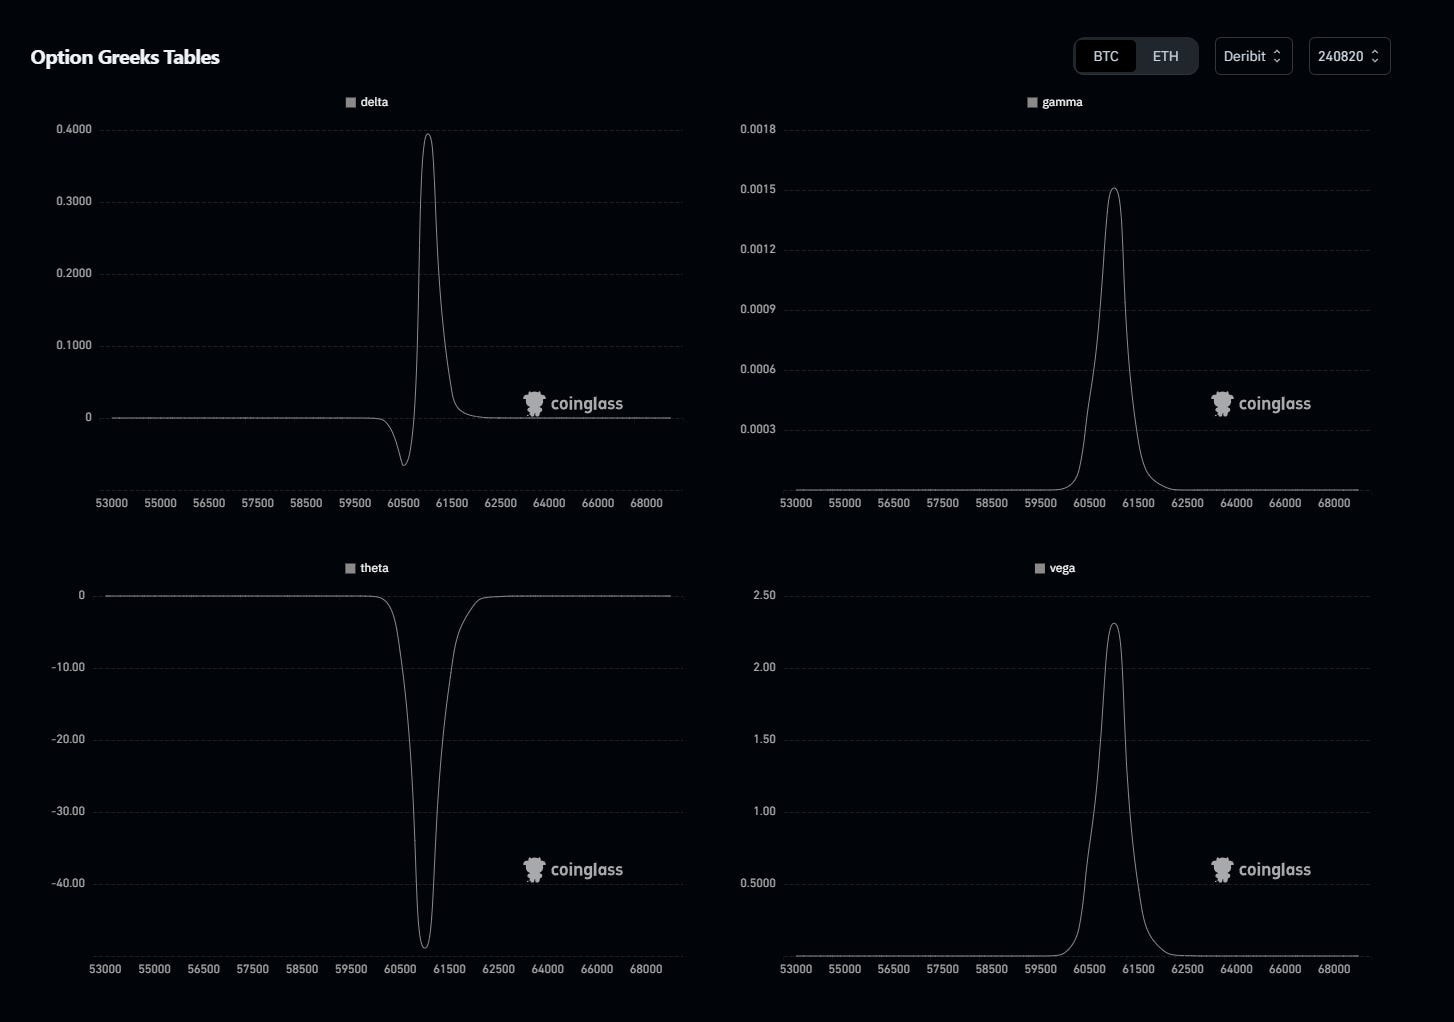
Skew: Skew shows a decreasing IV with higher strike prices, indicating bearish sentiment. The highest concentration of interest is around $60,500, where the sensitivity (Gamma, Delta) is also highest.
Open Interest
Significant Strike Prices: Most open interest is centered around the $60,500 level. This is a critical level as high option sensitivity suggests that any move above or below this price could result in increased volatility.
Put-Call Ratio: The open interest shows a significant concentration of puts, suggesting a cautious or bearish sentiment among options traders.
2. Futures Data
Volume & Open Interest
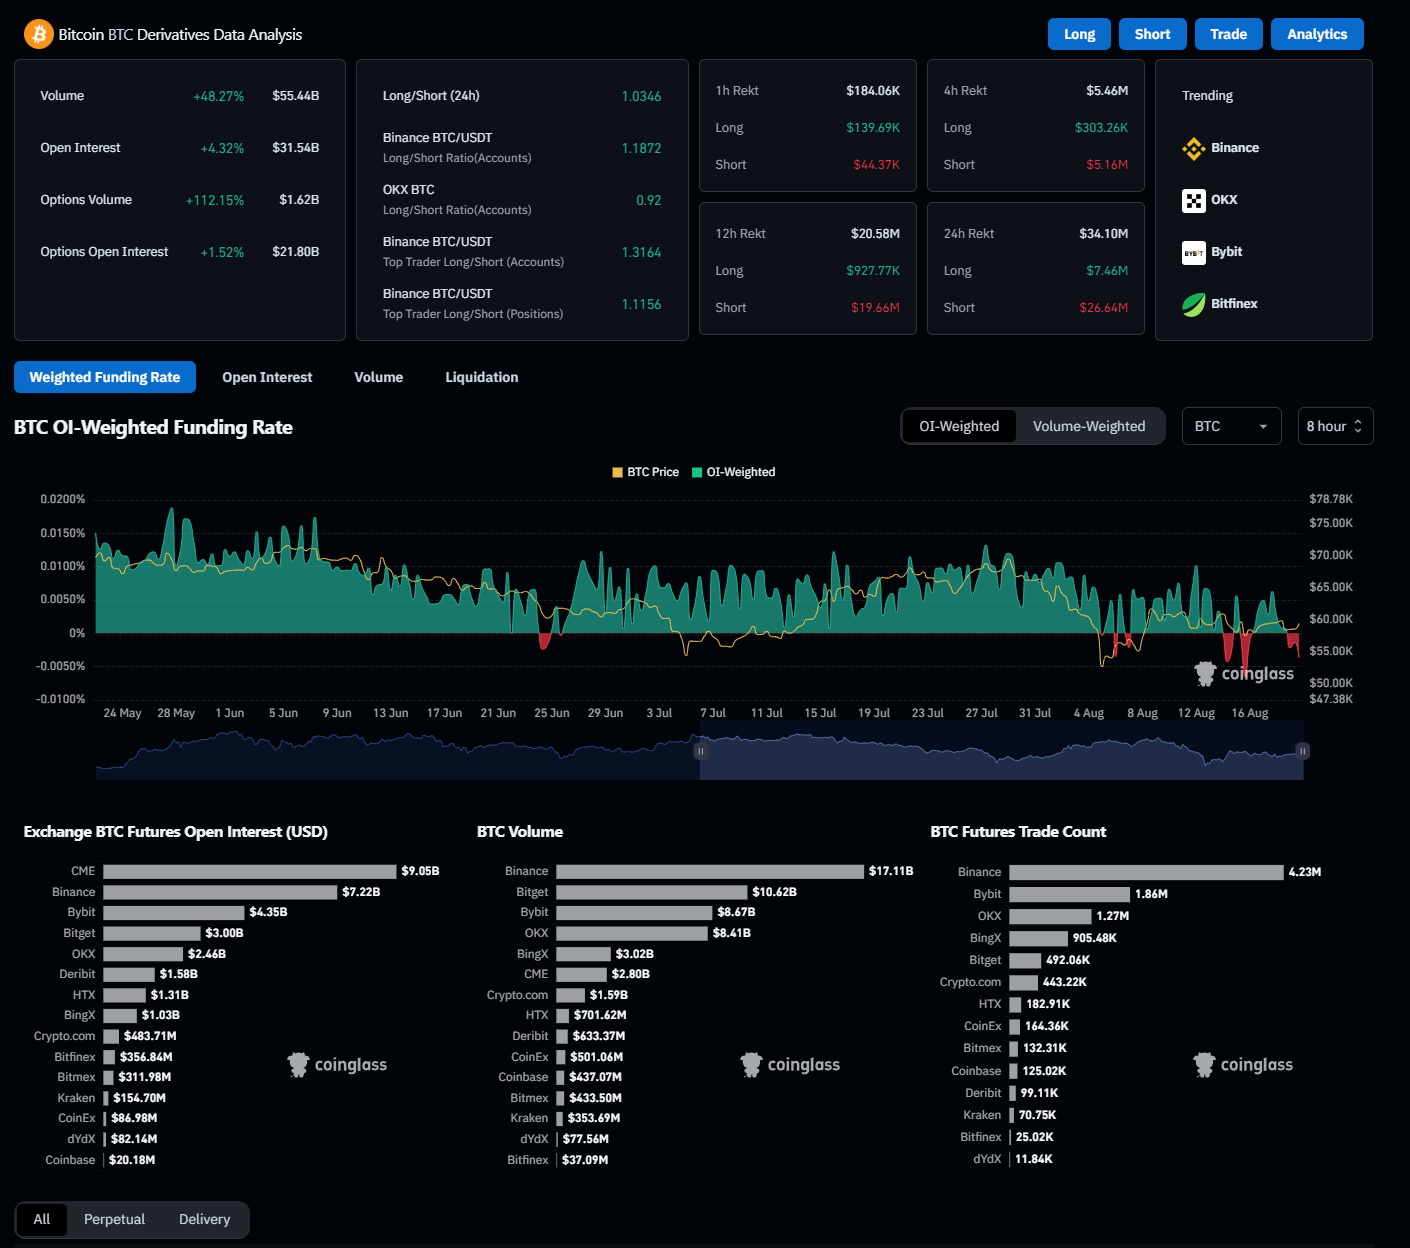
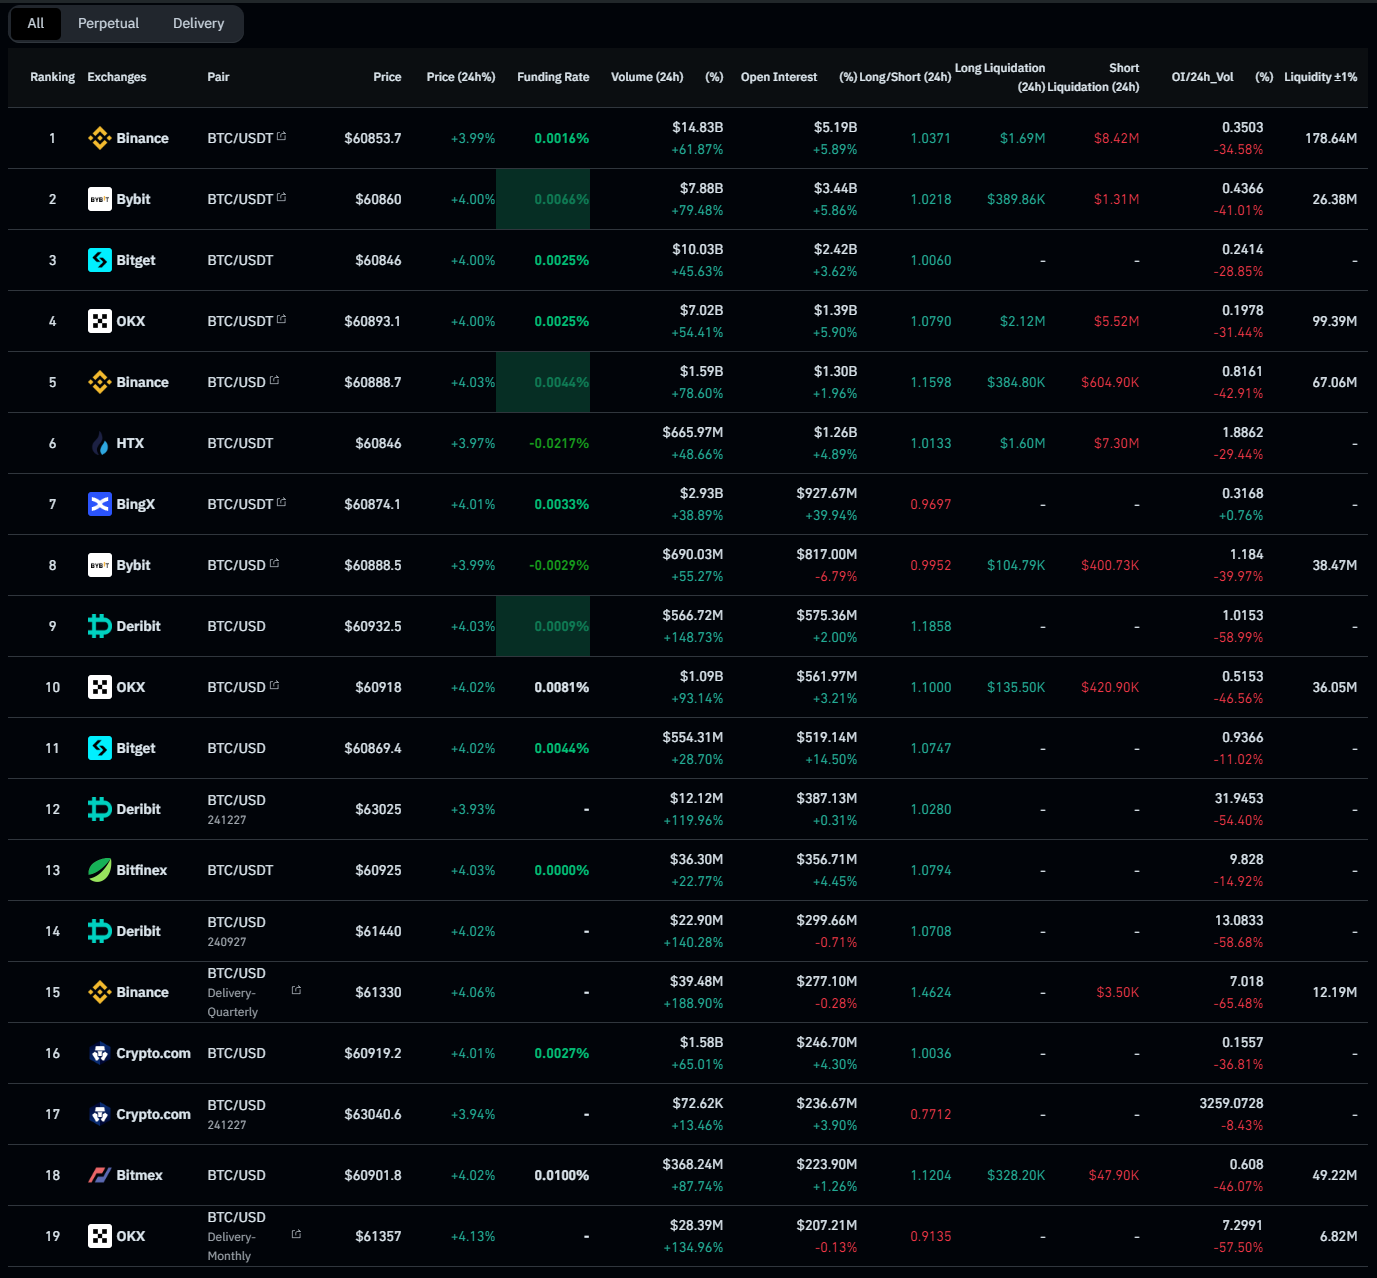
Binance: Leads with $14.83B in volume and $5.19B in open interest. A strong indication of liquidity and market participation. Funding rate is slightly positive at +0.0016%.
Bybit & Bitget: Show strong volume as well, with positive price action (+4.00%) and similar funding rates, indicating bullish sentiment.
HTX: Stands out with a negative funding rate (-0.0217%), suggesting bearish sentiment, which is a divergence from the overall market trend.
Liquidations: Significant short liquidations on Bybit and OKX hint at potential short squeezes, which could drive prices higher if the trend continues.
Funding Rates
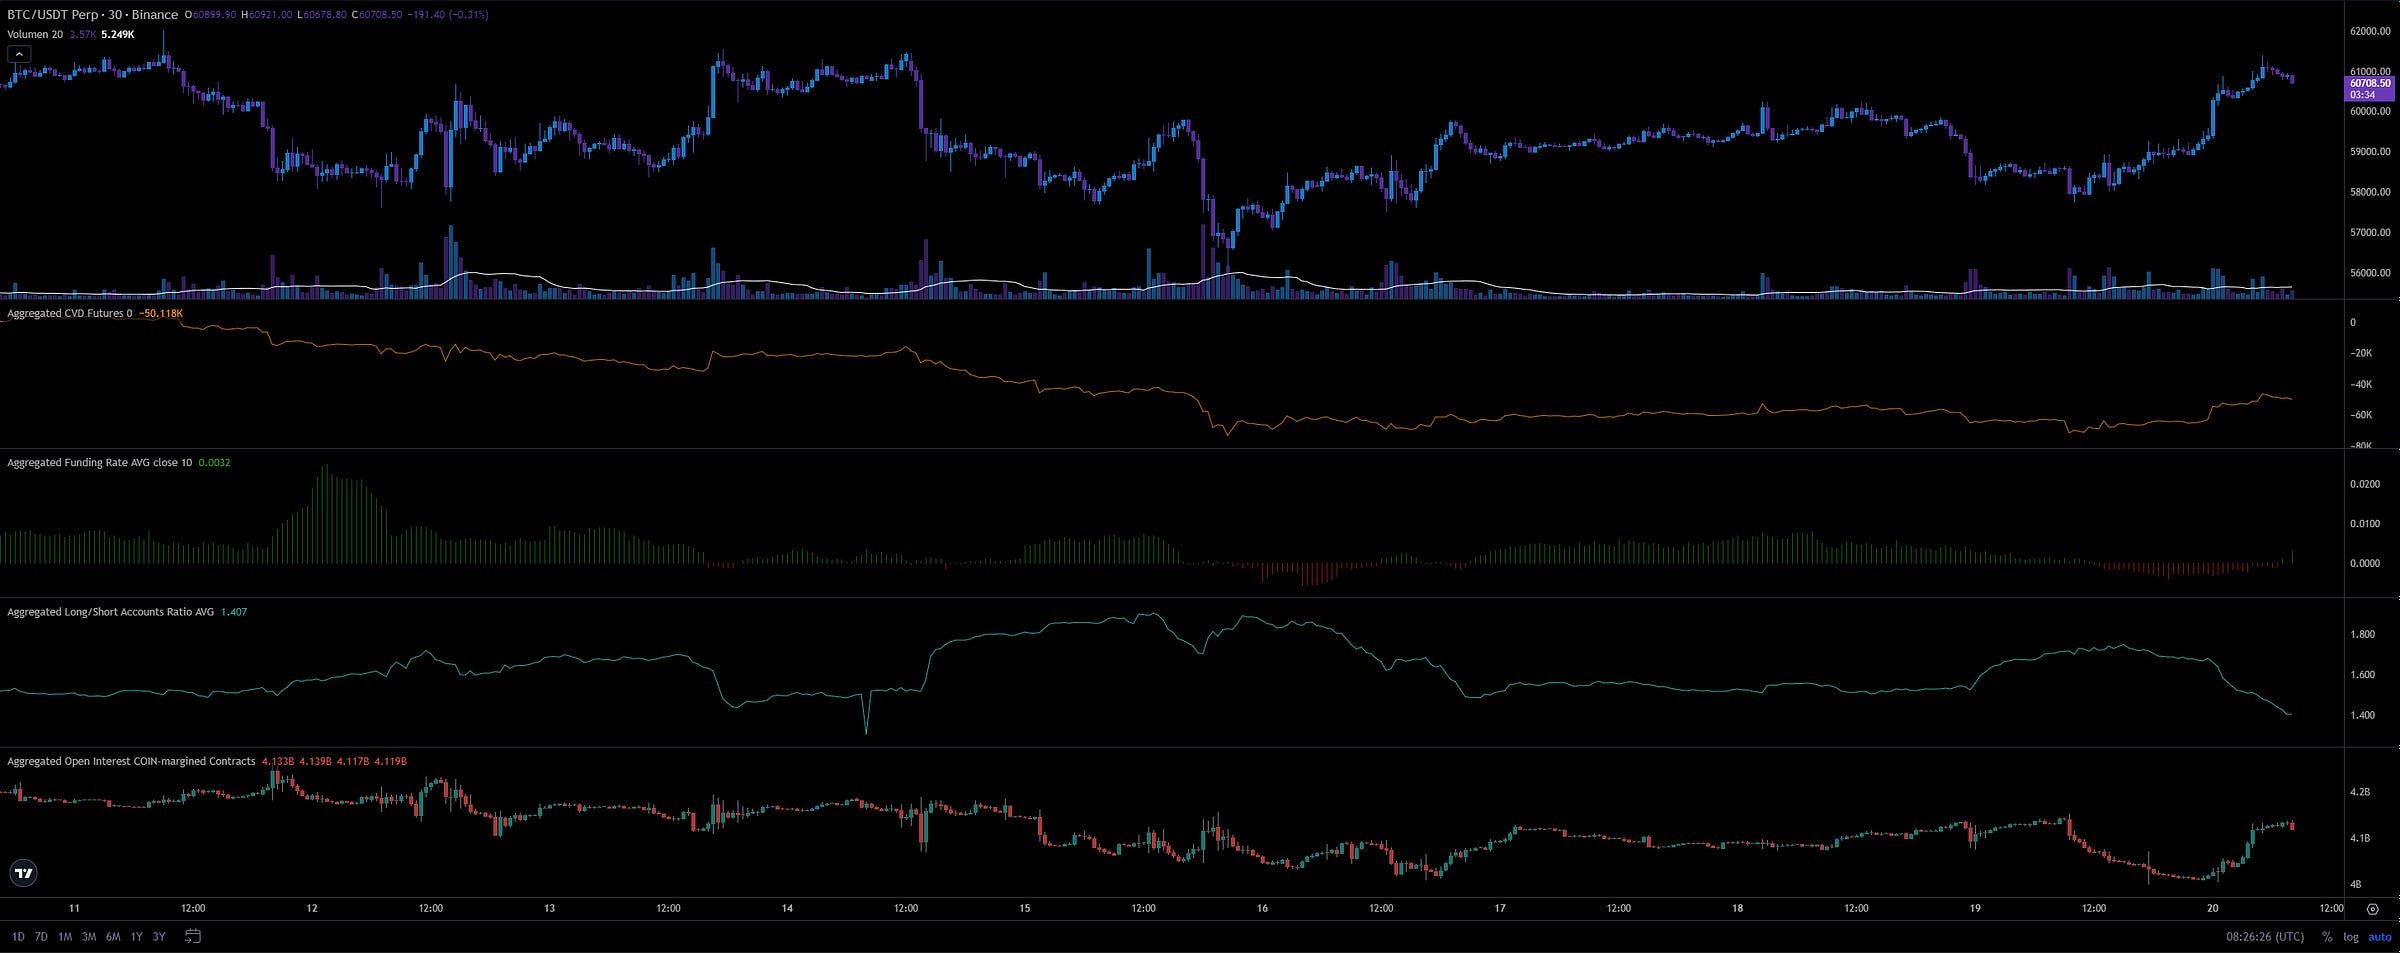
The weighted funding rate shows fluctuations with occasional dips into negative territory, suggesting mixed sentiment but with a general leaning towards bullishness.
The OI-weighted funding rate has recently turned slightly negative, indicating some caution as traders might be hedging or reducing risk exposure.
3. Technical Analysis (TA)
Price Action
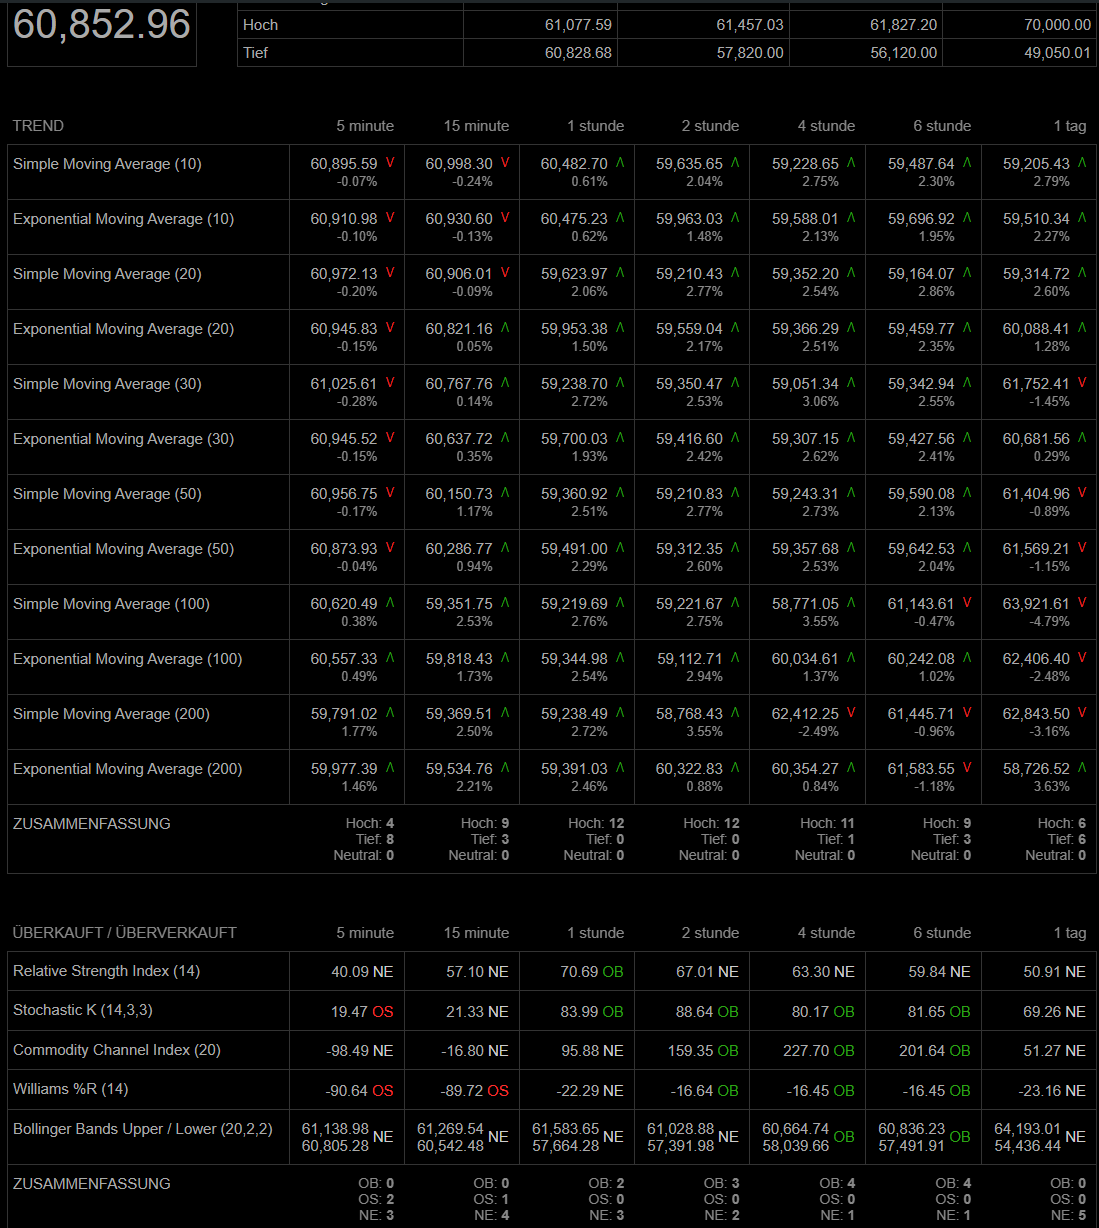
Bitcoin is currently trading around $60,852.96, just below a critical resistance level at $61,000.
Moving Averages: Short-term MAs are strongly bullish, with the 1-hour and 2-hour SMAs showing a 2-3% increase. Longer-term (1 day) SMAs also reflect bullish trends, but with slightly less momentum.
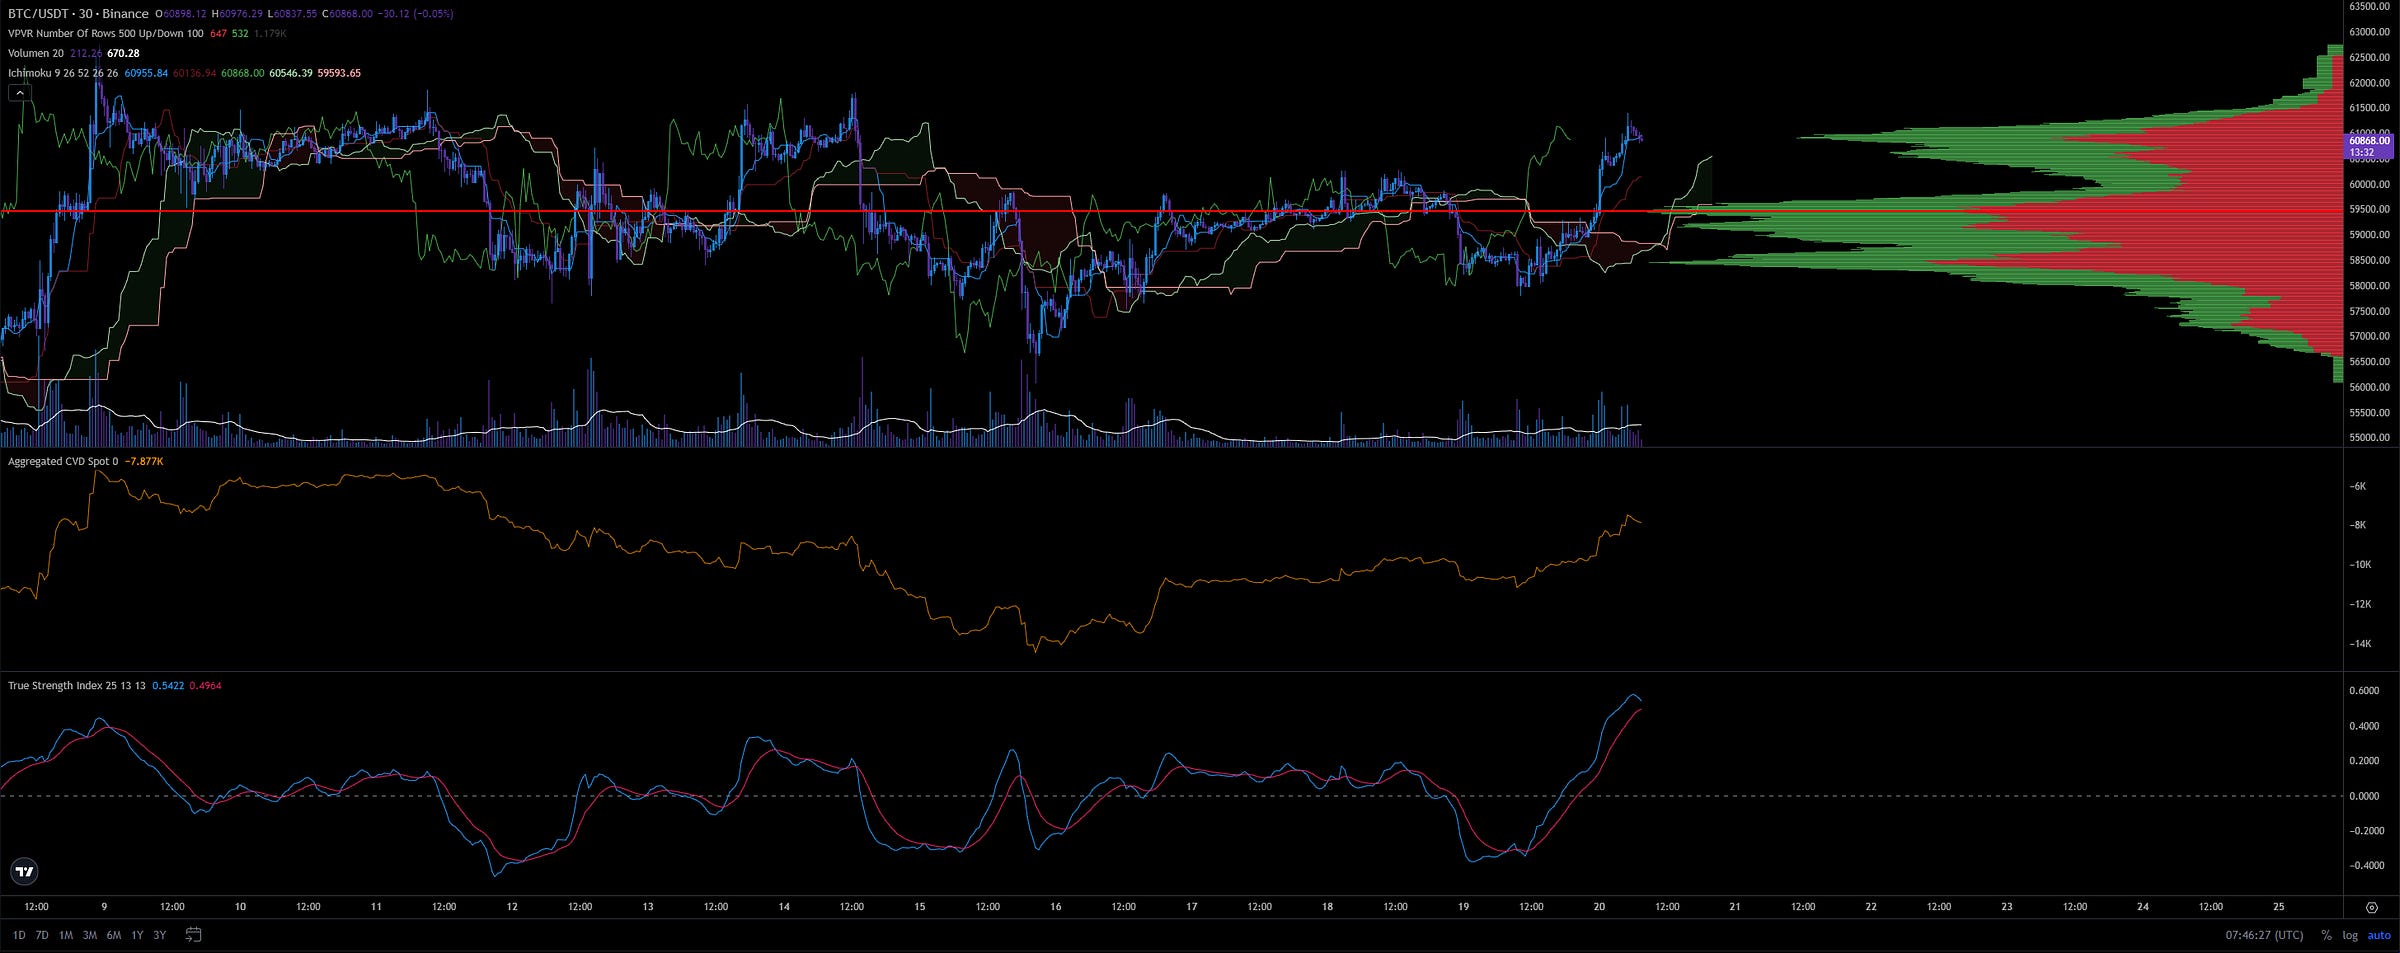
Ichimoku Cloud: Price is above the cloud on the 30-minute chart, indicating a bullish trend, though the cloud's flatness suggests potential consolidation.
Overbought/Oversold Indicators
RSI: Near overbought levels in the 1-hour timeframe (70.69), indicating potential for a short-term pullback.
Stochastic K: Also in the overbought zone, reinforcing the likelihood of a correction.
Williams %R: Suggests similar overbought conditions, particularly in the 1-hour and 2-hour timeframes.
Volume Profile (VPVR): Heavy volume is concentrated between $57,000 and $61,000, indicating strong support and resistance within this range.
4. Trading Ideas
4.1 Opportunities
Next 24 Hours
Long Entry: If the price breaks above $61,000 with increasing volume, consider a long position targeting $62,000 to $63,000.
Short Entry: If the price fails to break $61,000 and shows signs of rejection, a short position targeting $59,000 could be profitable, especially given the overbought conditions.
This Week
Long on Dips: Look for potential entries around $59,000 if a pullback occurs, with an upward target around $61,500 to $62,000. This is based on the strong support shown by the volume profile and the bullish moving averages.
Range Trading: Given the significant volume between $57,000 and $61,000, consider range trading strategies within this band.
4.2 Risks
Next 24 Hours
Overbought Conditions: Indicators like RSI, Stochastic K, and Williams %R suggest that the market is nearing overbought levels. A short-term pullback is possible, especially if the price struggles to break above $61,000.
Funding Rate Divergence: Negative funding rates on exchanges like HTX suggest some market participants are betting on a downside move, which could cause a sudden shift in momentum.
This Week
Potential Rejection at $61,000: Failure to sustain above this critical resistance could lead to a deeper retracement towards $57,000, which could invalidate bullish setups.
Short Squeeze Risk: While short liquidations could propel the price higher, a sudden influx of buying could also lead to an unsustainable rally, increasing the risk of a sharp correction.
5. My Personal Conclusion
The market pumped overnight, leading to an increase in Open Interest due to new Coin margin positions. However, this reaction was delayed, possibly indicating that traders were caught off guard. Despite this, the Long/Short Ratio continues to decline, showing the dominance of shorts.
The market moved sideways with low volume for most of the time, then spiked after midnight (CET) to retest the $61,000 resistance. Options data suggest a shift in sentiment; previously optimistic, it now leans more bearish, often reflecting institutional traders.
I remain cautious. The market could just as easily lose $60,500, bringing us down to $57,000 quickly. The key will be the reaction of volume and price action at $60,500. If Bitcoin loses bullish momentum, options traders could push it down. Otherwise, breaking and holding above $61,000 could open the door to $63,000.


Thx bro
Best crypto analytics, missed this. Much appreciated Inspo!