Whales ratio
Hourly View
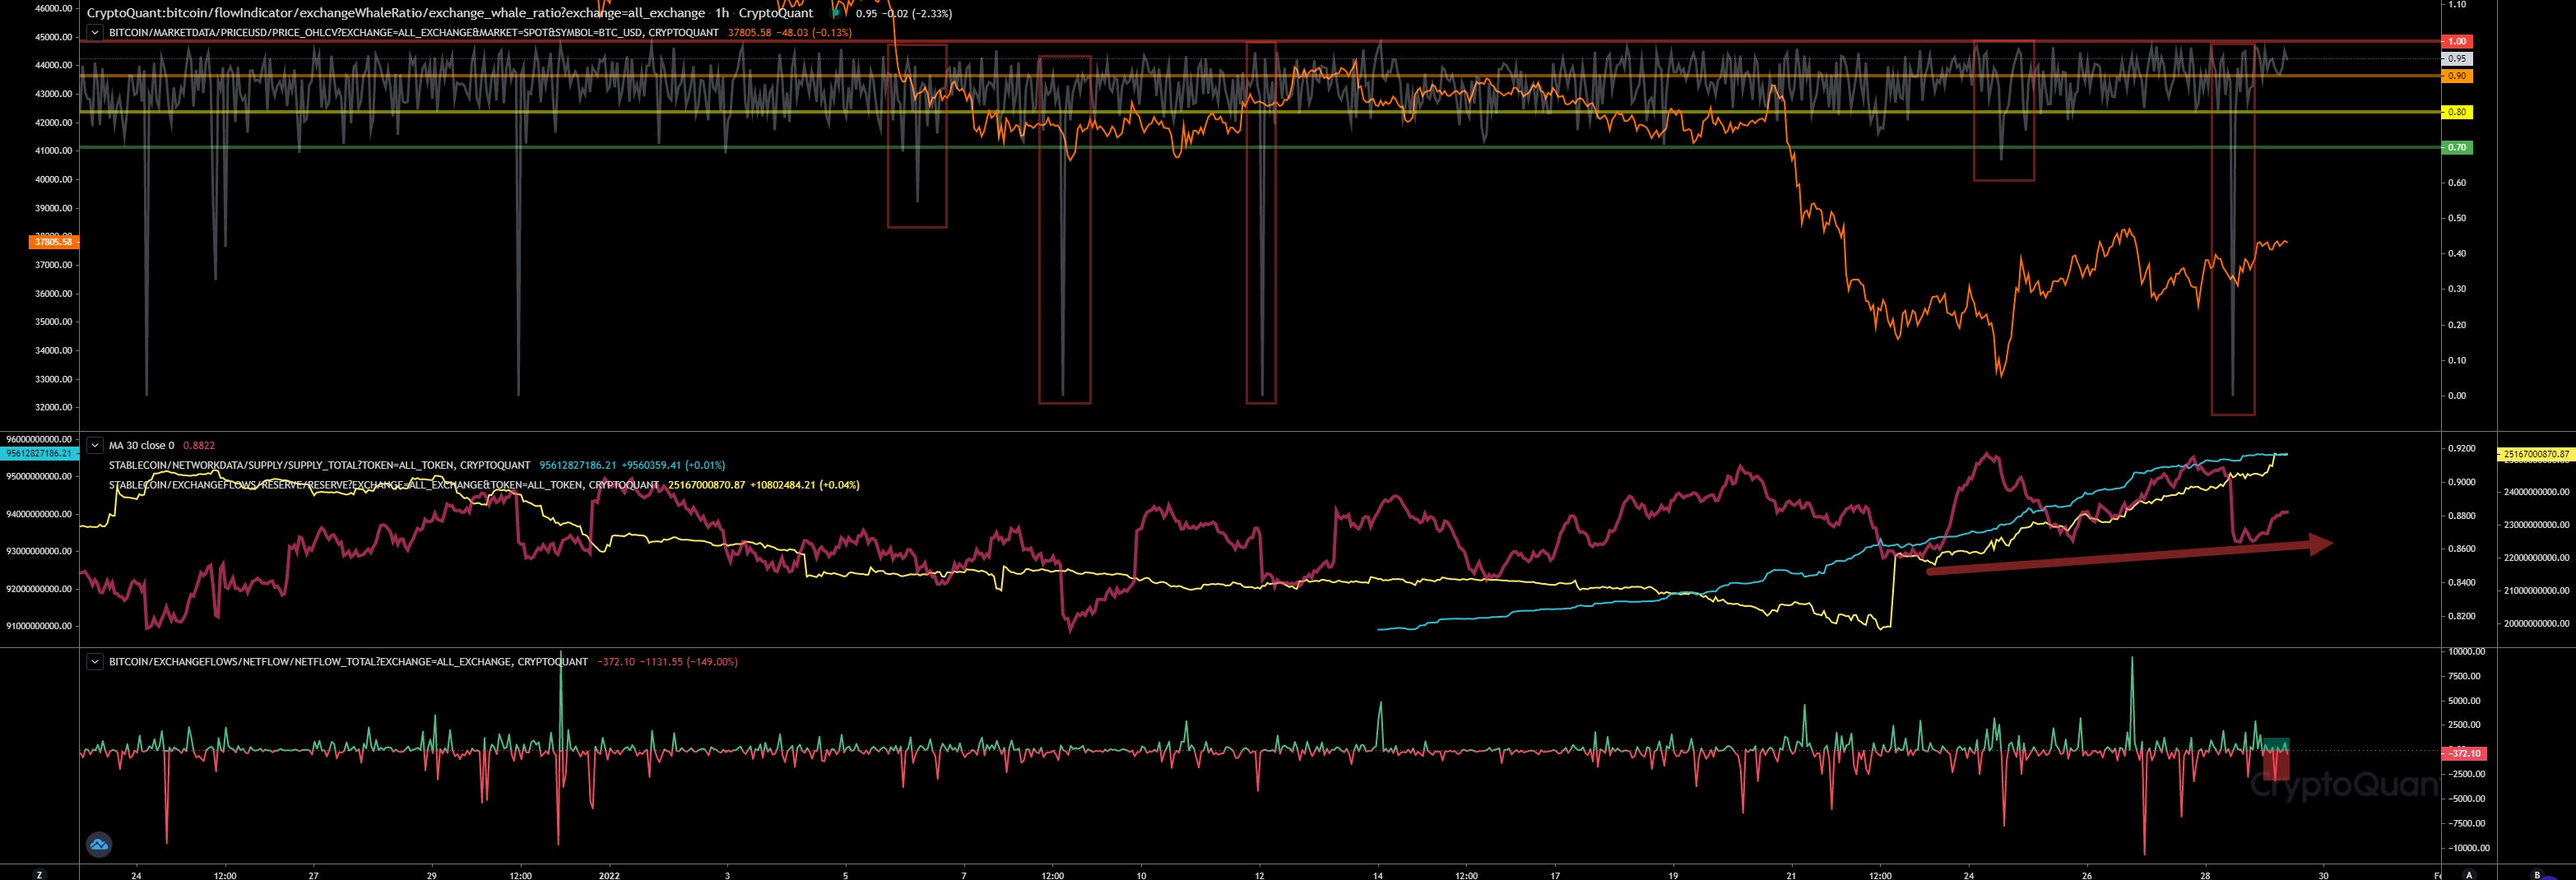
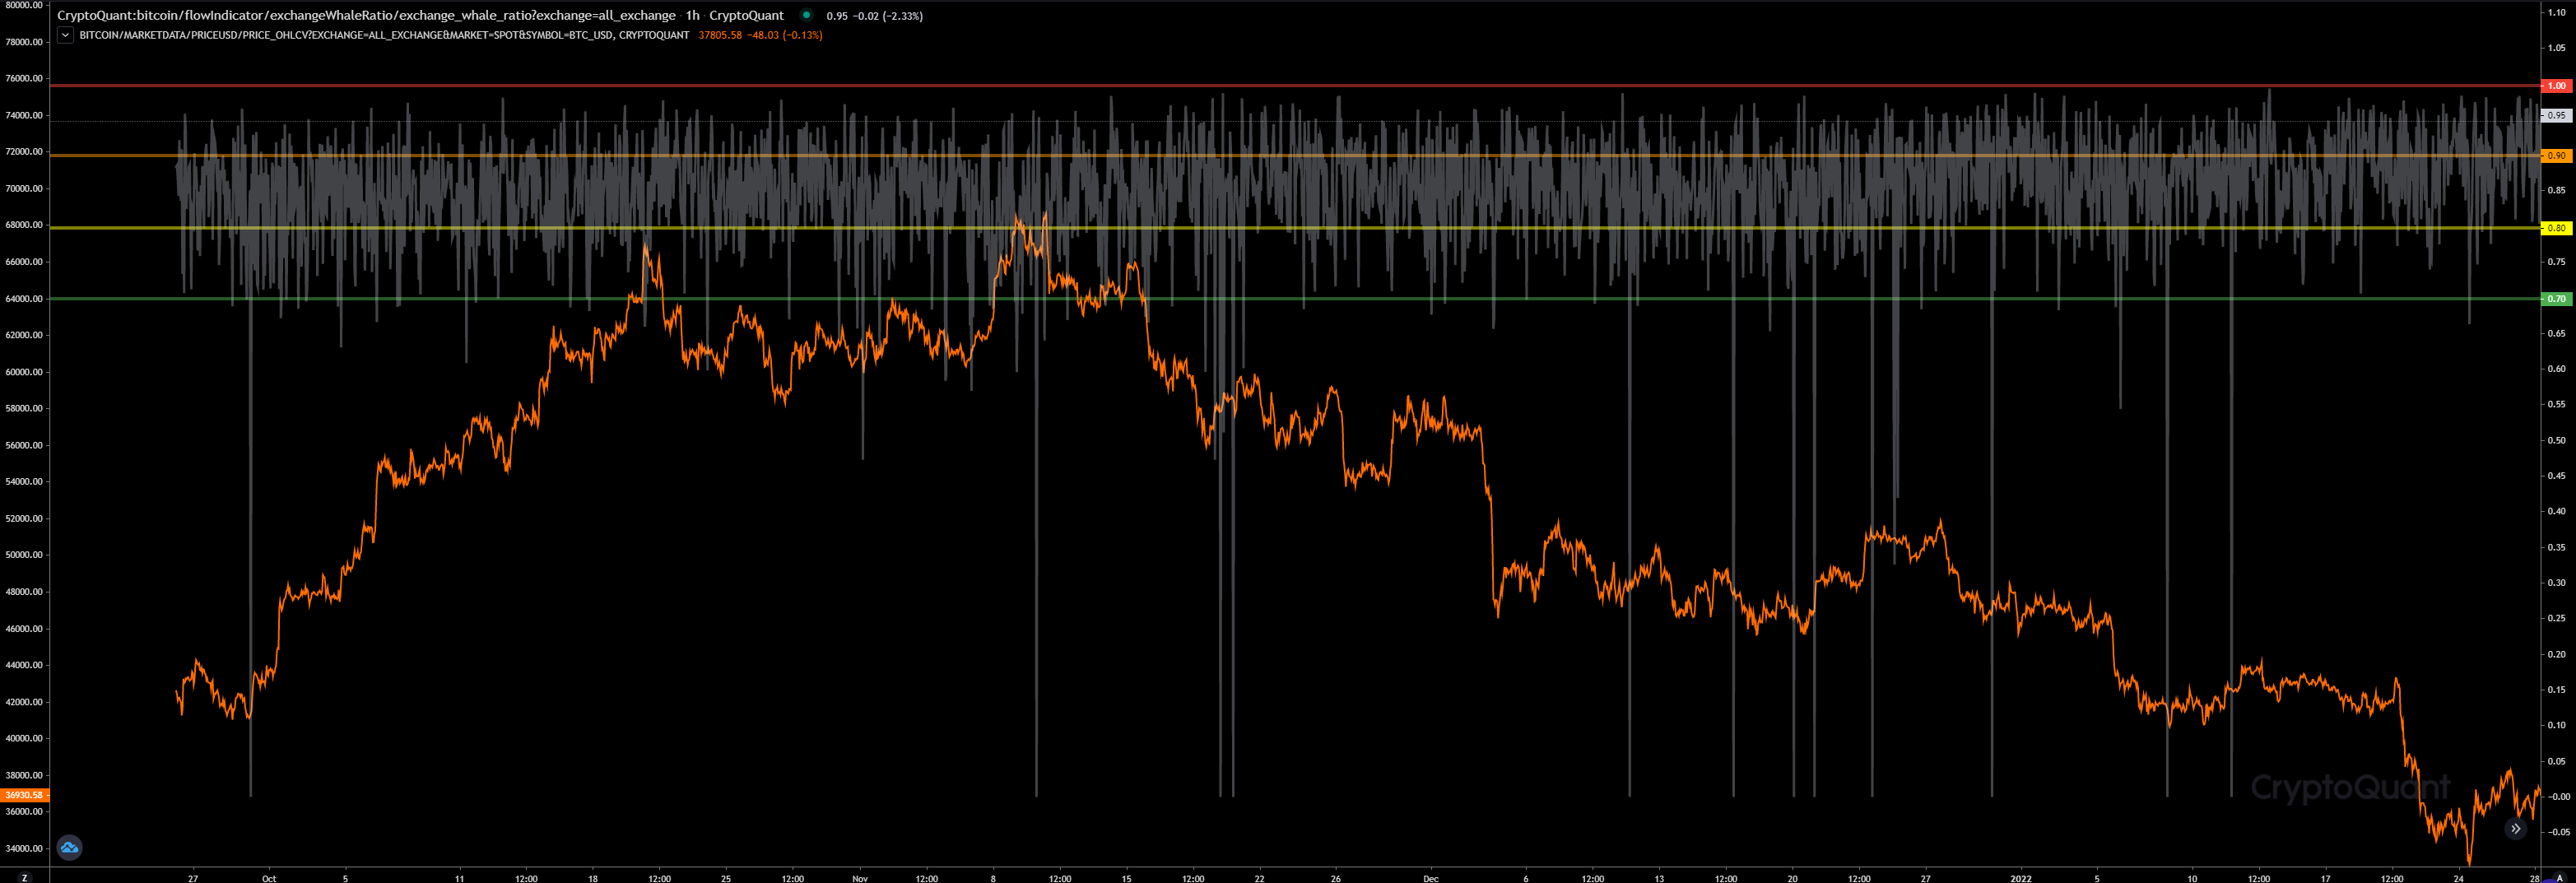
Well, as noticed yesterday, we see the whales ratio weaken announcing a positive price action coming. Thats at least an accurate indicator that shows an incoming change in price action. To show you how accurate it is, just check the whales ratio chart below. Everytime when the whales ratio dumps it has a positive price action afterwards. So, we should expect that the price will lift up more heading our resistance. By the way, check our stablecoin reserves on exchanges. We are reaching $25.2 billion. That’s insane. We had almost $20 billion just few days ago. It seems exchanges are expecting a sell-off or a huge demand for crypto assets. Both require stablecoins for exchanges like Binance that almost only provide USDT pairs.
URL to chart: https://cryptoquant.com/prochart/vYNO3z1cx9LcSvg
Block View
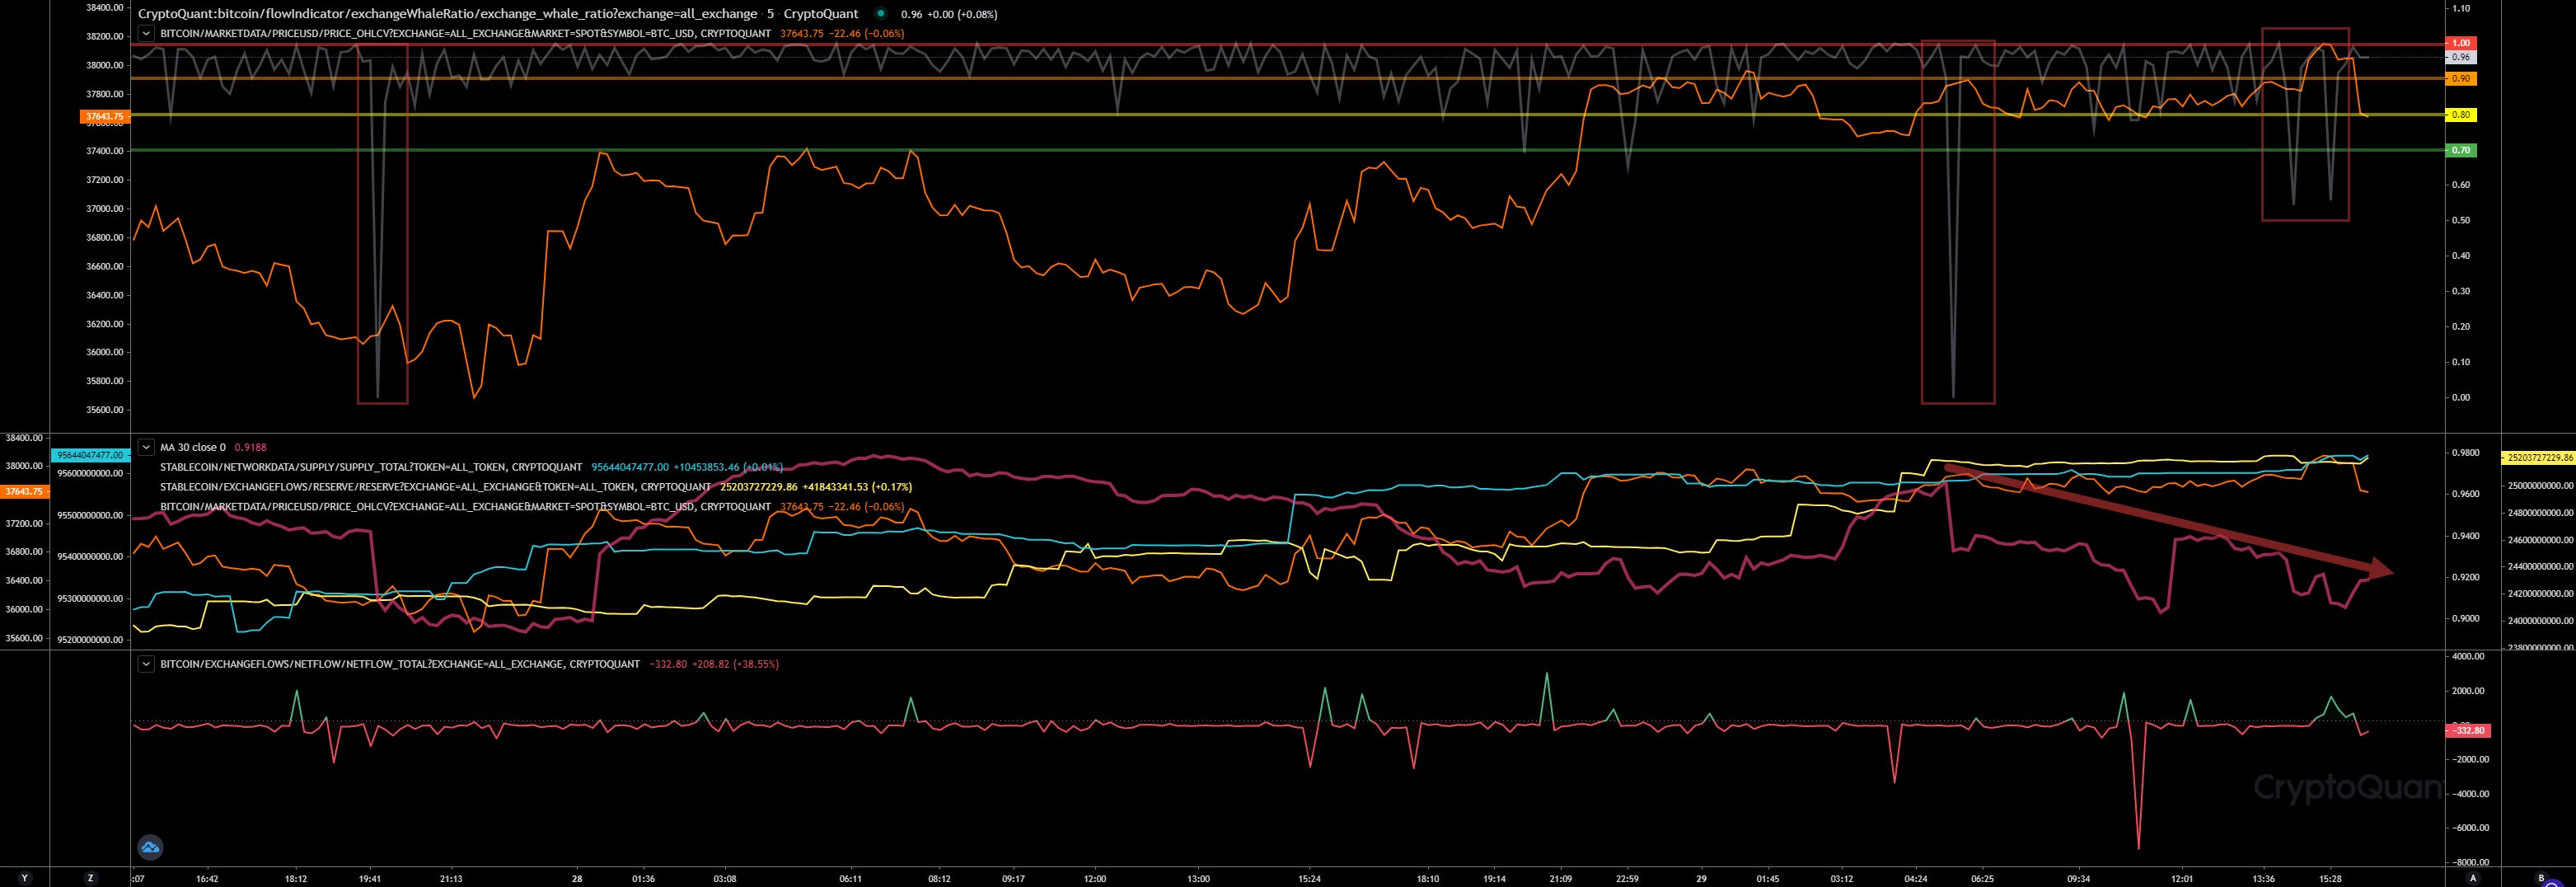
Also here if we zoom in, we can see how the whales ratio correlates with the price action. The hourly view is for us more interesting to predict a trend in price action for the next coming hours.
URL to chart: https://cryptoquant.com/prochart/vYNO3z1cx9LcSvg
Exchange Inflows
Hourly View
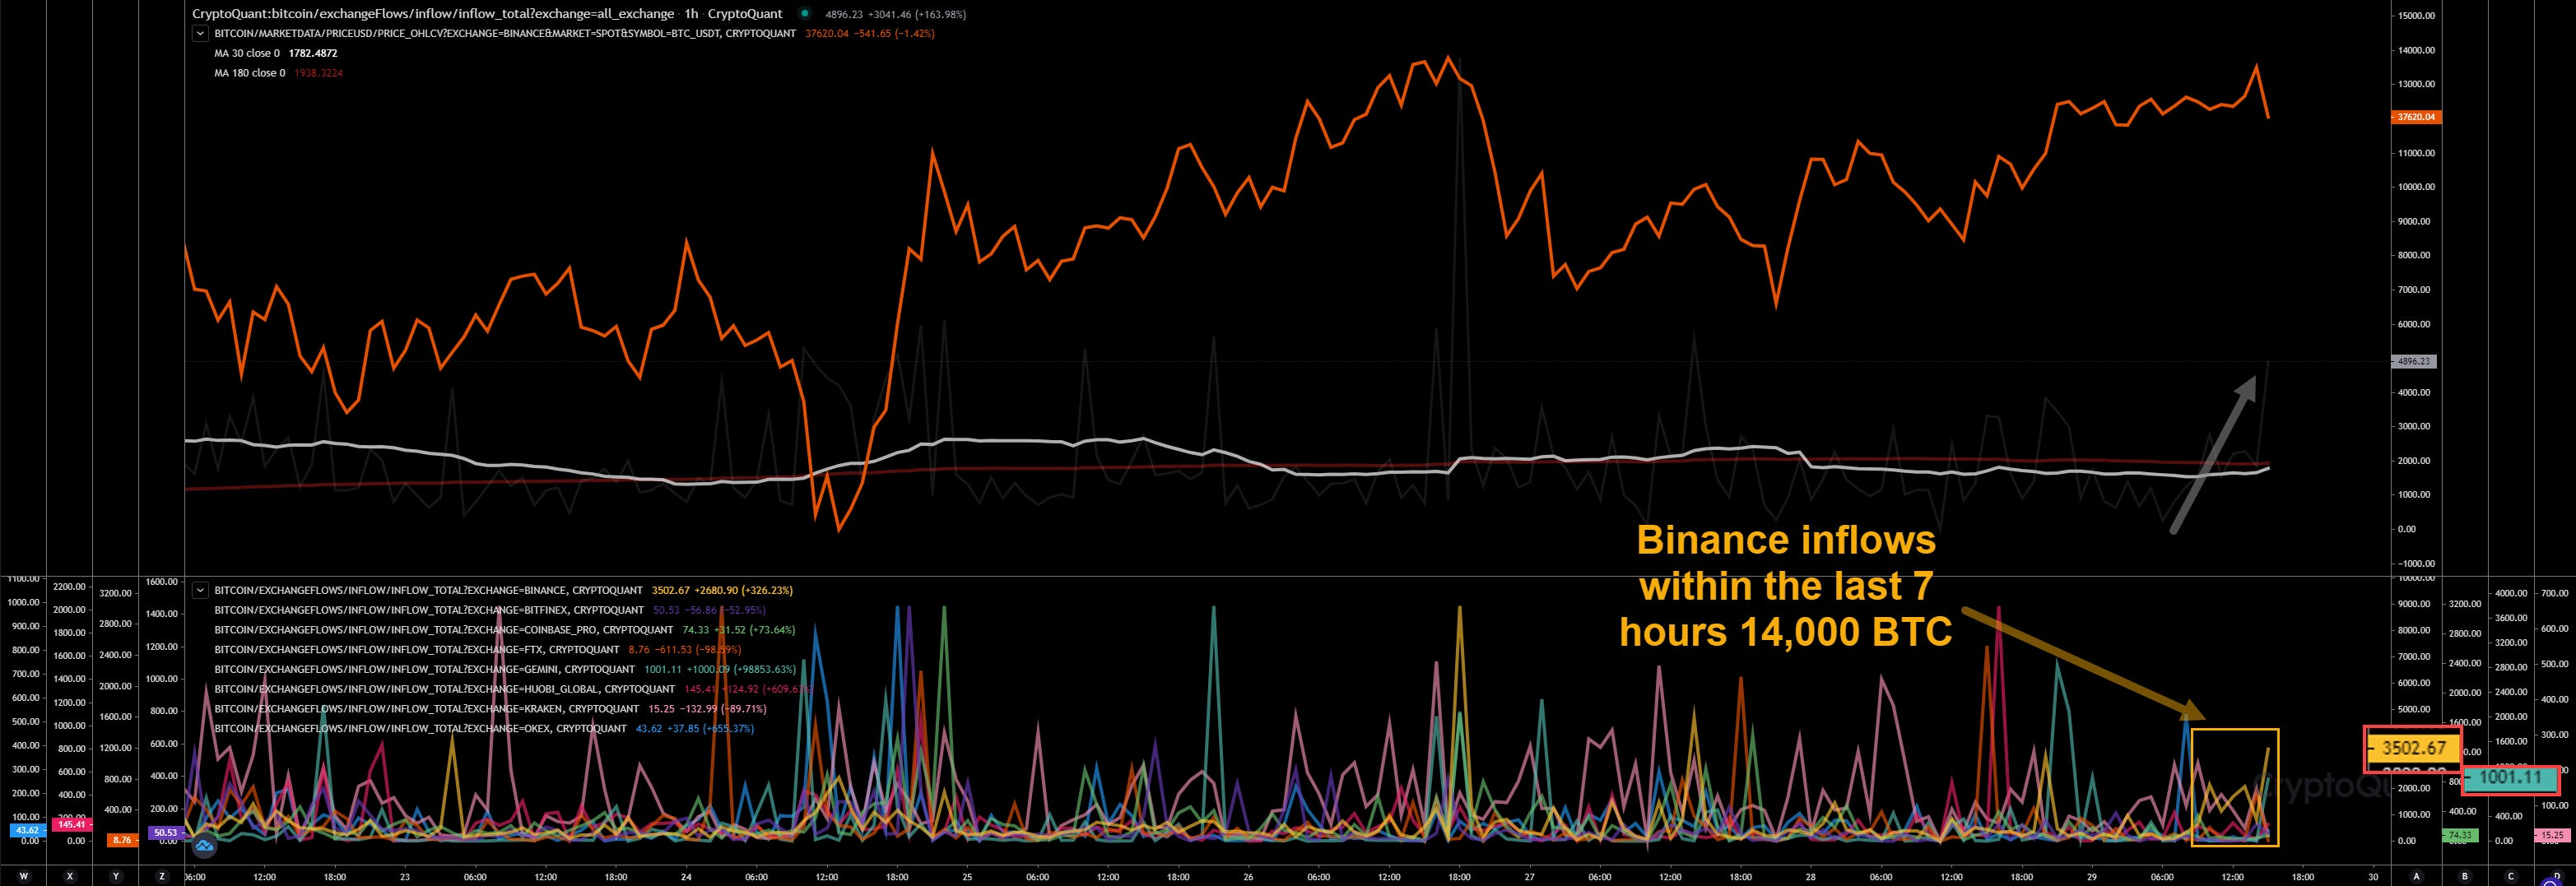
Our hourly view indicating a rising inflow showing more than 15,000 BTC reaching exchanges. The main part is generating Binance with almost 14,000 BTC and Gemini with 1,000 BTC. Looks like dump preparation. Would match with whales ratio. Lift up (or even pump) to sell the way up and dump afterwards after our resistance retest.
URL to chart: https://cryptoquant.com/prochart/O3opncepjPqfqIb
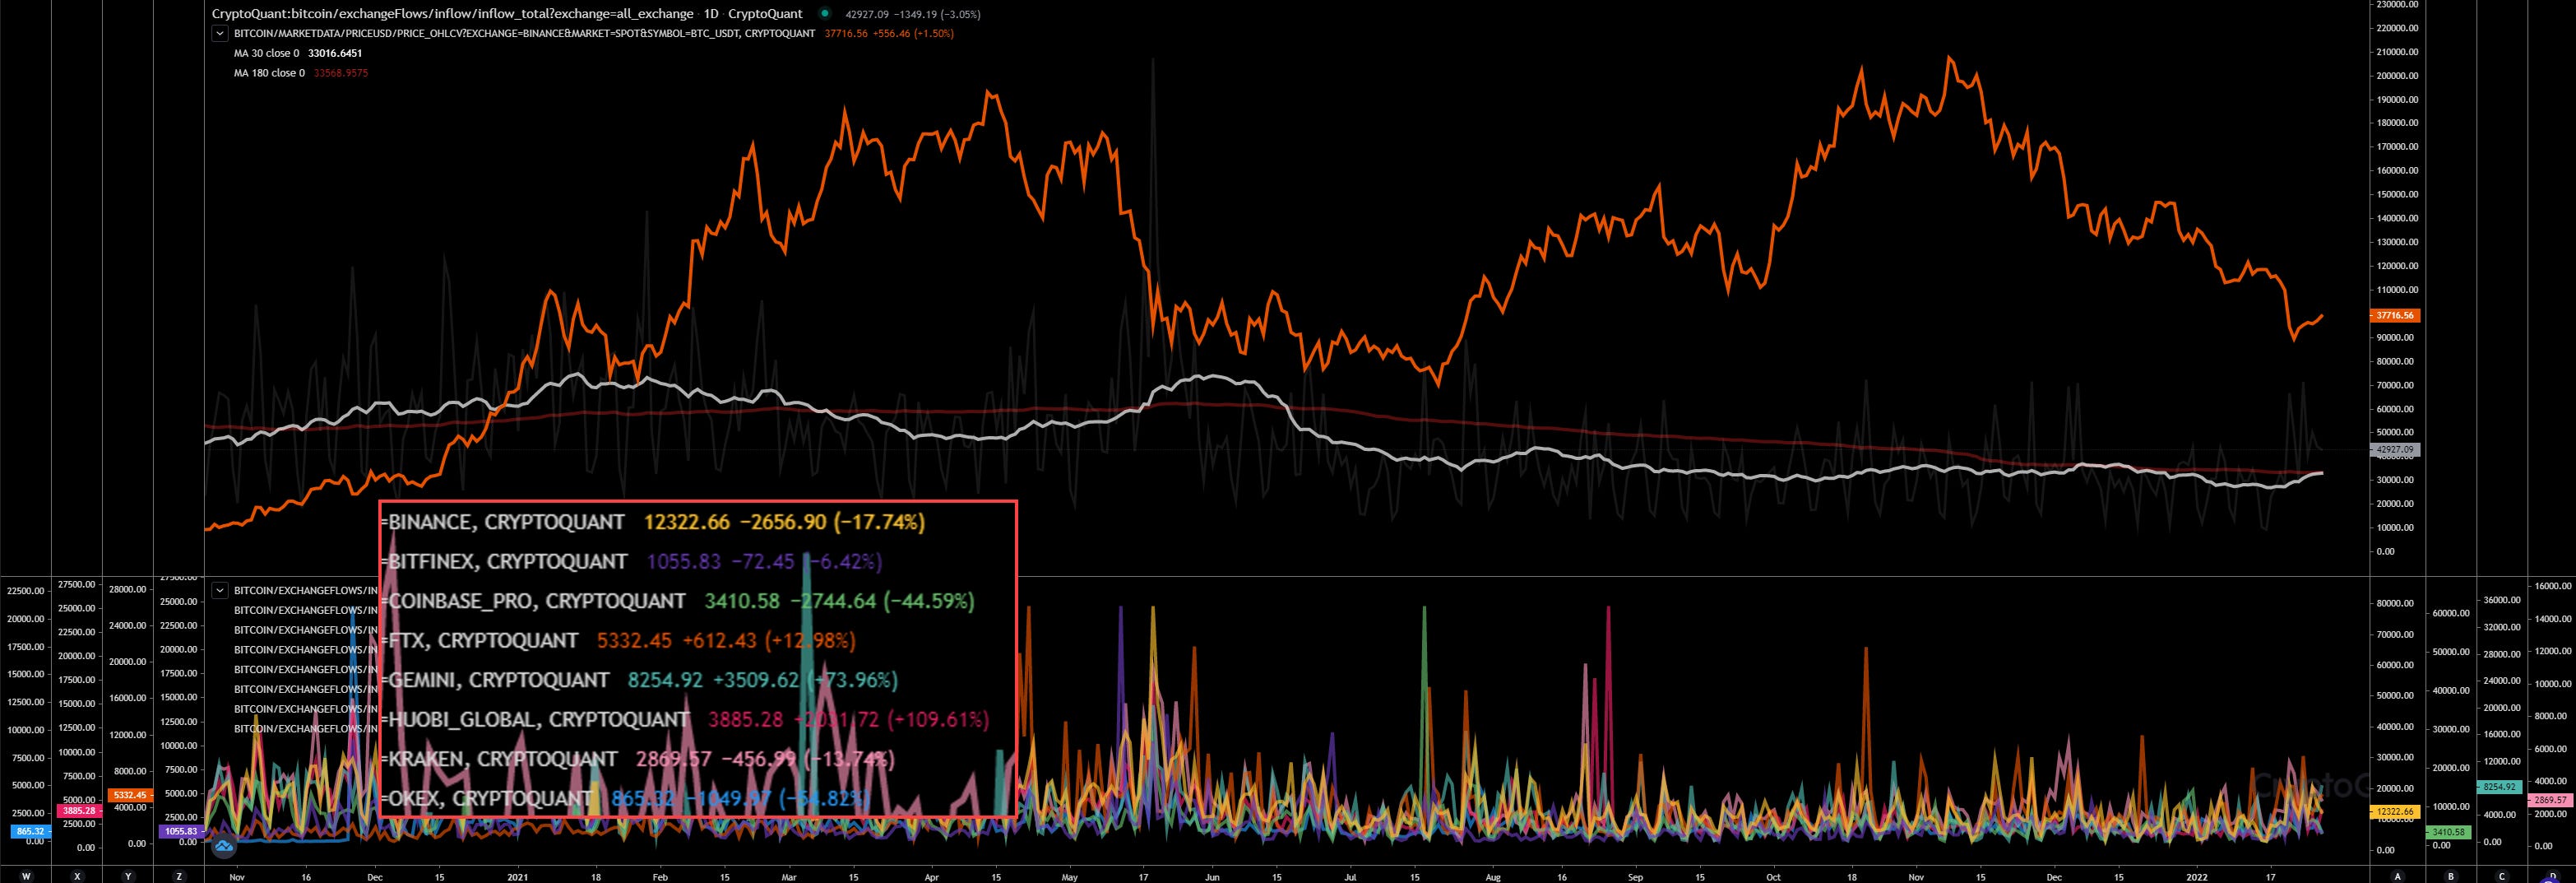
Daily View
If you check the inflows from the last few days you know, we are not done here. We are receiving more inflows per day than the weeks before. That doesn’t look like we have reached our bottom already. But we need to see.
URL to chart: https://cryptoquant.com/prochart/O3opncepjPqfqIb
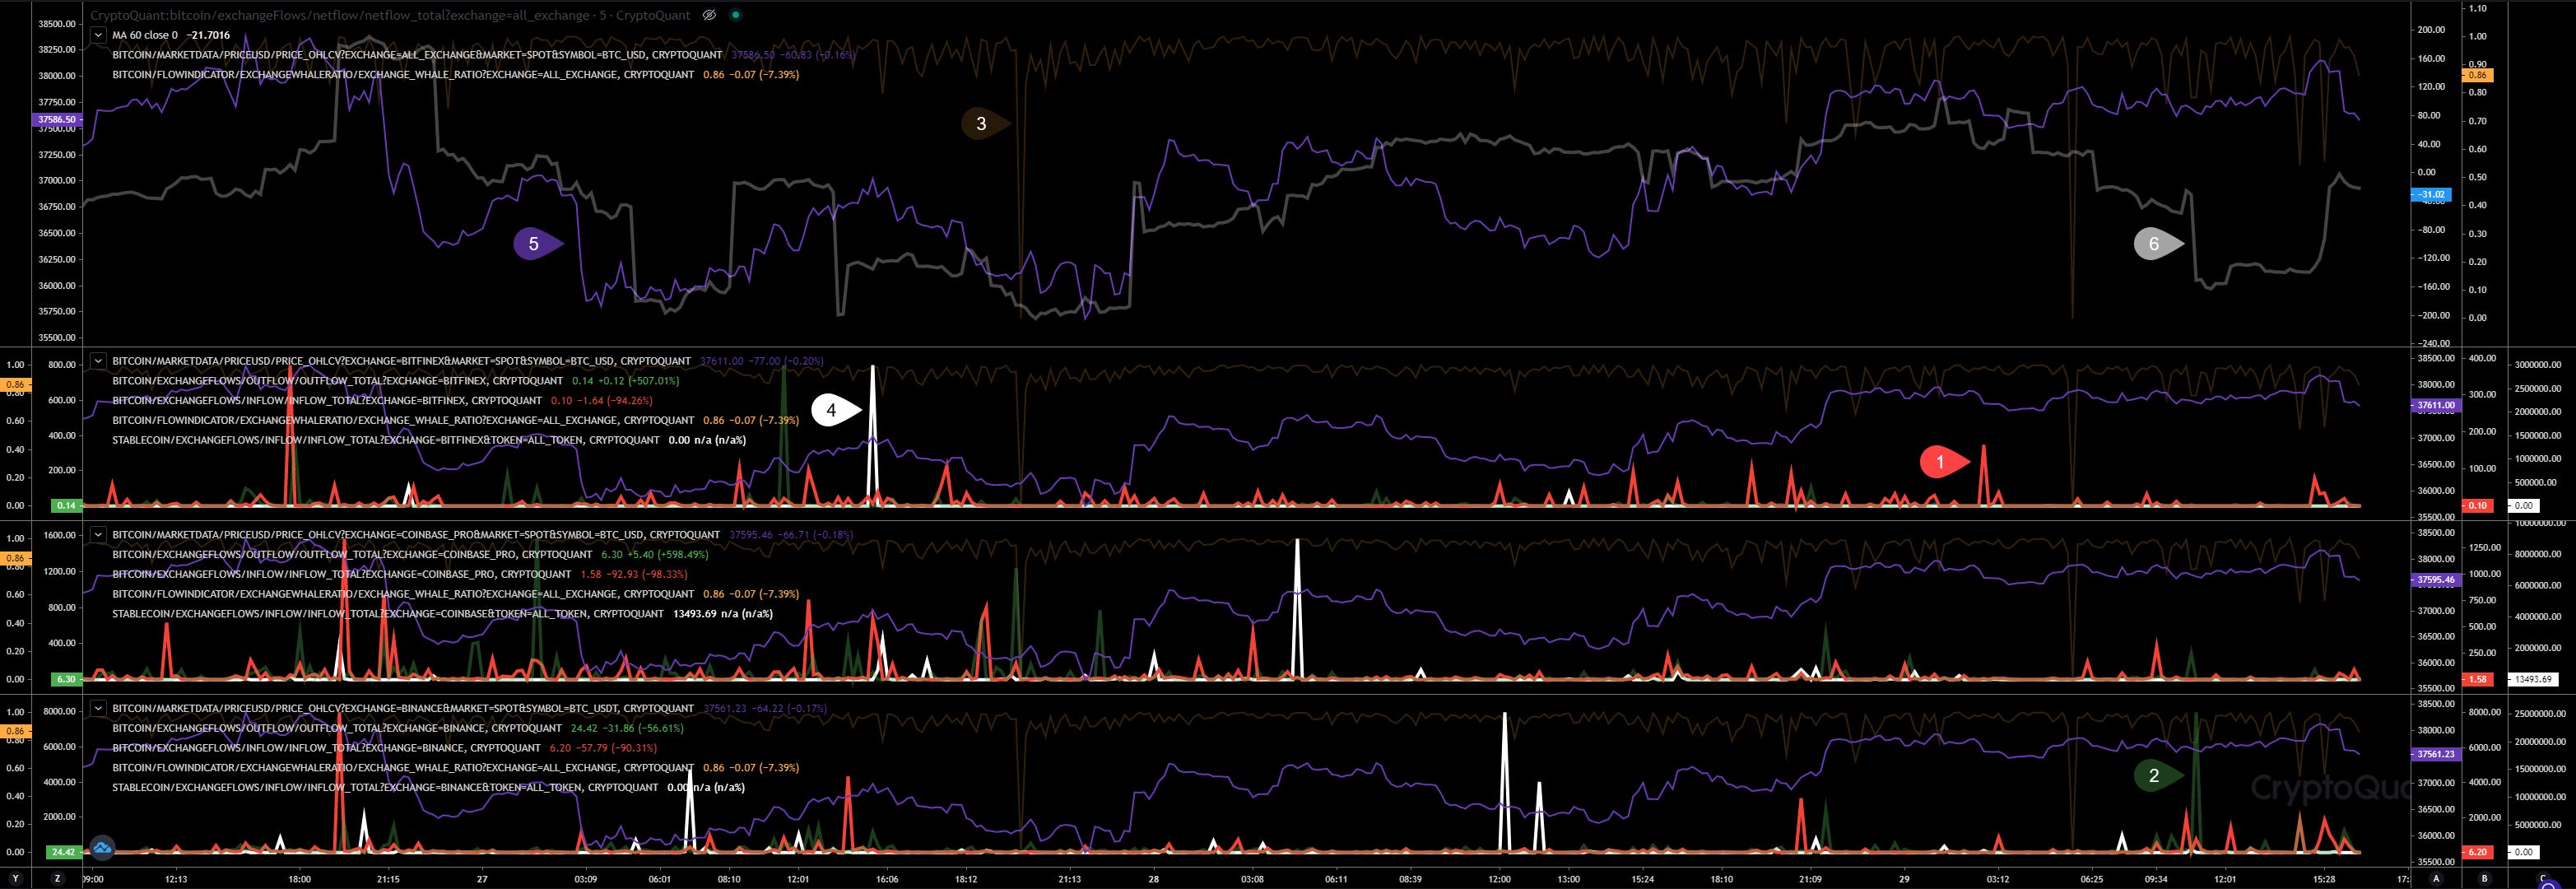
Exchange Activities
#1 Inflow
#2 Outflow
#3 Whales Ratio
#4 Stablecoin Inflow
#5 BTC Price in USD
#6 Total Netflow
URL to chart: https://cryptoquant.com/prochart/5orKIwFerljHvhr
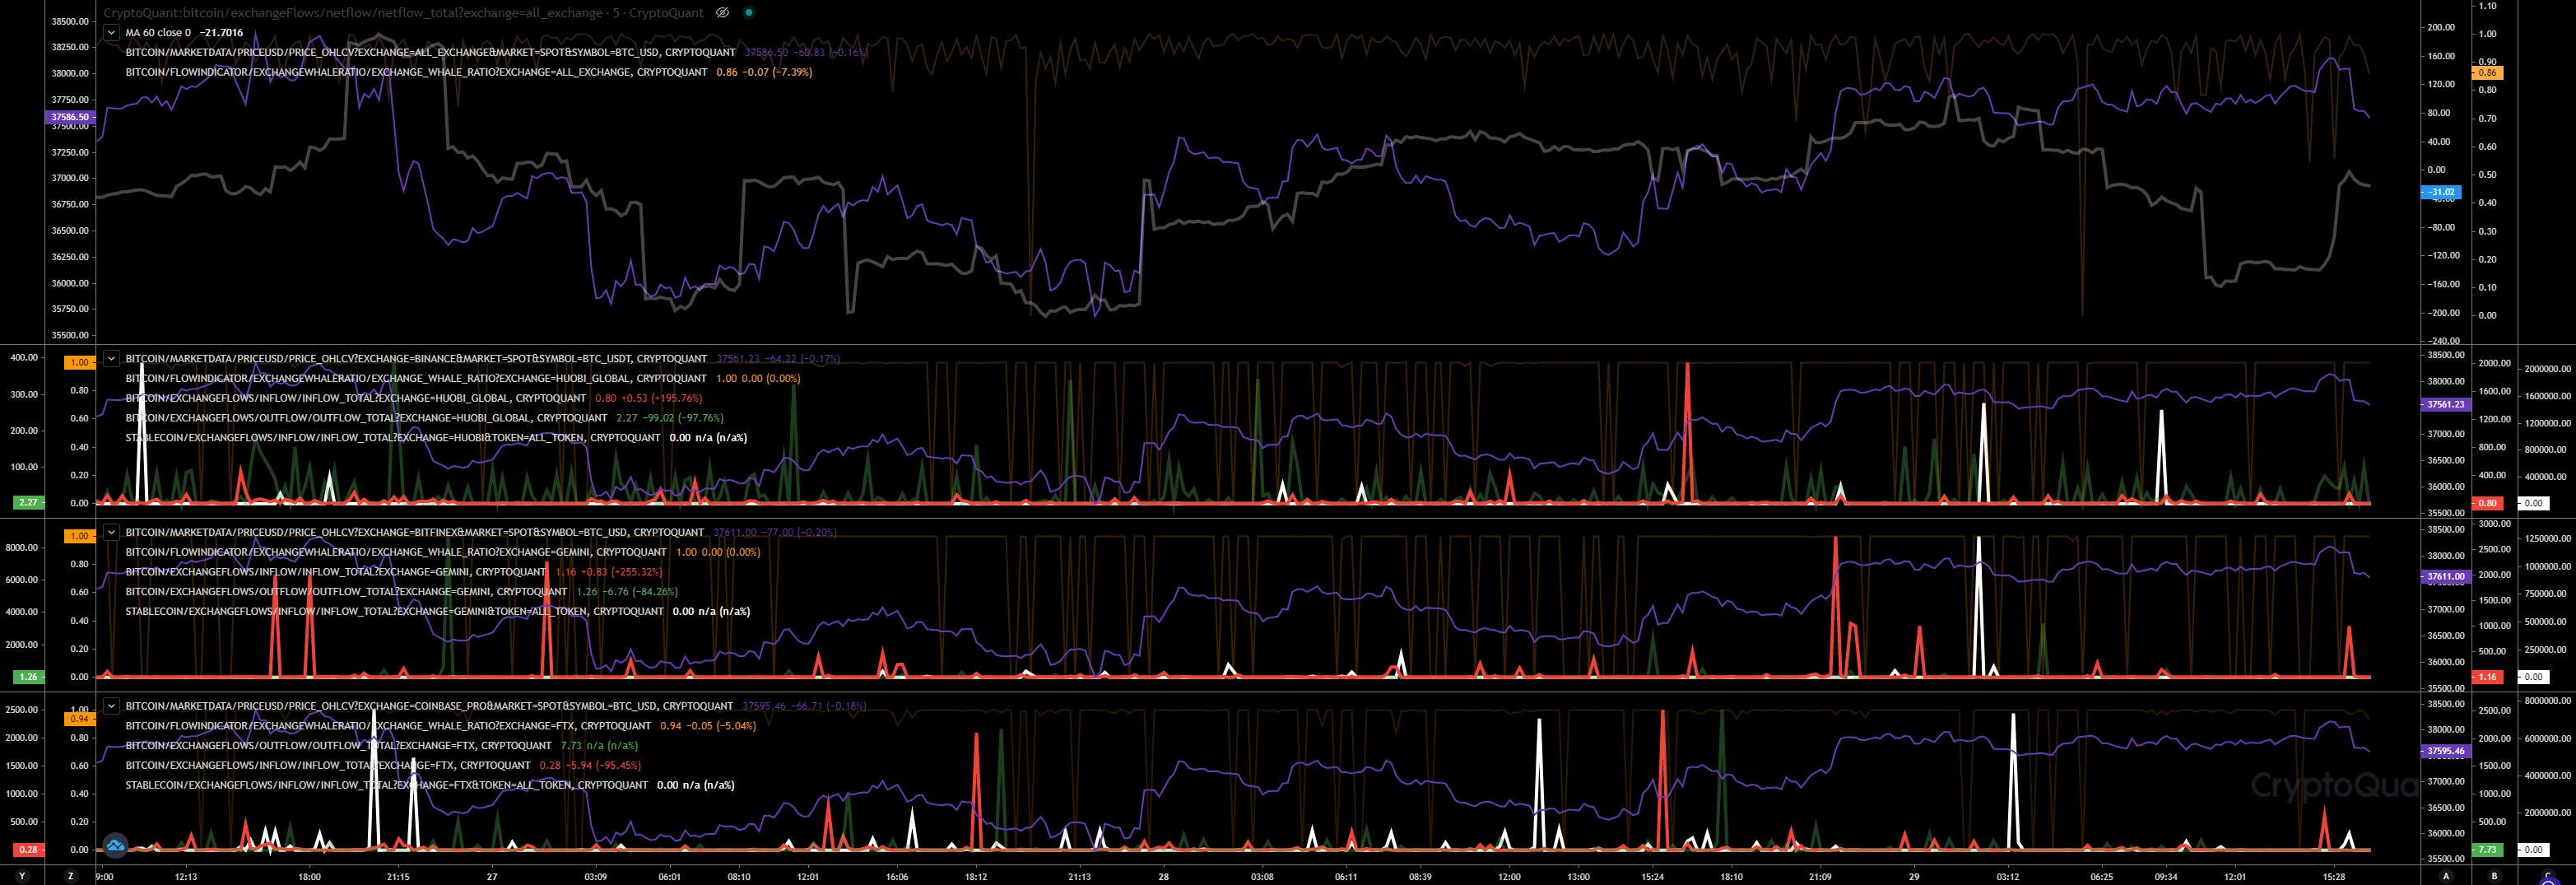
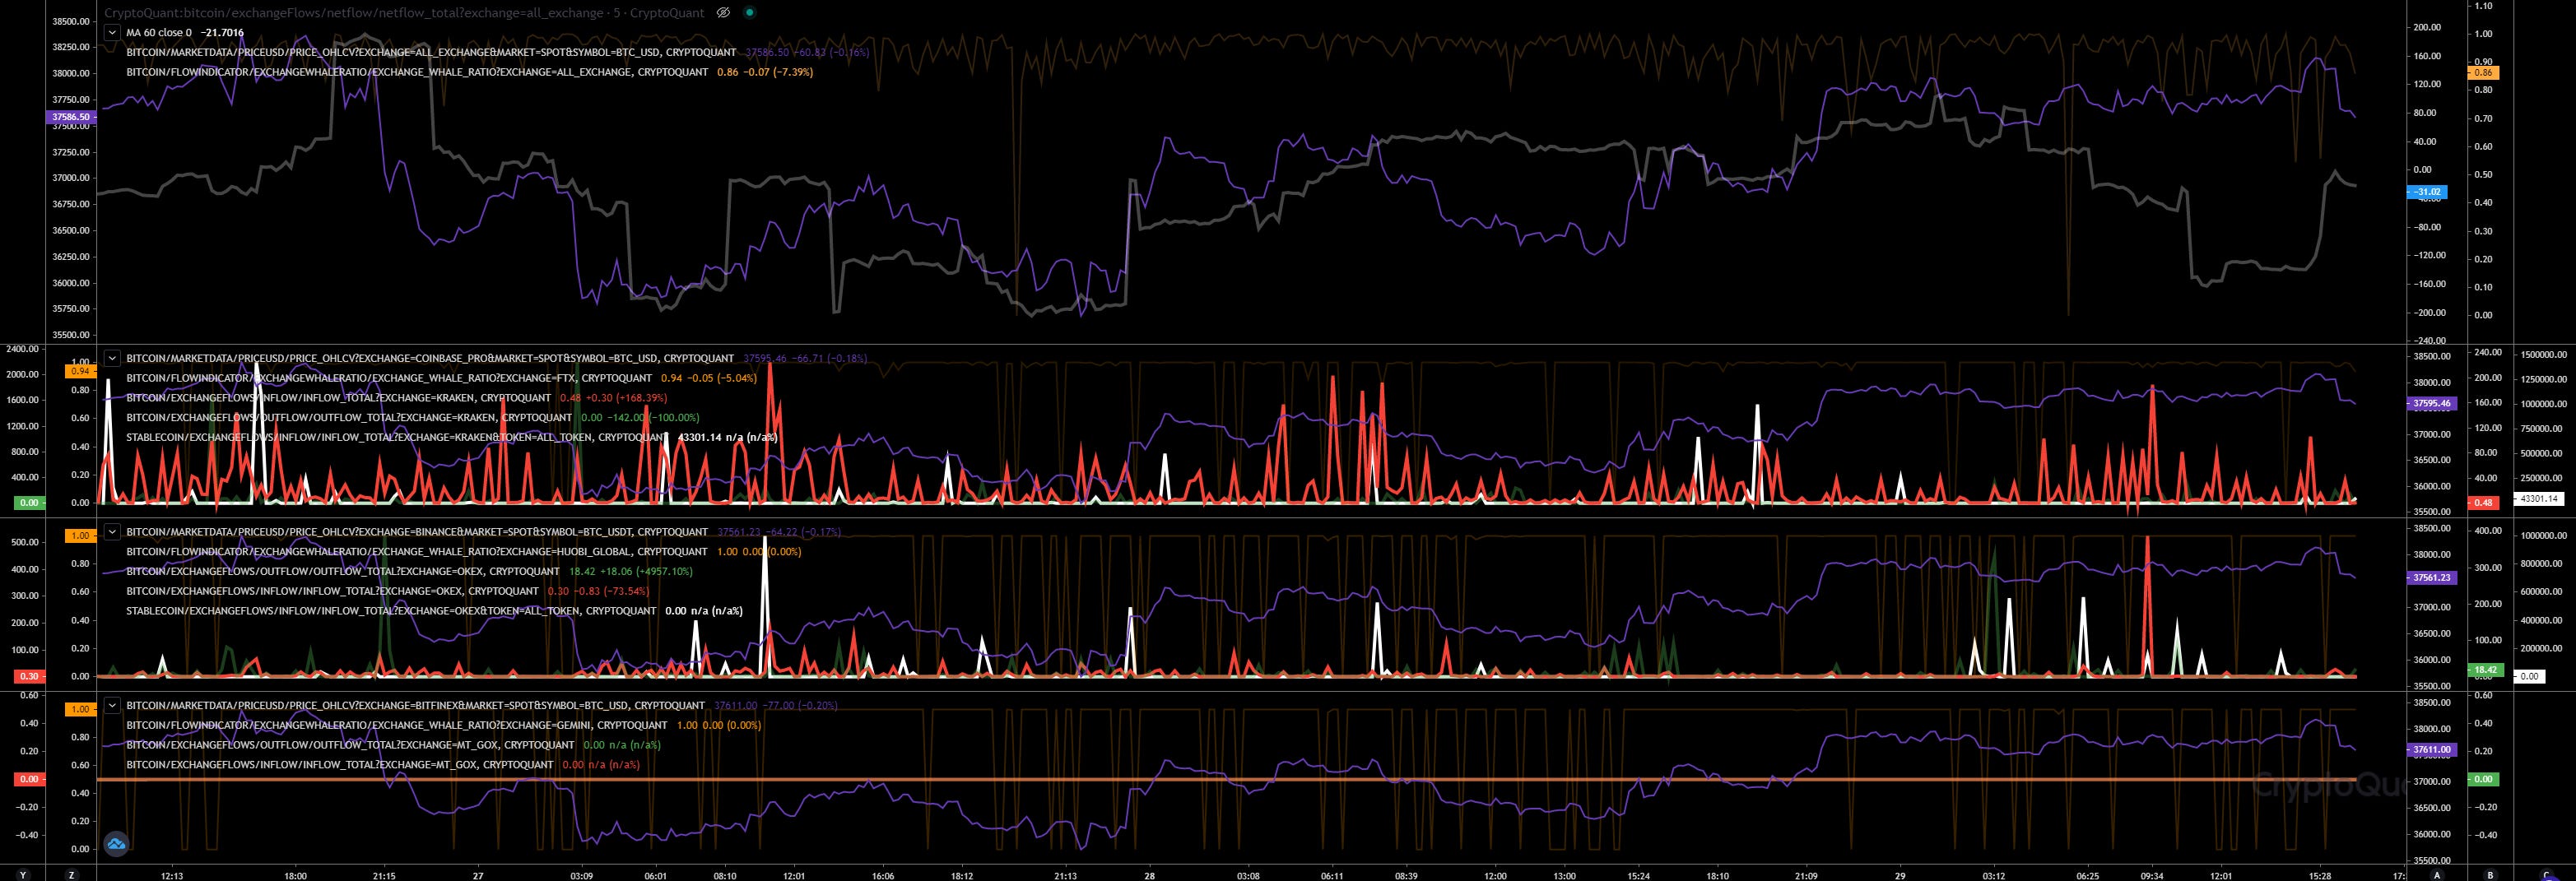
Binance again the leading in inflows, but this time also showing a big outflow. I will check this outflow and tweet later on. That outflow was really big, almost 8,000 BTC.
Gemini was very active yesterday, receiving more and more big inflows, since an hour ago they stopped. We have received another 1,000 BTC on Gemini an hour ago.Huobi again showing more outflows and FTX almost flat.
Kraken keeps very active, but with low volume. Okex just show low activity and low volume.
Future Trading
Daily View
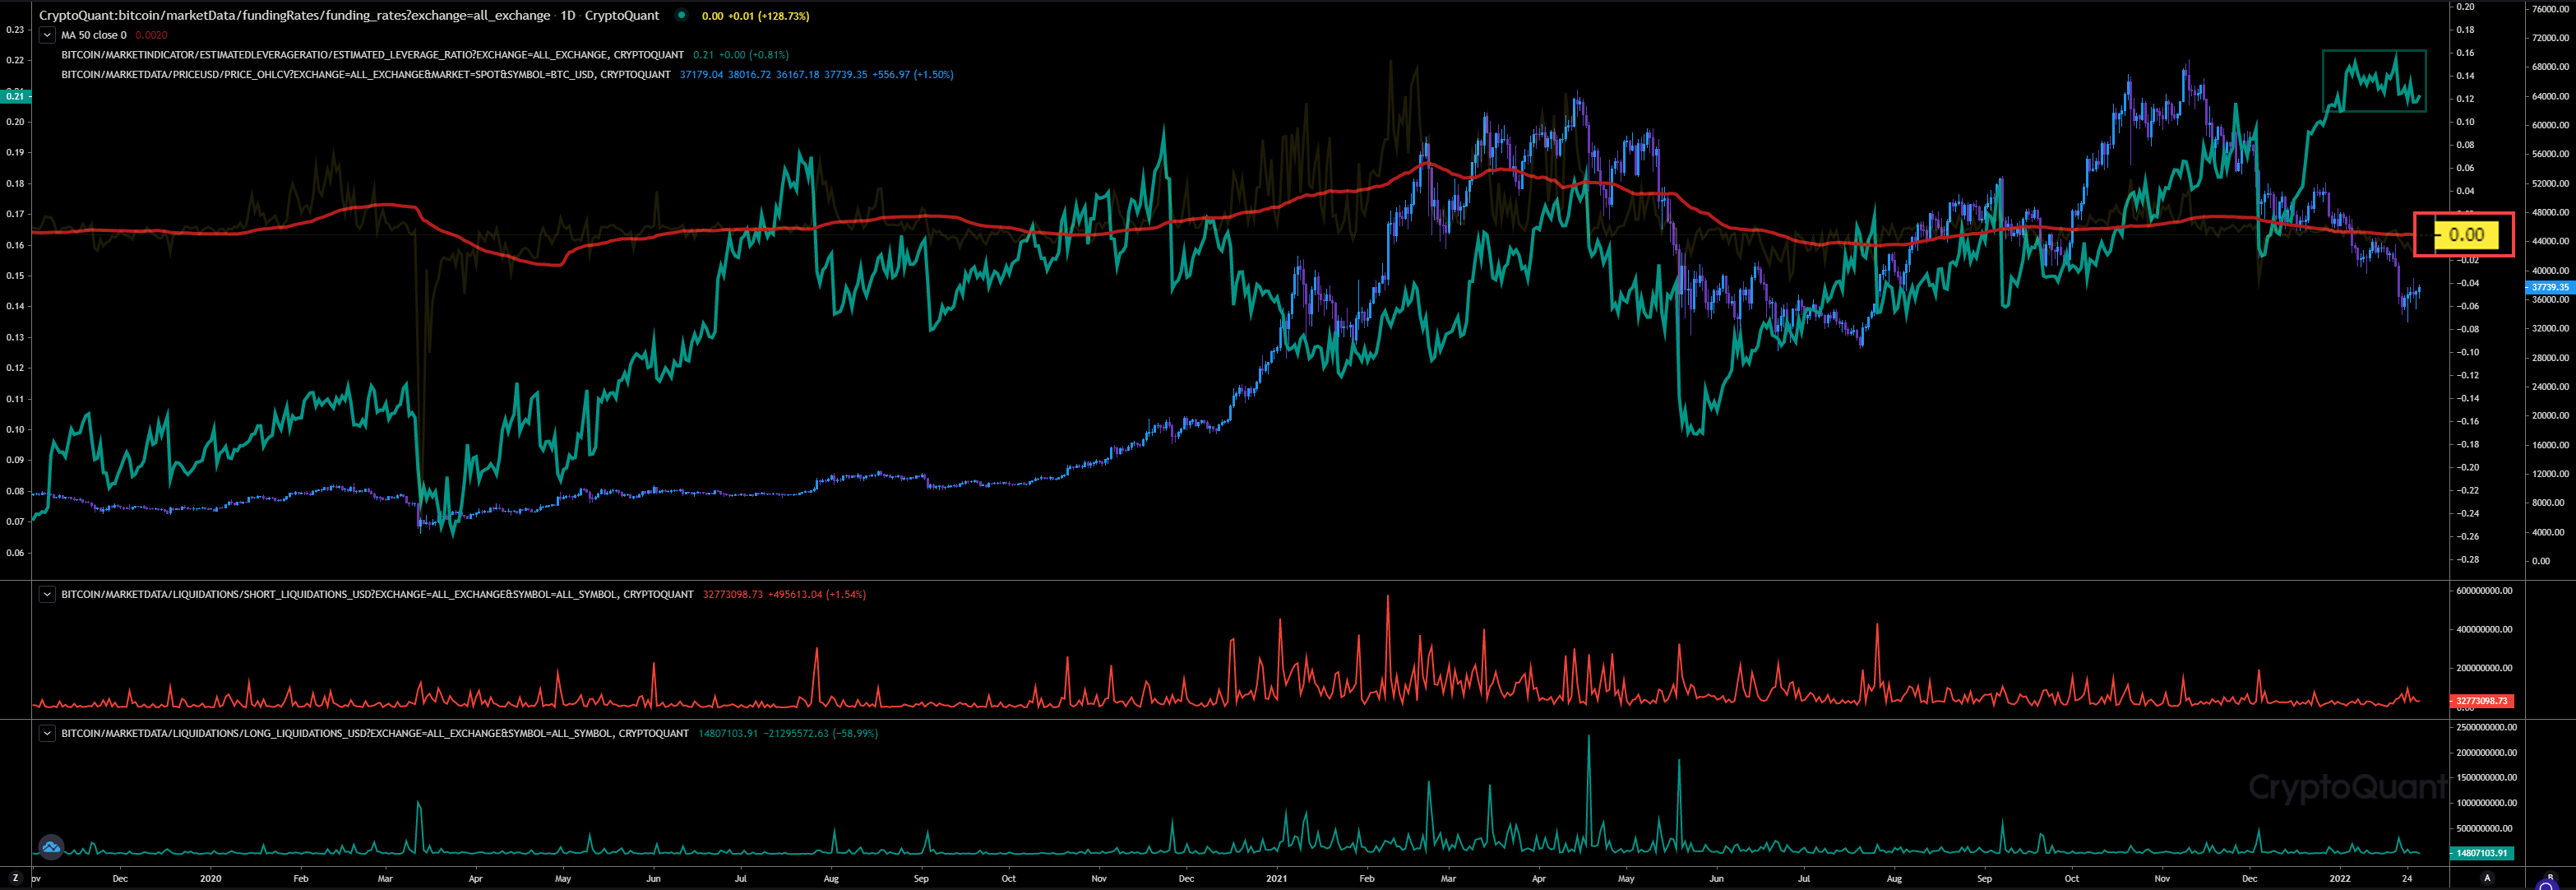
Funding rate since yesterday showing 0.00 indicating shorts and longs demand ratio is balanced. Leverage ratio still too high, but at least not rising anymore.
Today without Option Trading as no big moves happenend since yesterday. Only a big Call trade related to 40k and the low volume 04Feb22 expiry.
URL to chart: https://cryptoquant.com/prochart/h5G7kAg6yAM9hRC
Exchange Walls
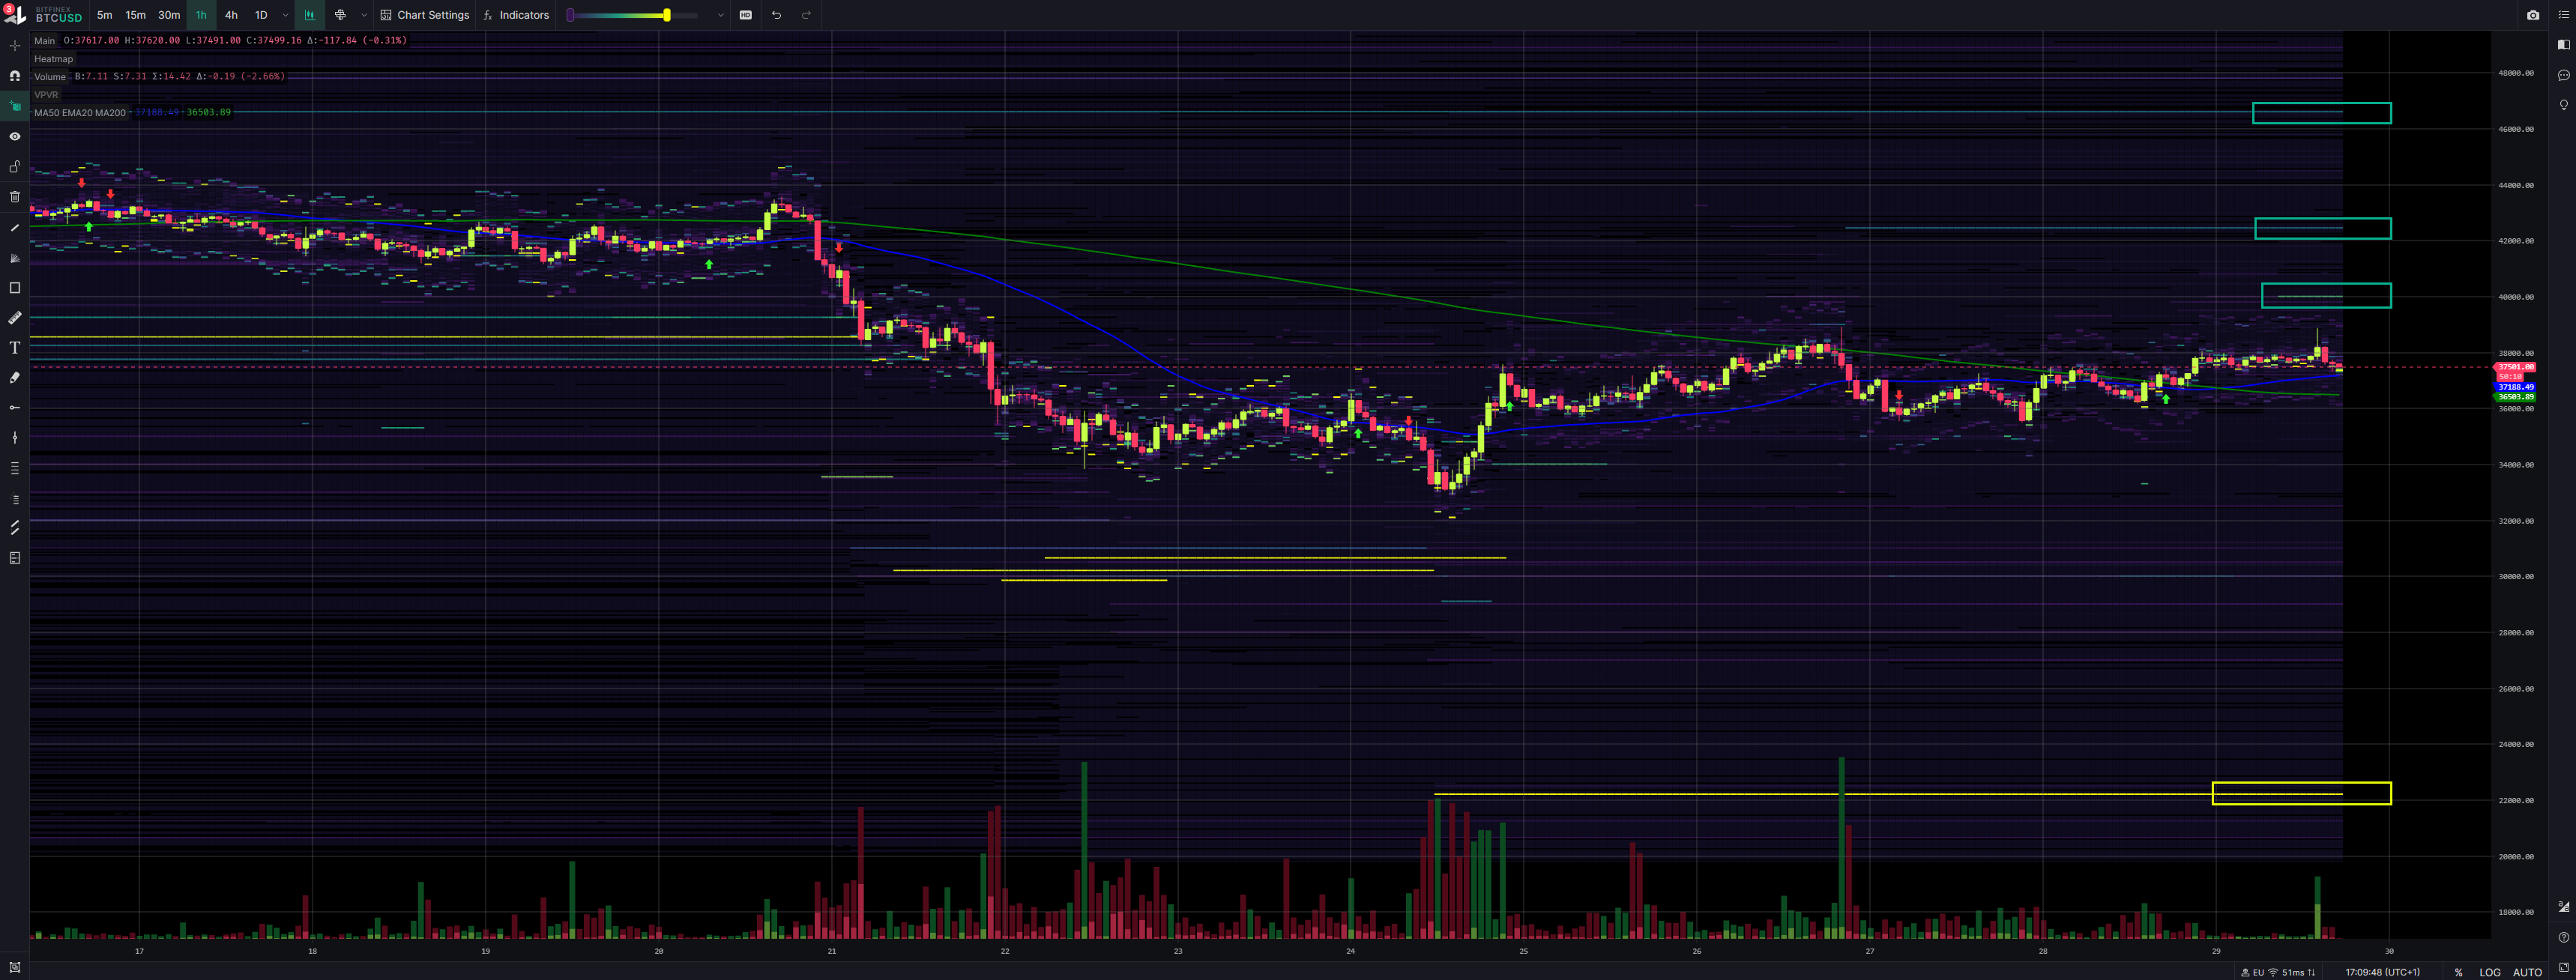
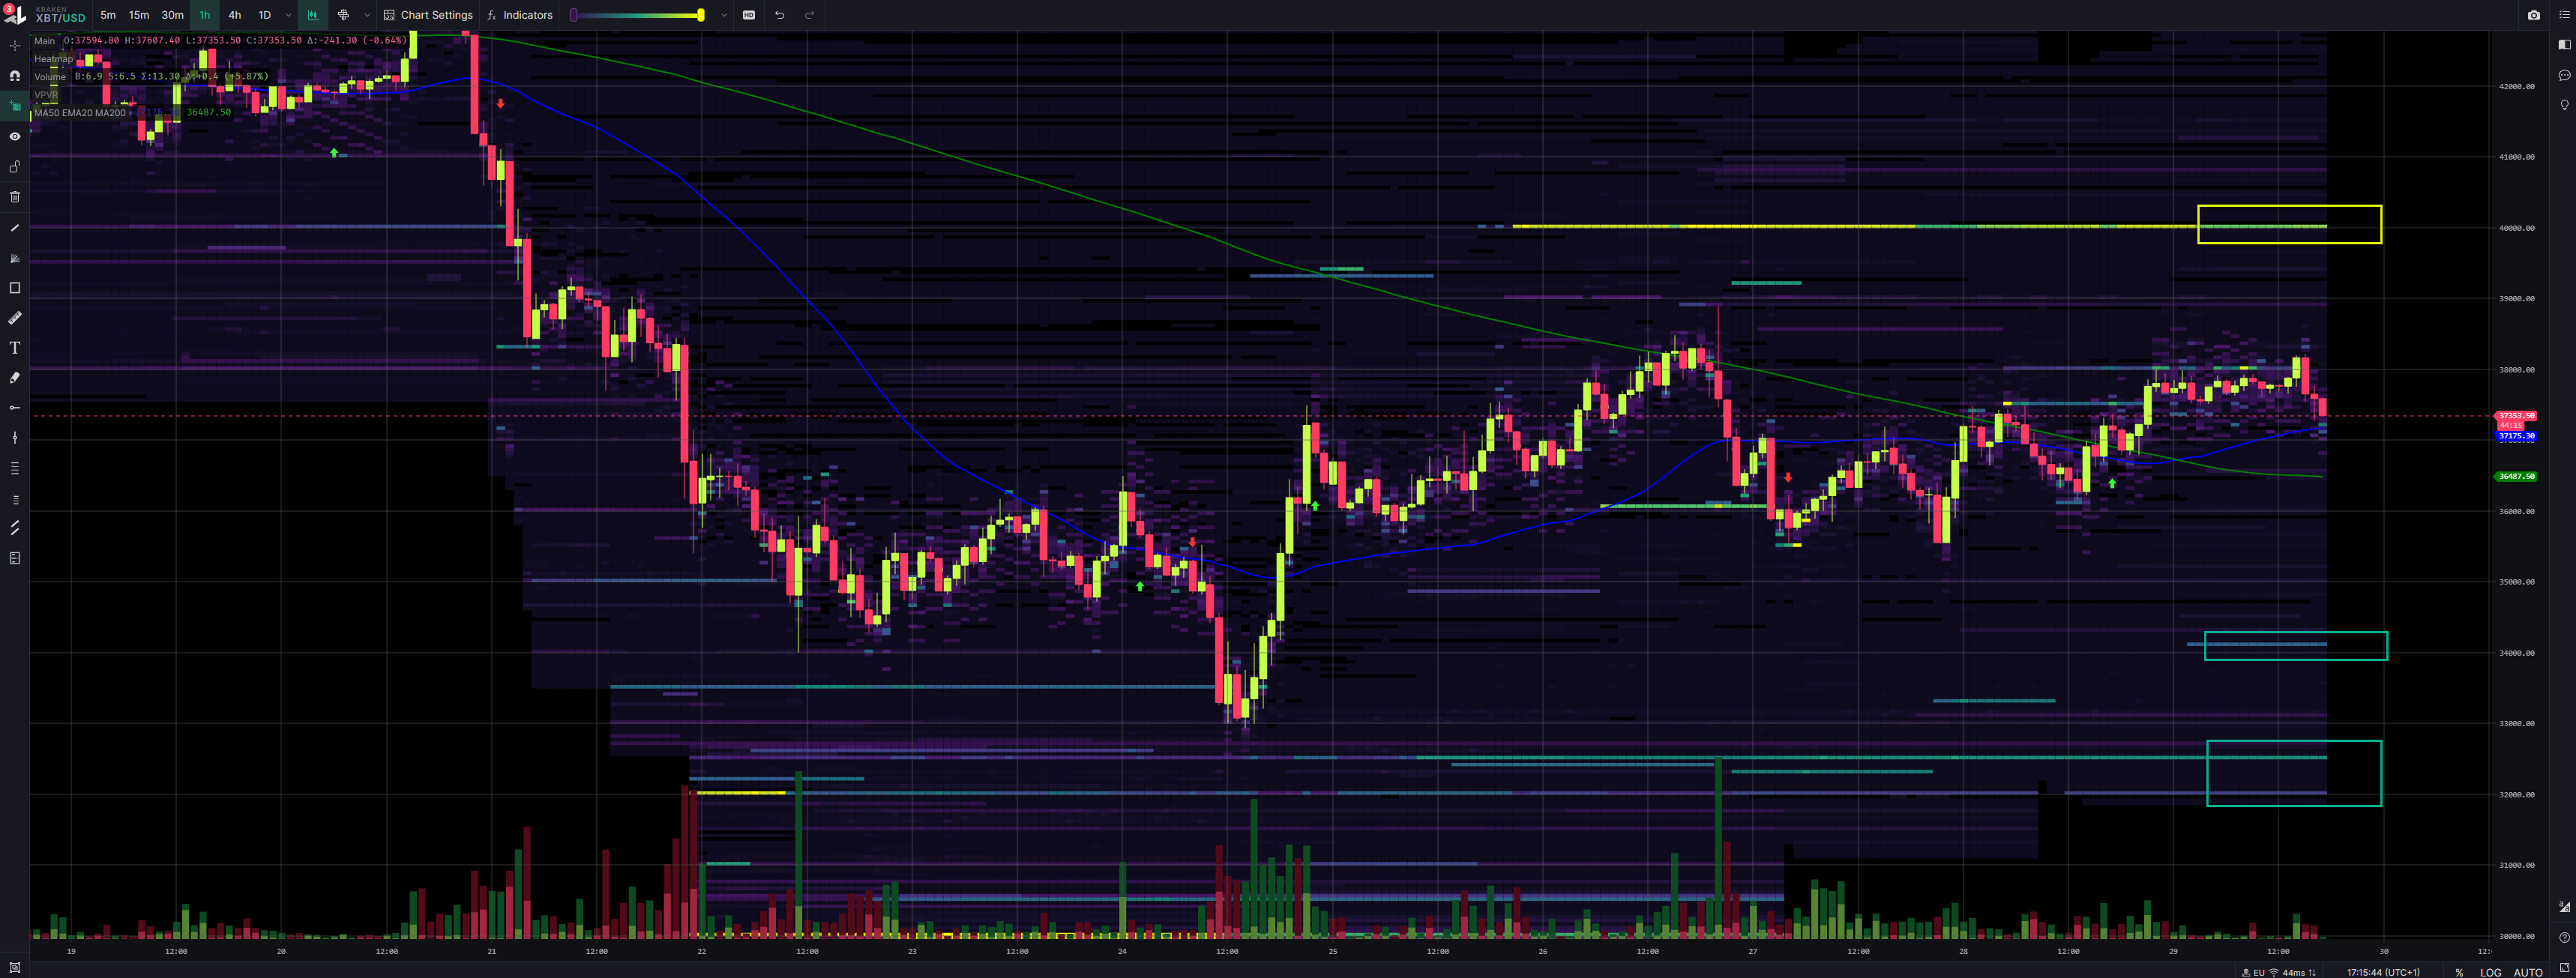
#1 - Bitfinex | Walls: Upper at 40k, Lower at 22.2k
#2 - Coinbase | Walls: Upper at 41k, Lower at 35k
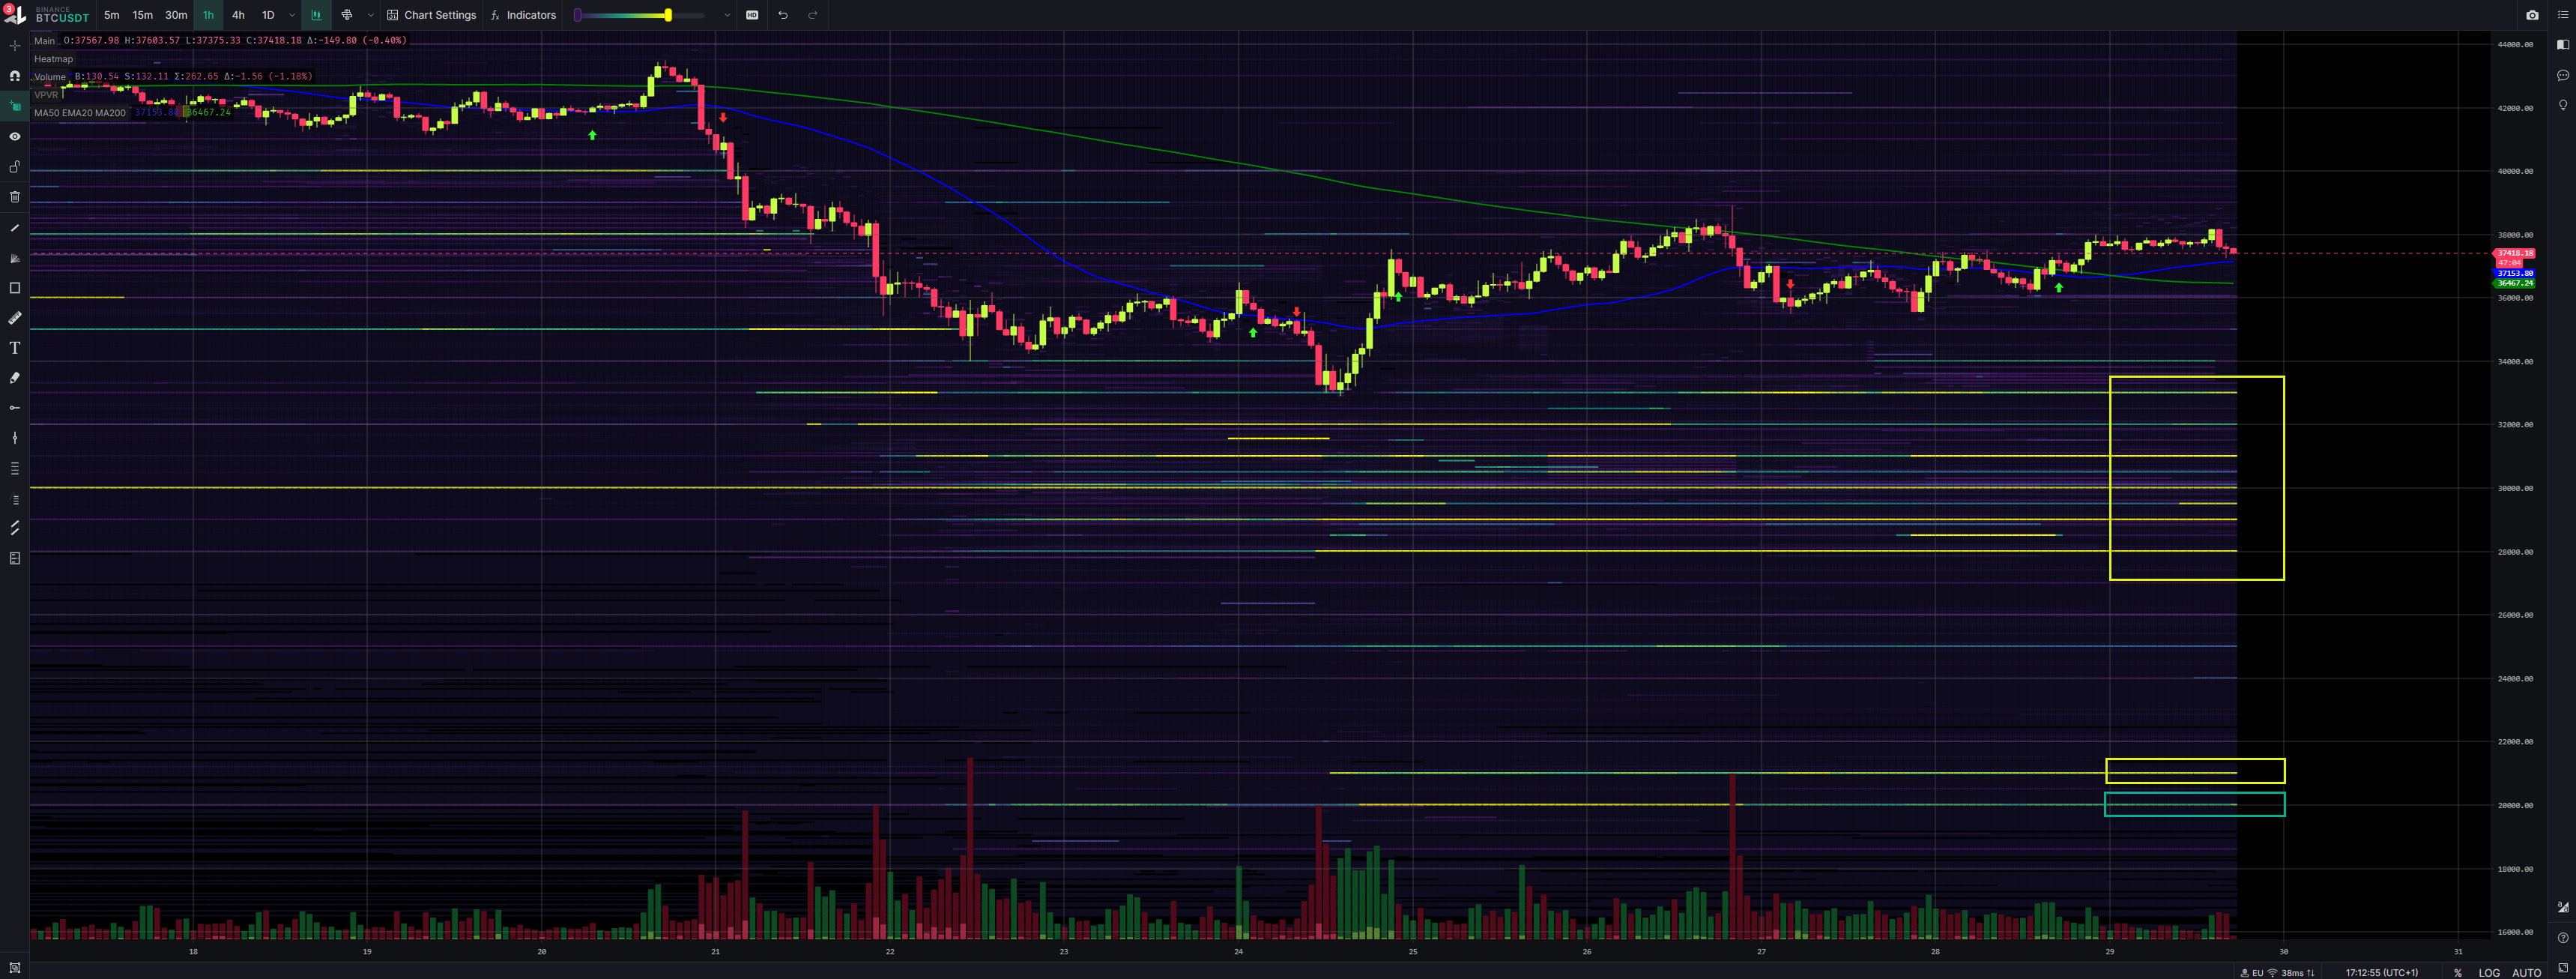
#3 - Binance | Walls: None, Lower at 33k
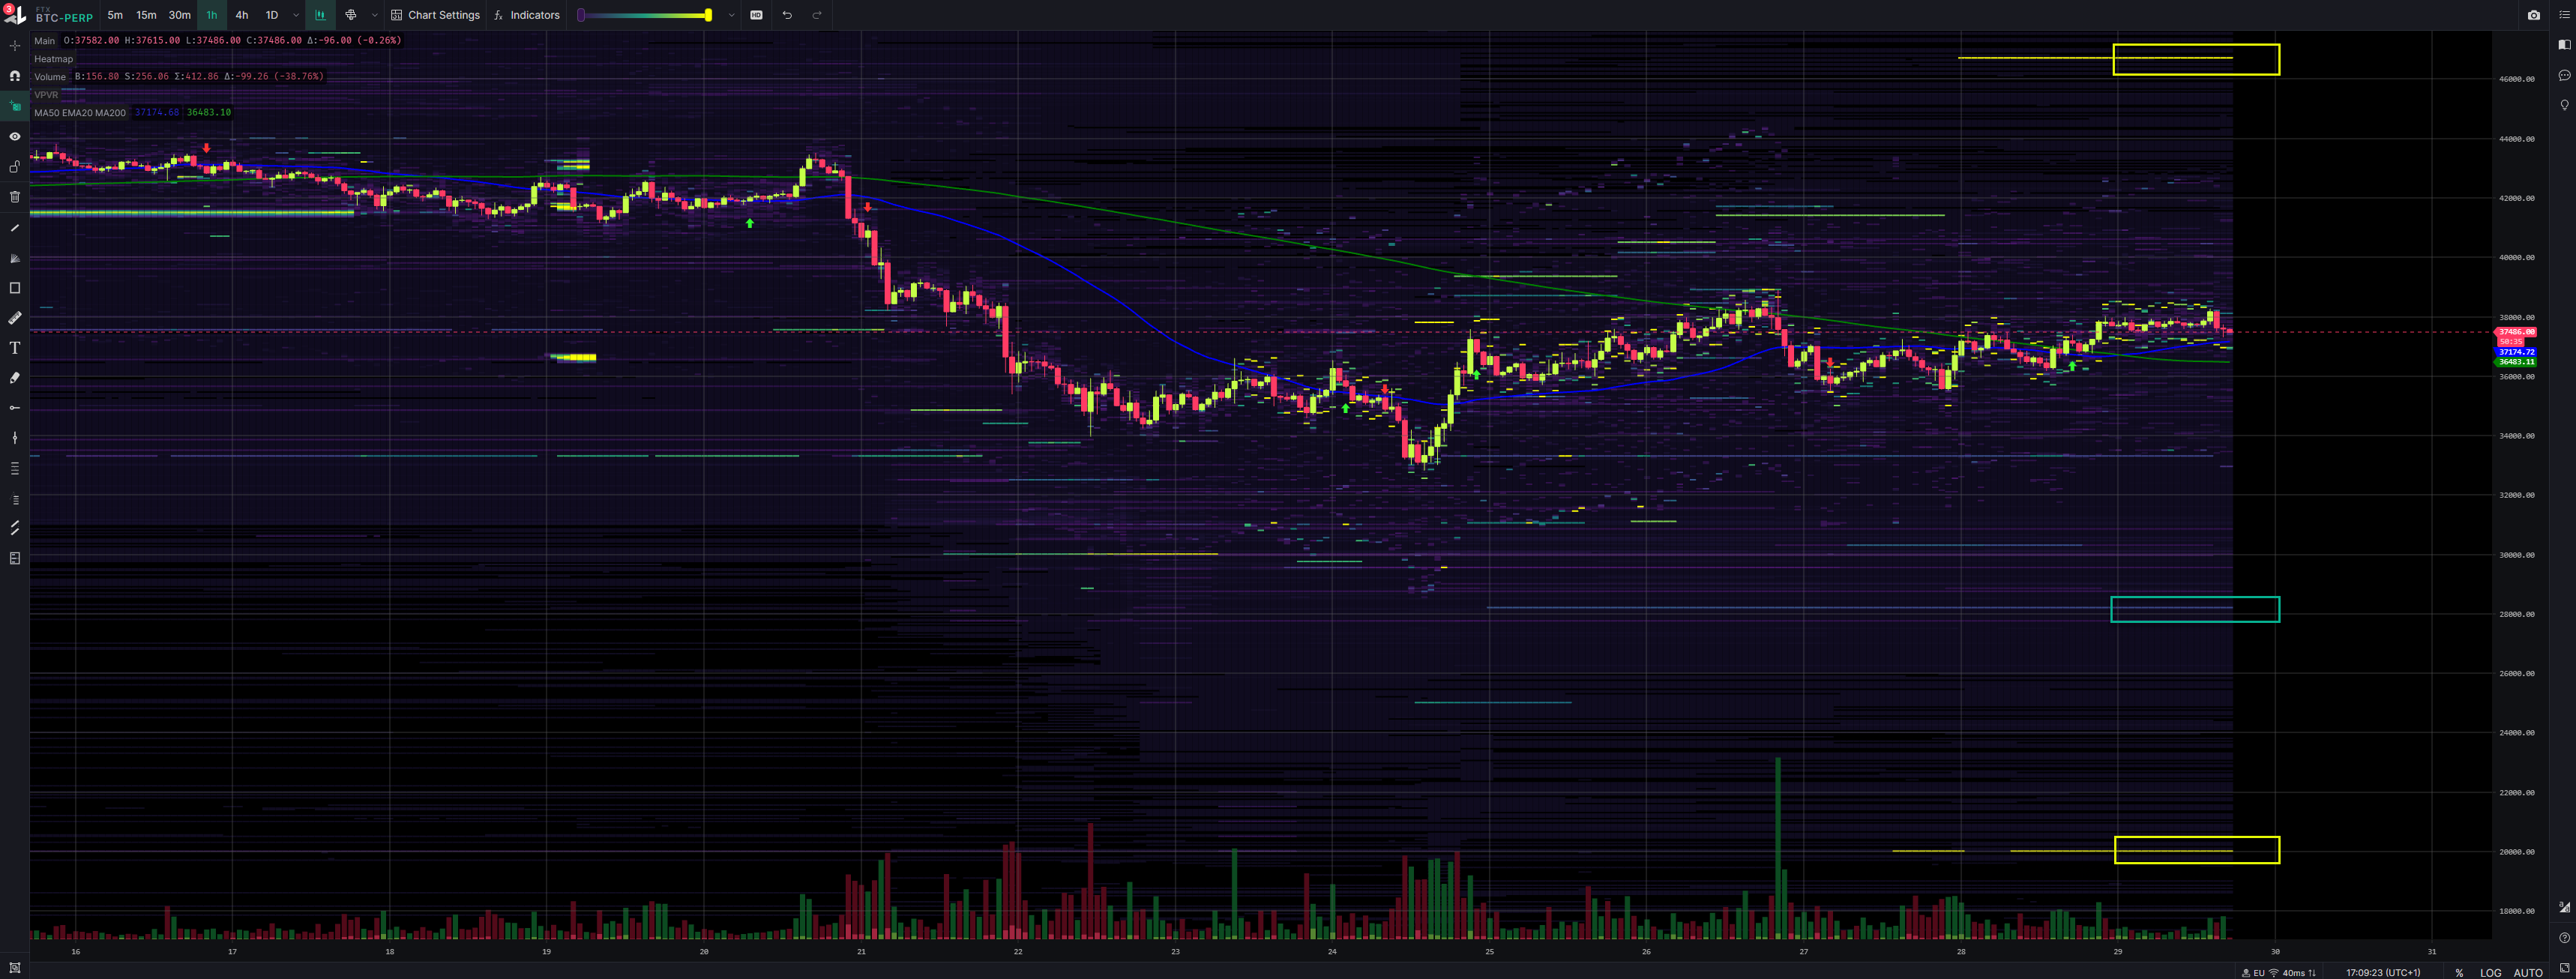
#4 - FTX | Walls: Upper at 46.7k, Lower at 20k
#5 - Kraken | Walls: Upper at 40k, Lower at 34.1k
Inspos Conclusion and personal trade strategy
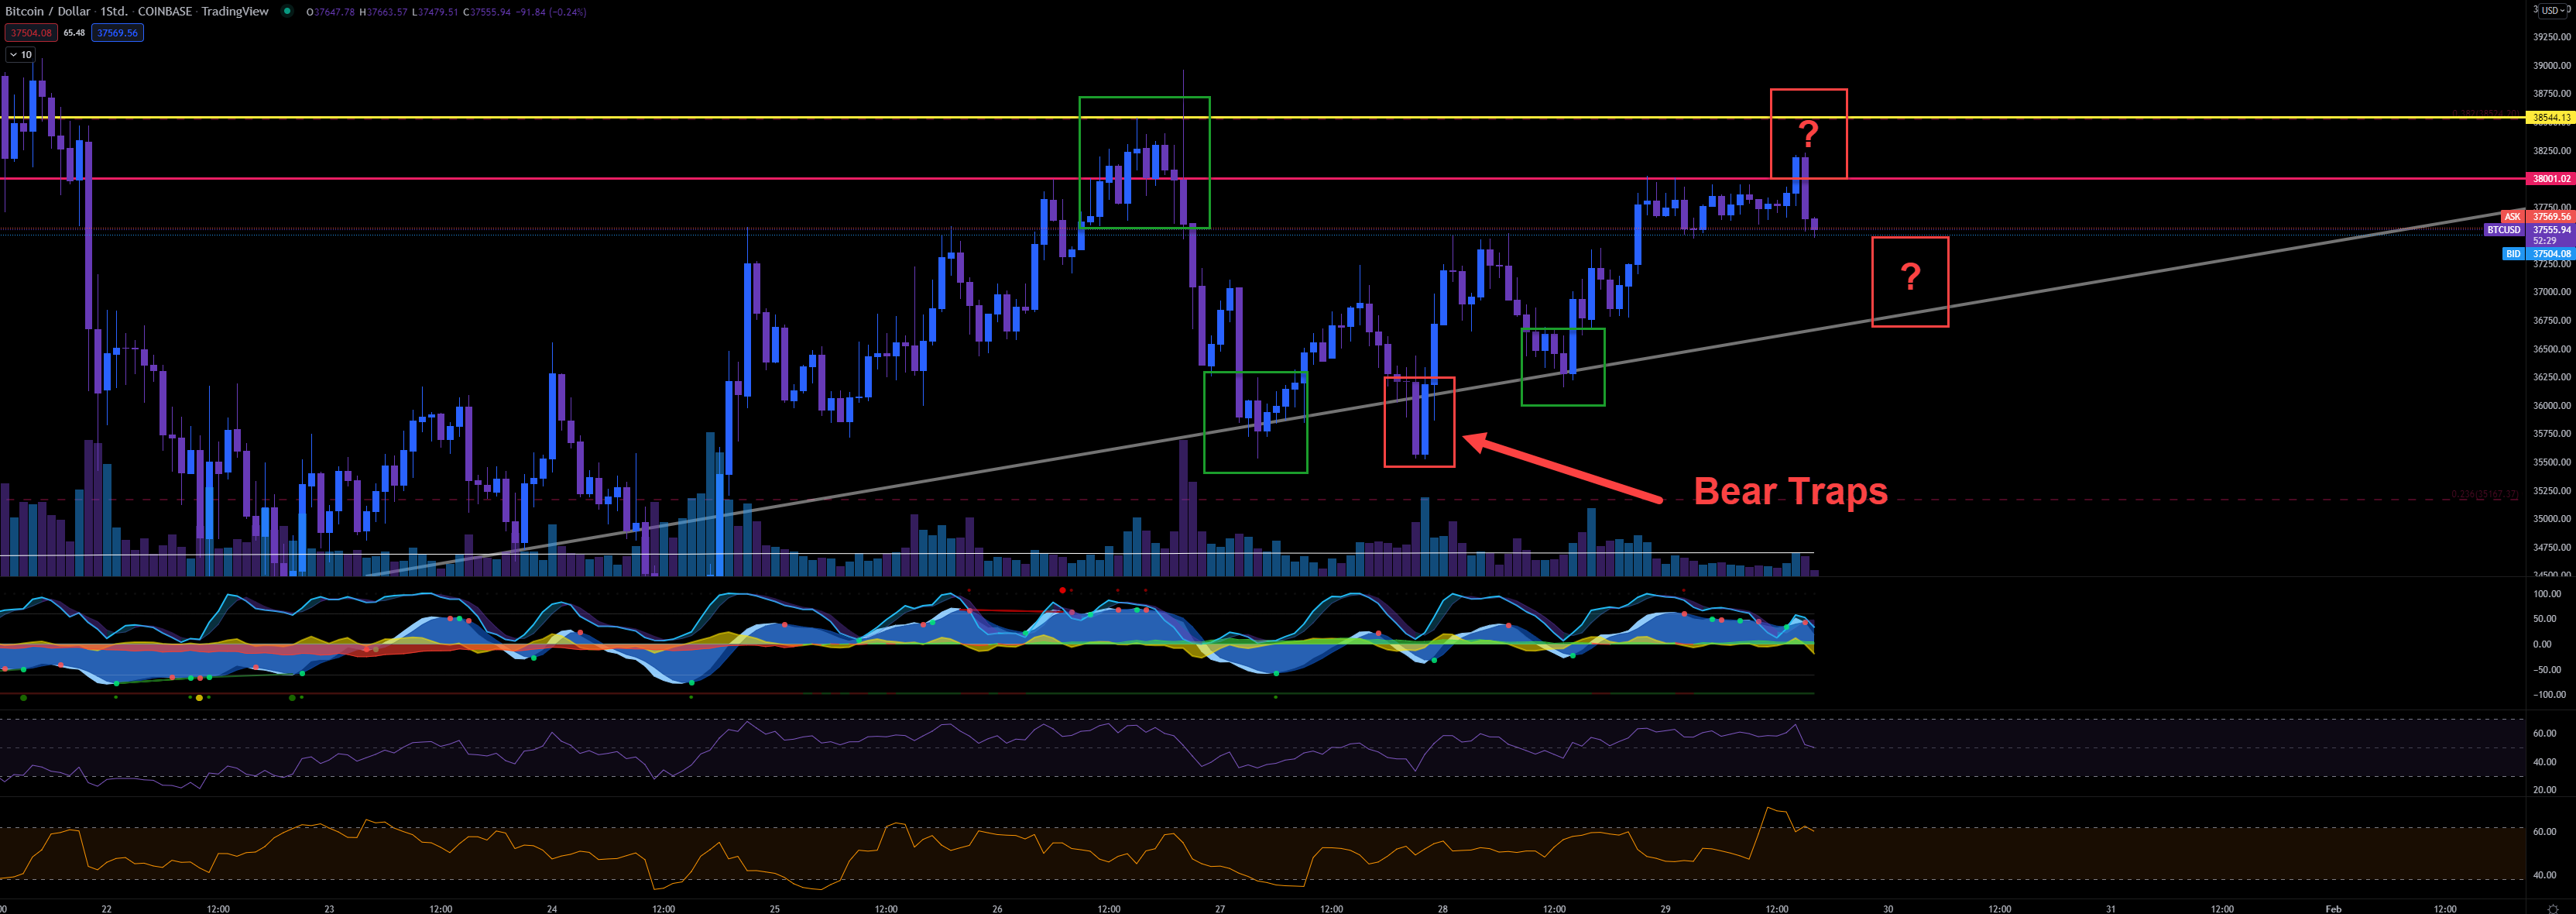
We can detect big inflows while we were reaching 38k again. Now is the BTC price declining again with low volume. In my opinion, we will bounce in the trendline and retest our resistance heading 38.5k. Only if we have our breakout at 36.7k I would expect more dump heading 35.5k. We are not ready to retest 33k yet in my opinion.
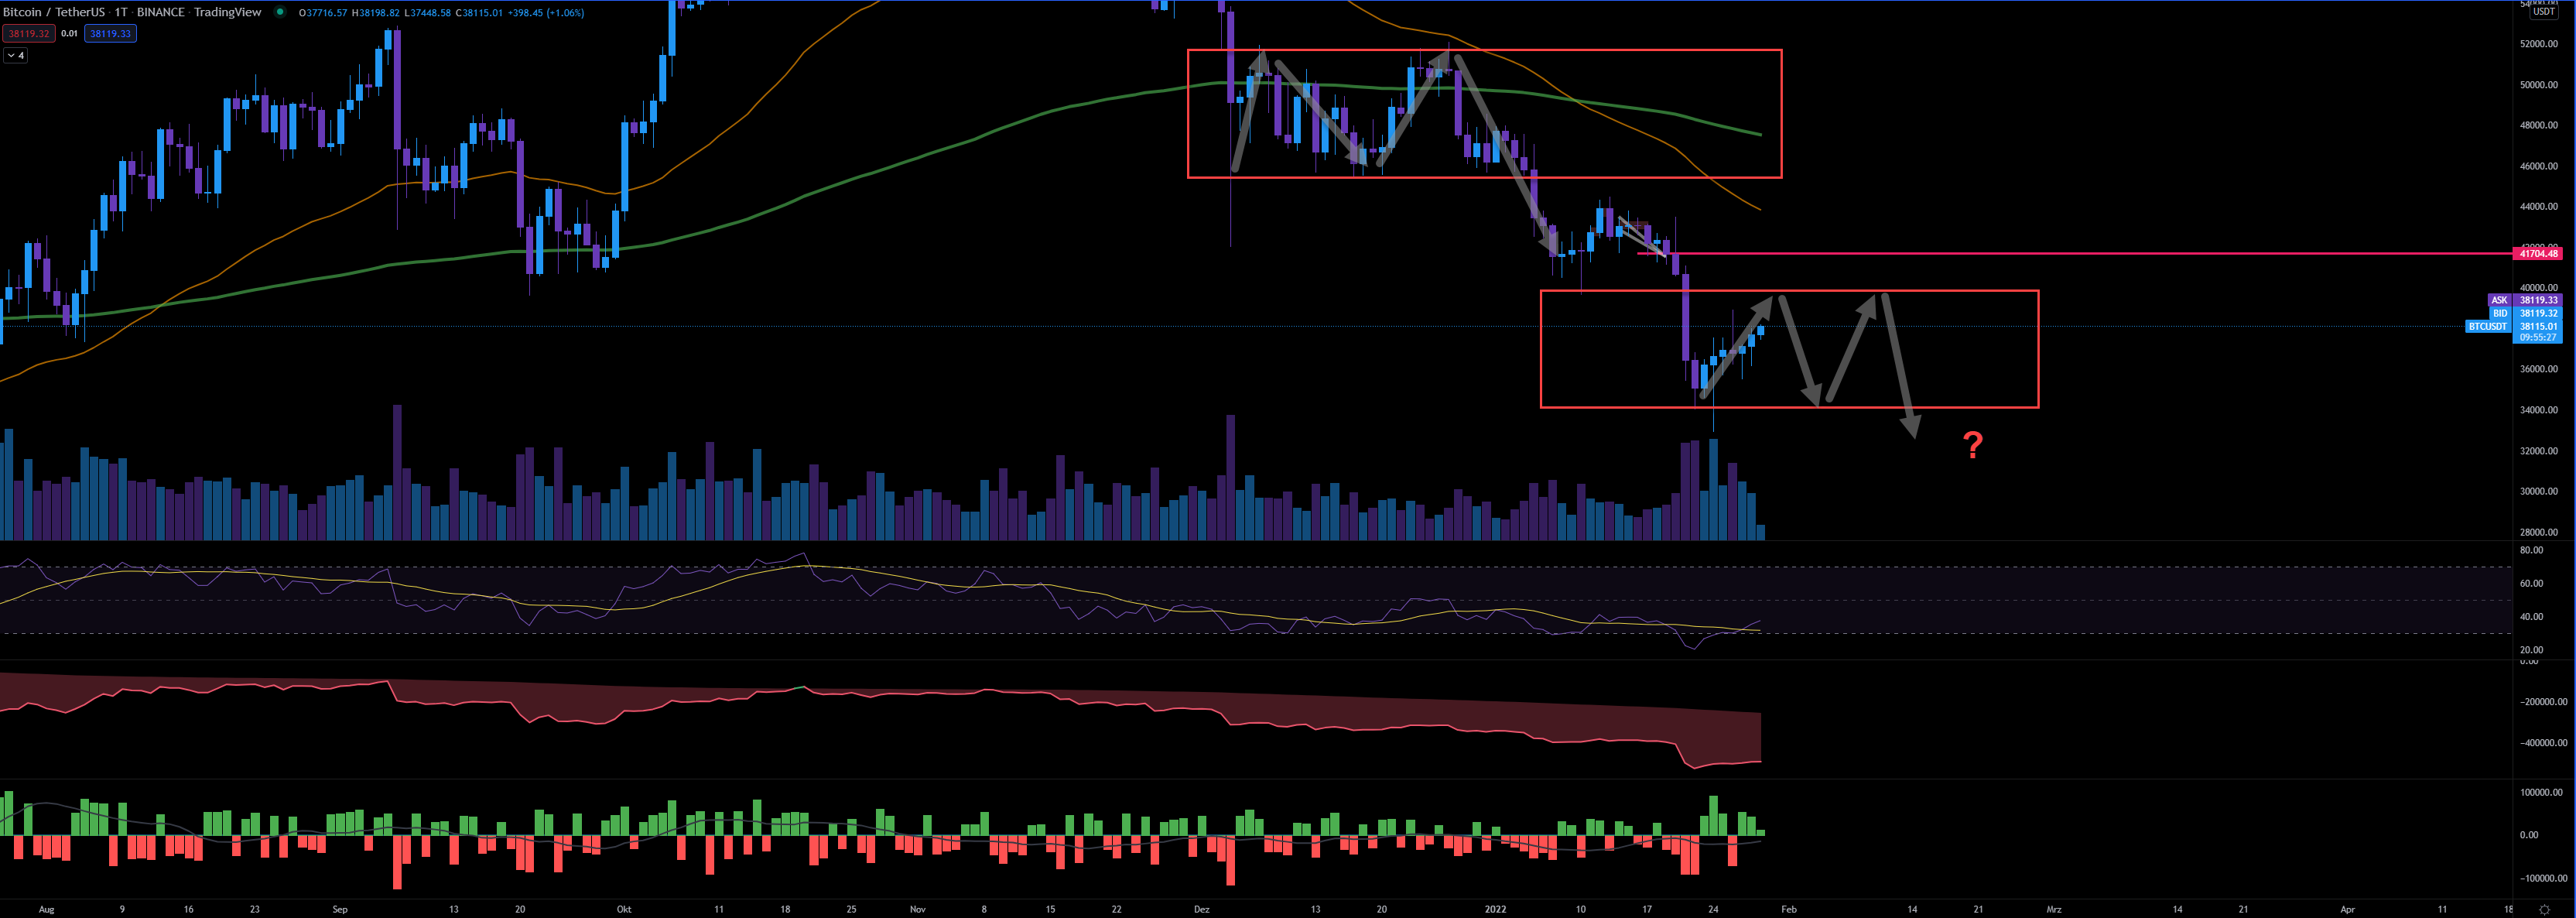
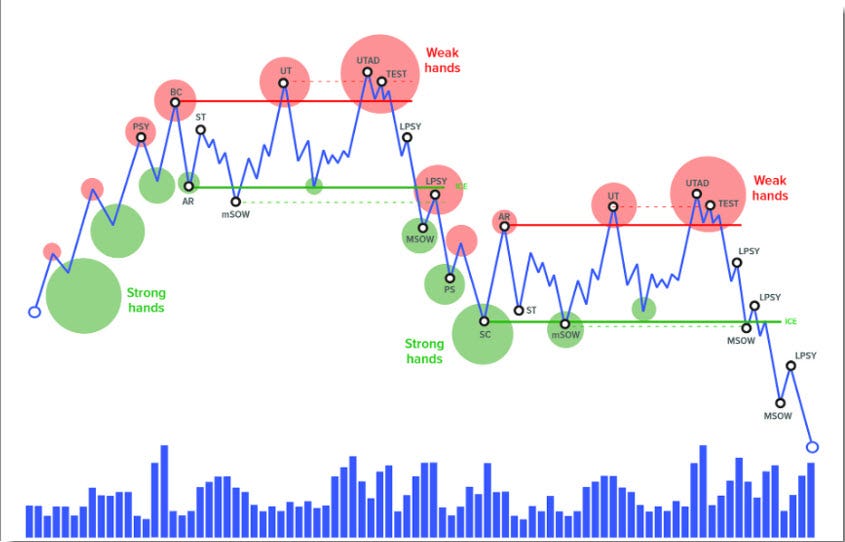
The question is if the bottom is in or not. It’s too early to determine that. If you check the chart below with Wyckoffs redistribution schematic you will find certain resemblance. Just check both charts below. The redistribution schematic is before we shift to the accumulation schematic (where the bottom is finally in). The redistribution schematic has some interesting characteristics we should have in mind. It begins with volatility and it ends with volatility before it shifts to accumulation or even to the next redistribution. Yes, we can have more redistributions phases in a row, before we shift to accumulation.
Wyckoffs redistribution schematic
So, to determine if we are in an accumulation or redistribution schematic we need a bit more time. However, at the moment it looks more to be a redistribution phase. The volume rises only when it retests, but the rally is poor quality (low volume). Anyway, I have mentioned in my last Special Report that the whales ratio data is showing a pump (lift up in price action) and a dump afterwards. But that’s the problem now, also the accumulation would match here, as part of accumulation schematics are fake rallies too. So, only the retests and the volatility could show us what kind of schematic we are trading right now.
In case we lift up heading 38.5k - 39k I would short again. I would start to short at 38k and the way up. Only with a leverage of max 10 with BTC. In case I will short ETH (maybe it makes more sense) I would use a leverage if 5. My target would be 34.7k and then recheck the data if I see some bullish signals indicating the local bottom. However, as usual. That’s my personal trade strategy! Please, use the data and make your own trade strategy! I will tweet data changes in case I detect something interesting.




Thanks for the update mate.
Market is so boring without pumps and dumps 🙃 But at least, i get some sleep and have time to do my household chores 😋 Thank you for keeping us updated about the recent changes, it helps a lot! ❤️