Whales Ratio - Hourly View
Chart Analysis:
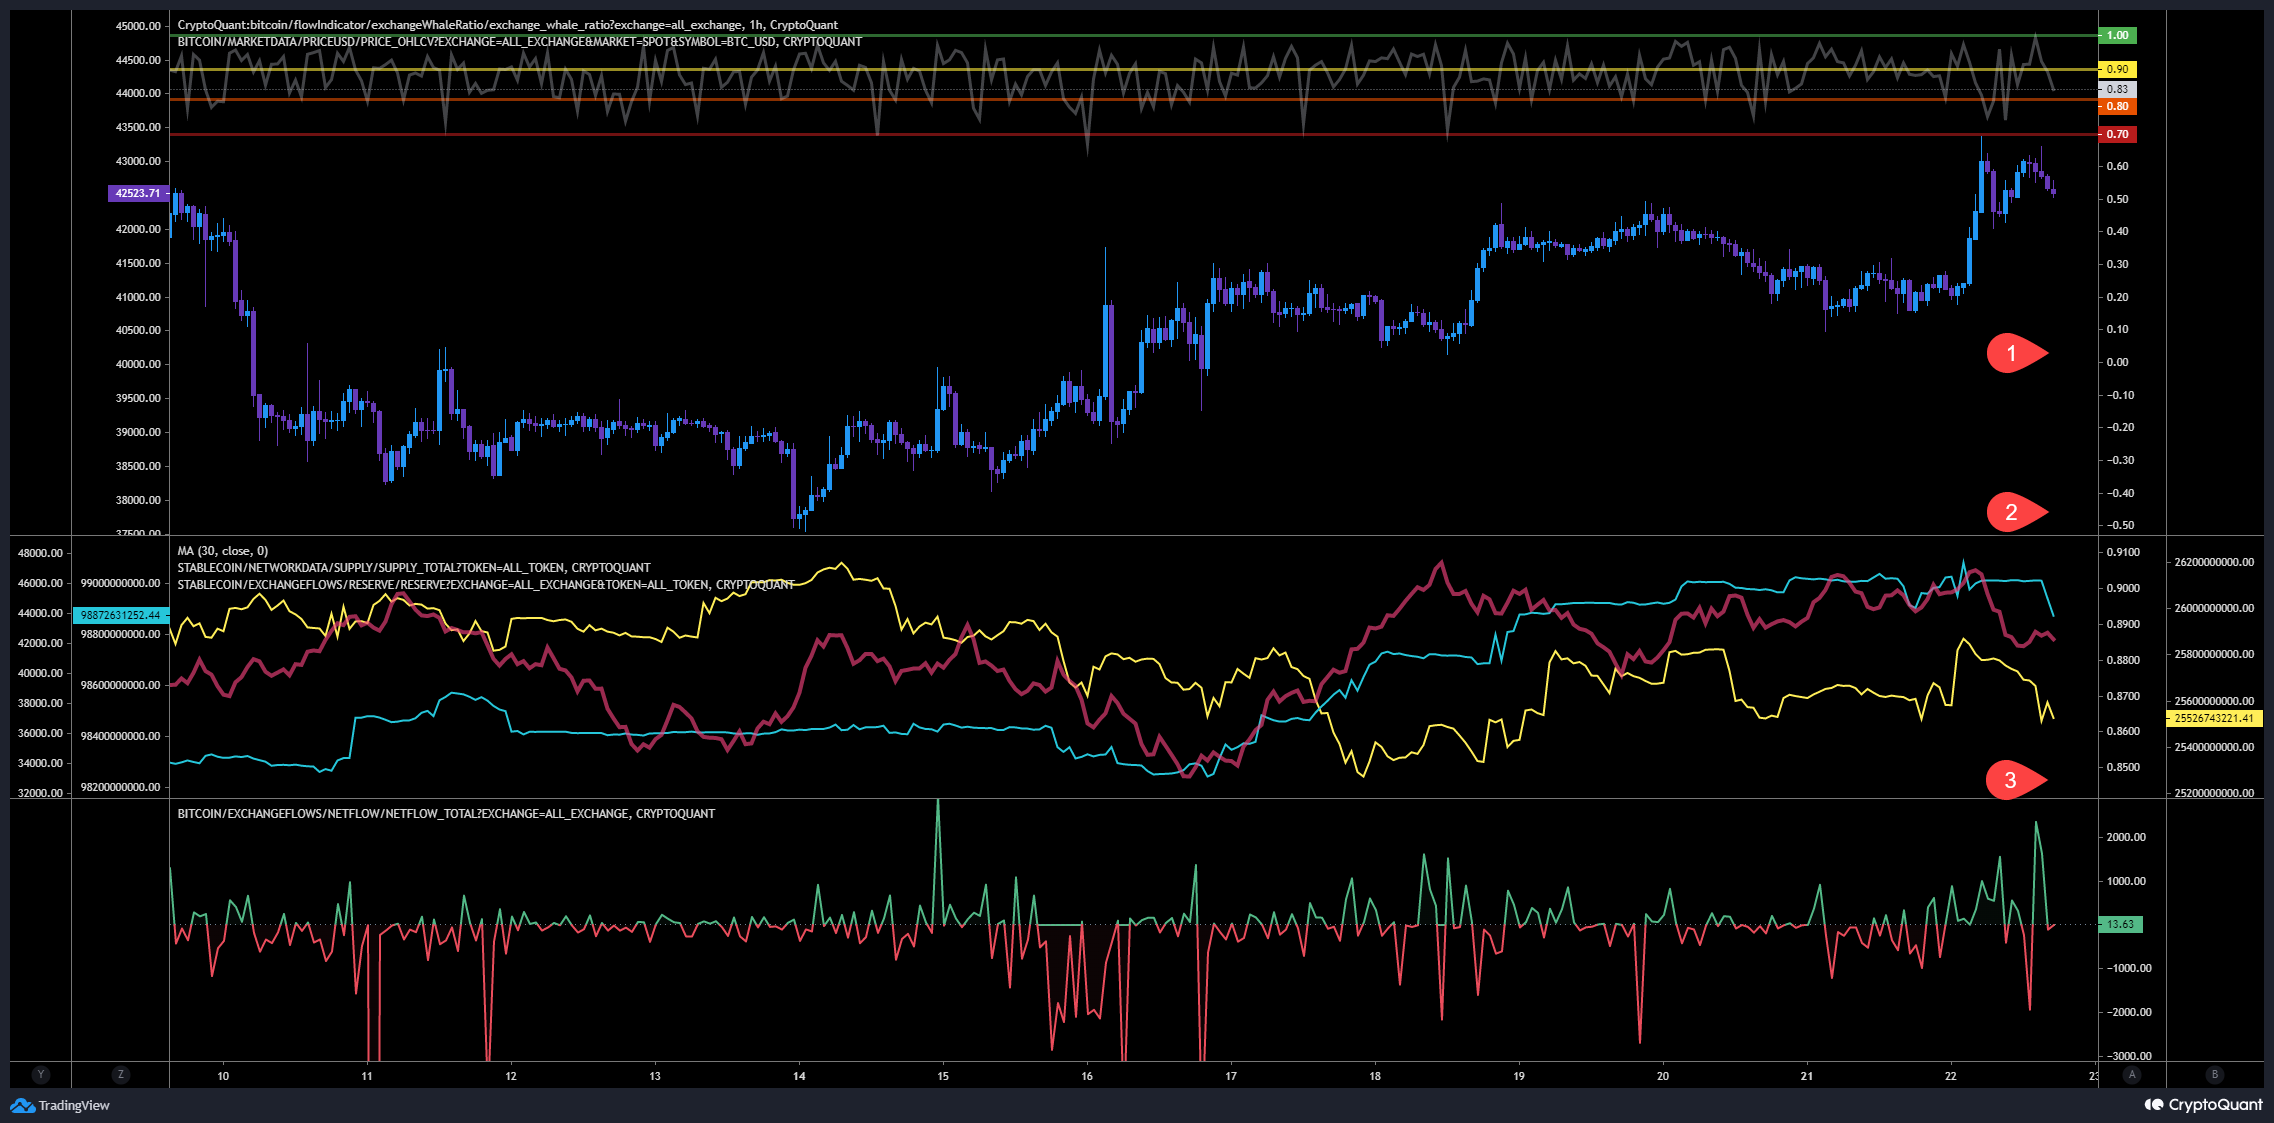
Whales ratio (1) keeps maintaing an upper level indicating that whales keeps sending tokens to exchanges.
Whales Ratio 30d Average (2) has started to decline while the price has started to pump. Interesting here, the stablecoin reserves on exchanges have declined at the same time and even the supply has started to decline. That’s indicating less demand in stablecoins as a result of traders exiting.
Total exchange Netflows (3) was negative while we pumped indicating more outflows than inflows and flipped back to green indicating a rising inflows and more than outflows.
Inspos Conclusion: Whales ratio indicating today distribution again.
URL to chart: https://cryptoquant.com/prochart/vYNO3z1cx9LcSvg
Market Flow Analysis
Chart Analysis:
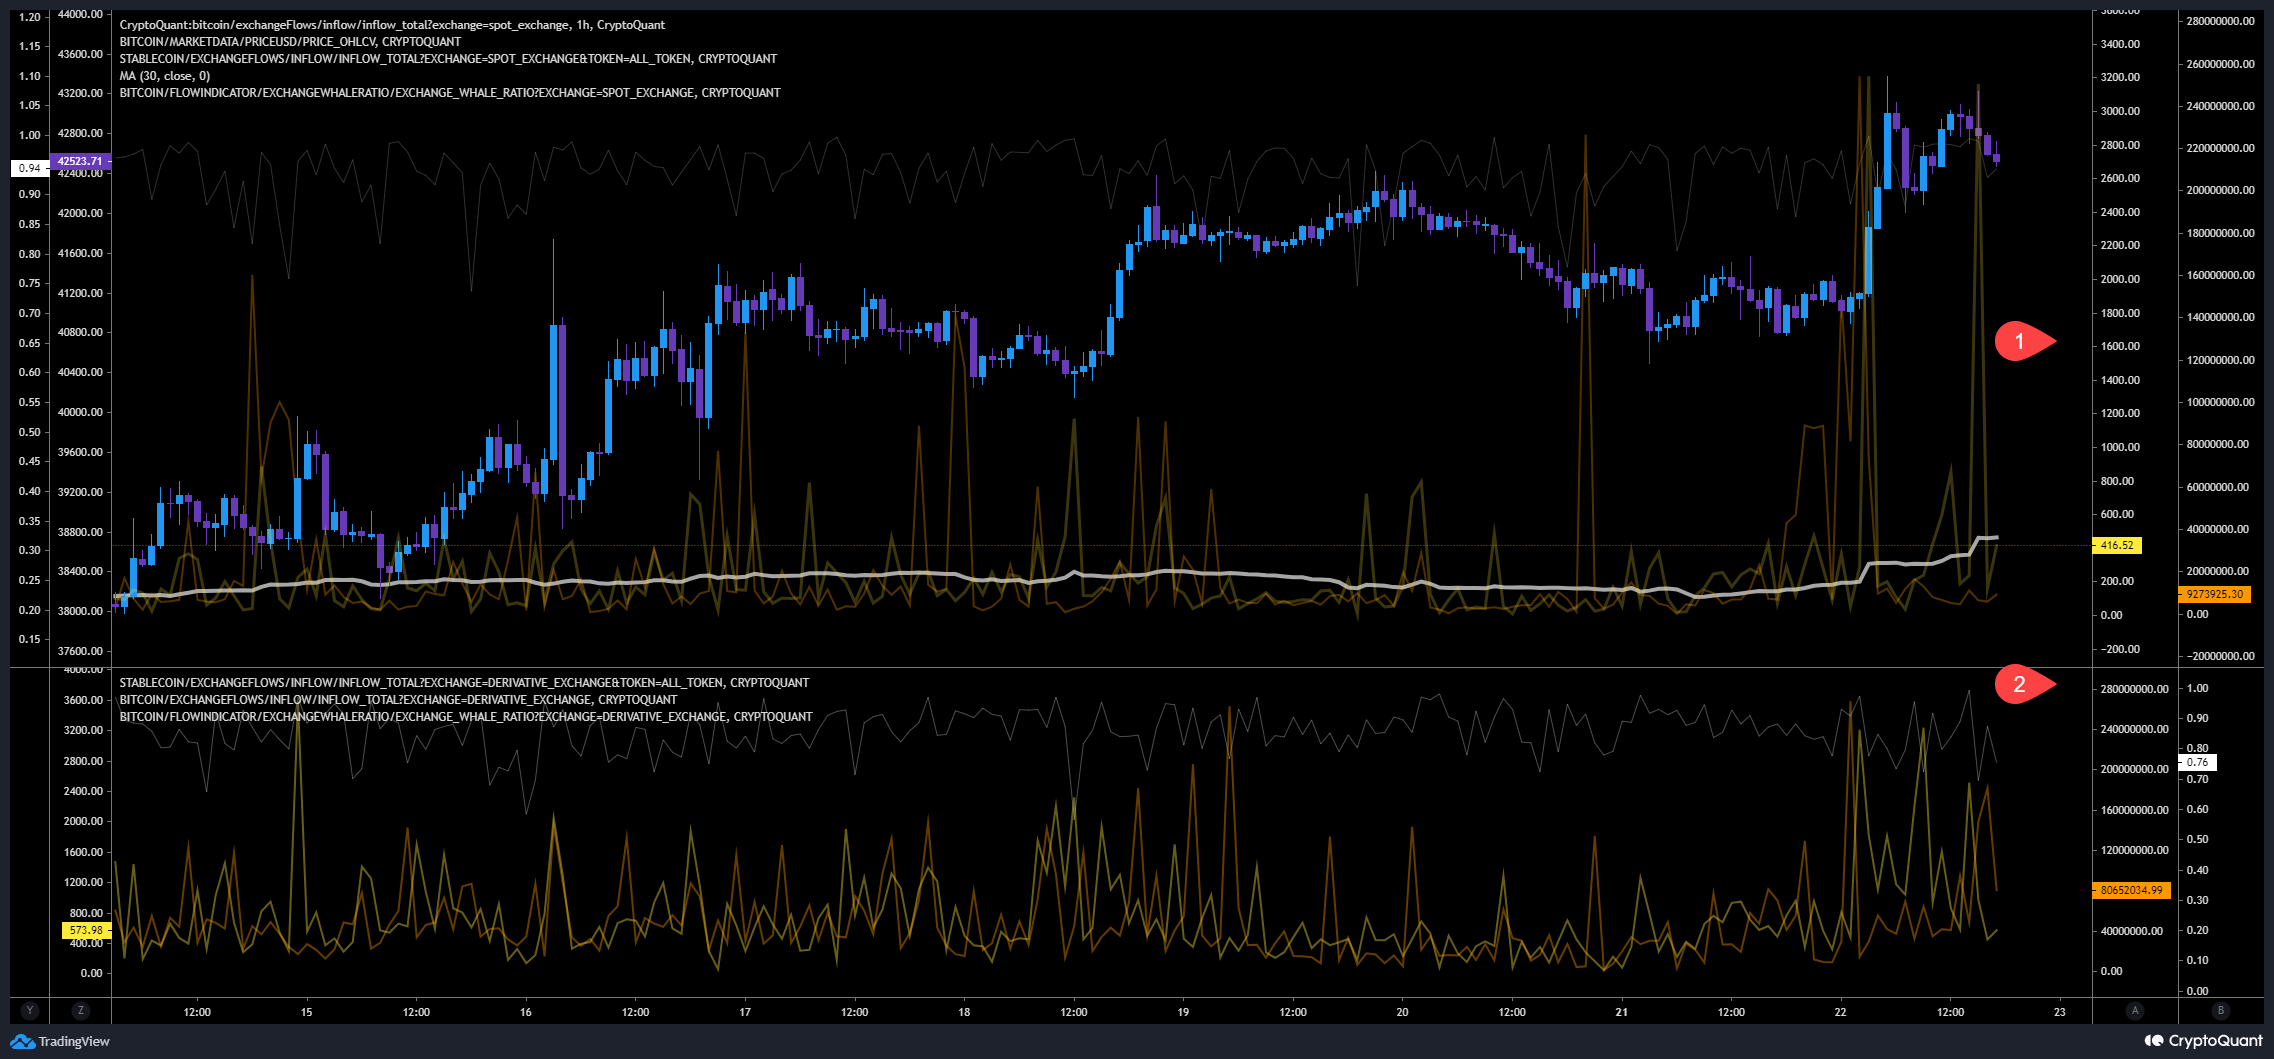
Spot exchanges (1) have received 3,200 BTC close and almost $500 millions in stablecoins before the the pump and just 2 hours ago another 3,100 BTC. Also confirming the distribution mentioned above.
Derivative exchanges (2) same scenario like described above. They sent $260 millions in stablecoins 2 hours before they started the pump plus 5,500 BTC. They kept sending more BTC, almost a total of more than 20,000 BTC! In the last 3 hours almost $400 millions in stablecoin reached derivative exchanges too.
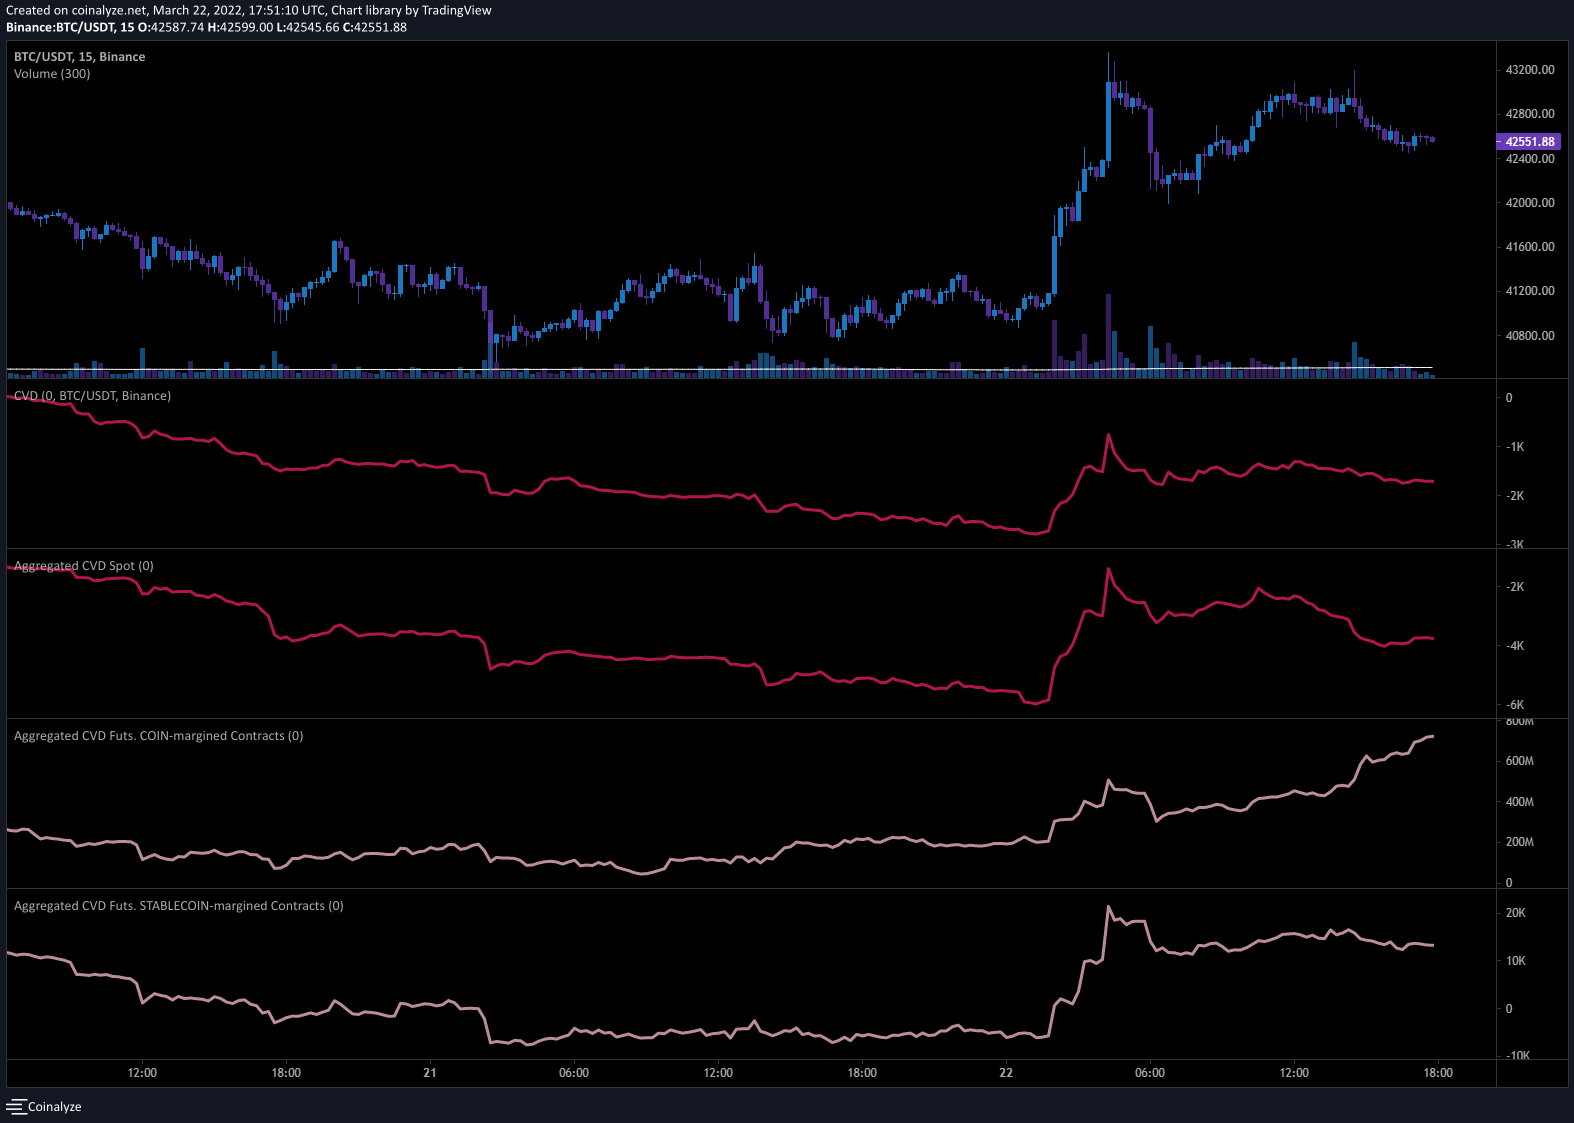
What happenend since then? They have started to pump with stablecoins via spot exchanges and derivatives, after we reached the local top, coin-margined futures started to lift up to keep pushing the price while spot have started to sell while stablecoins maintained stable.
Inspos Conclusion: That was a nice coordinated pump op. Almost every big exchanges shows the same pattern. It seems they used this pump to distribute in upper level.
URL to chart: https://cryptoquant.com/prochart/twn15SQOKlZTxCS
Future Trading Analysis
Data Analysis:
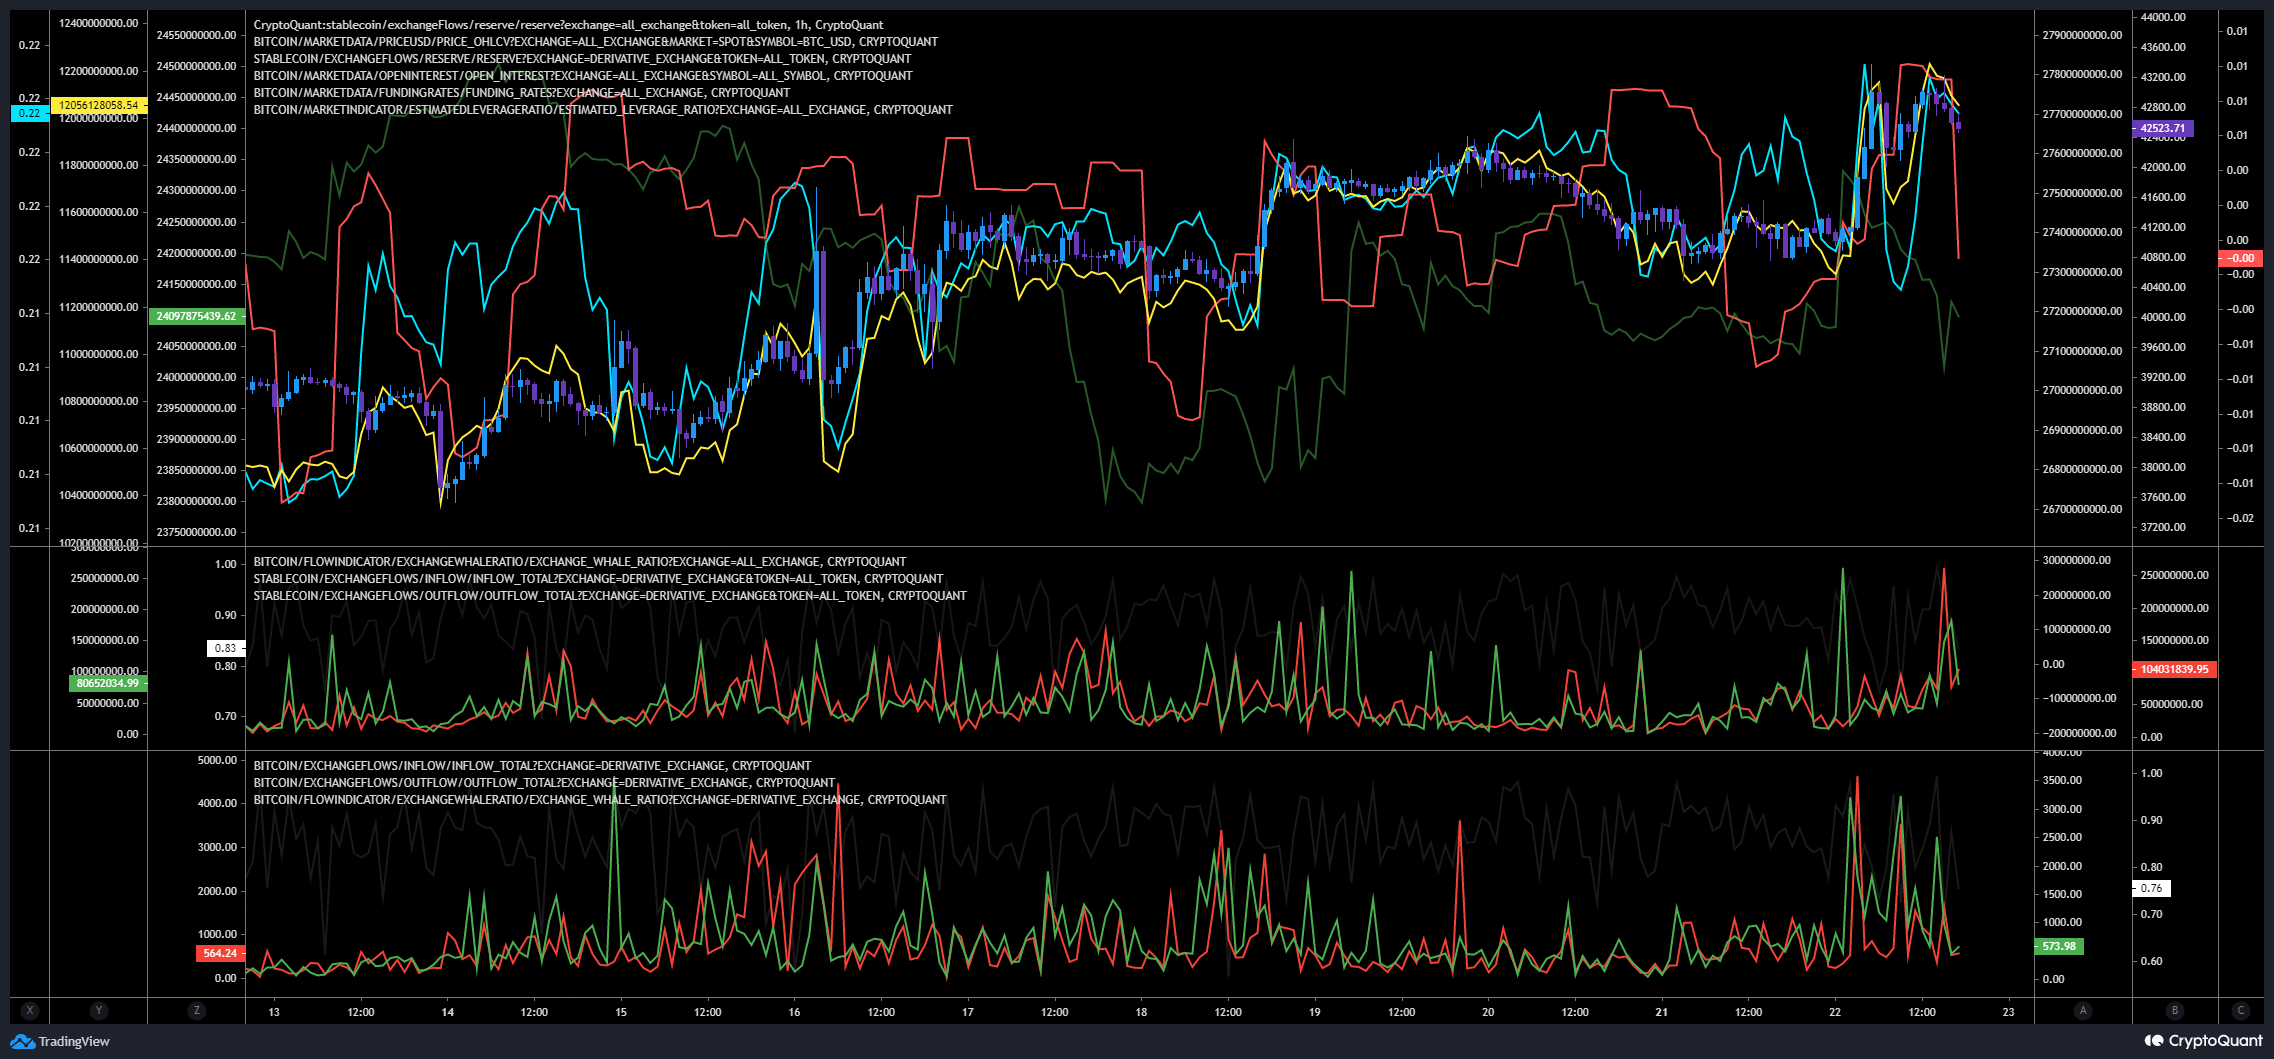
Funding rate has started to decline after we formed the double top. Open interest declined at the same time indicating longs are closing their positions and taking profit. Confirmed by the stablecoin outflows of §260 million at the same time too.
We can also detect big BTC outflows from derivative exchanges but we received almost 5,000 BTC again while the funding rate was declining.
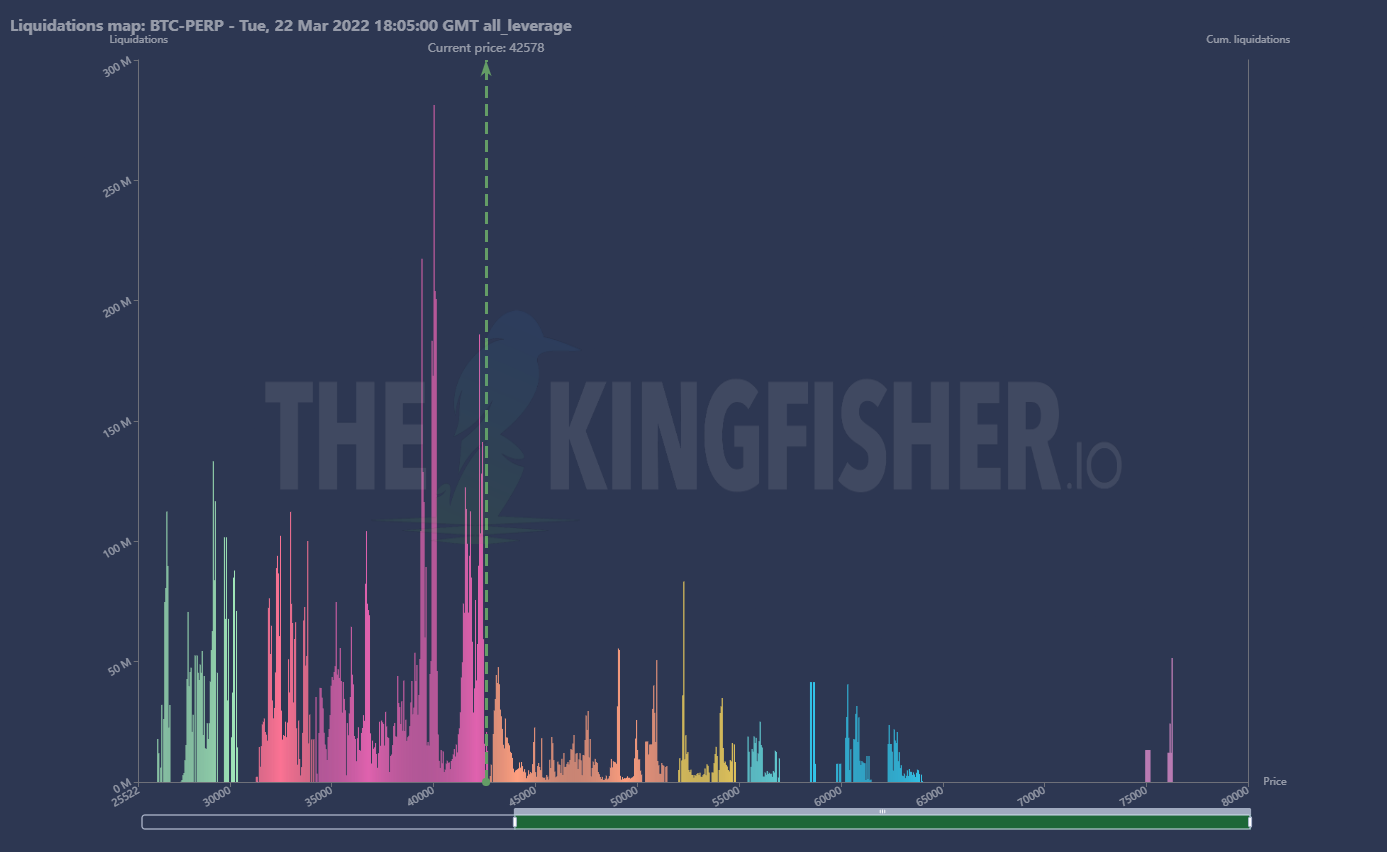
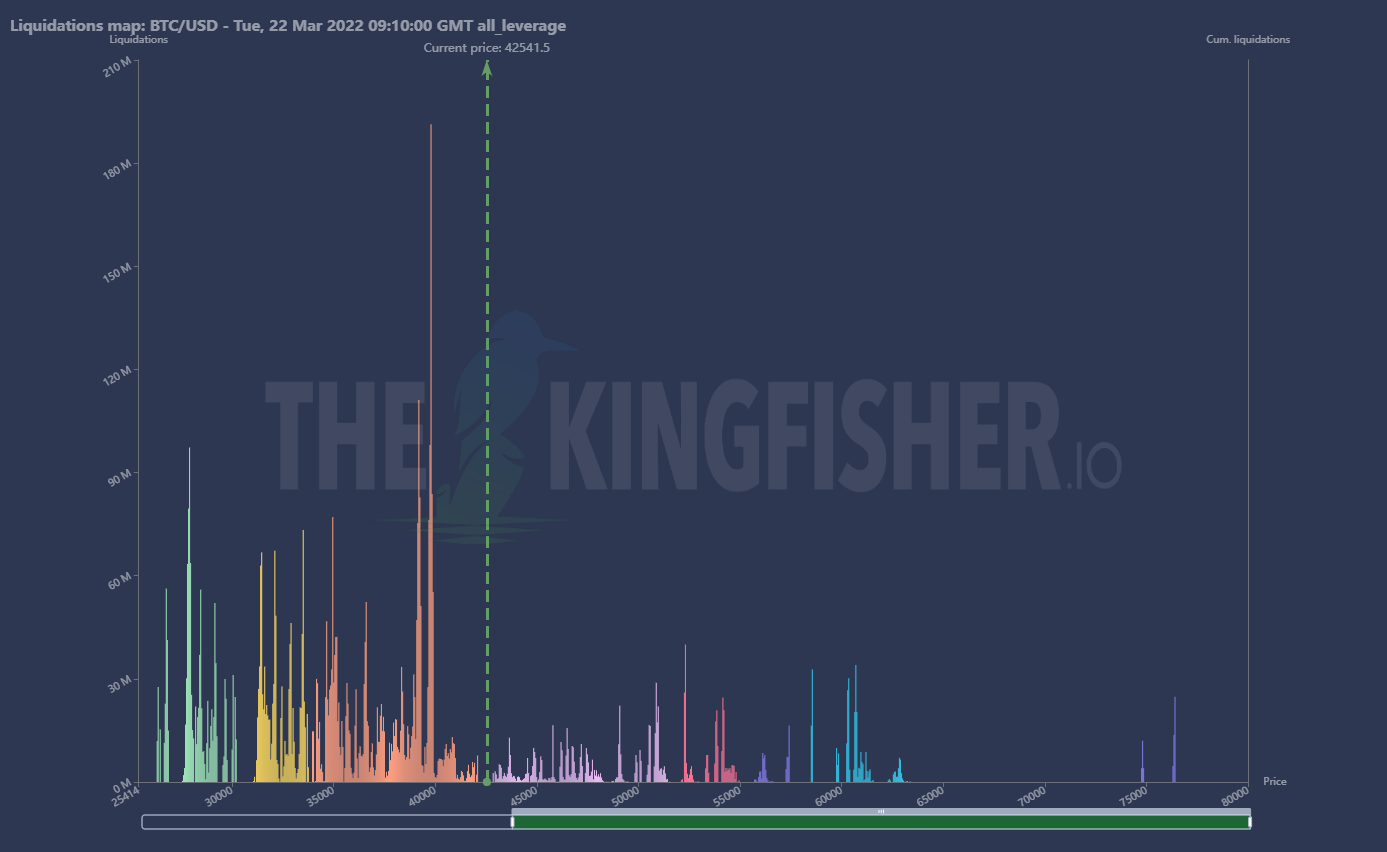
Liquidation map showing an accumulation of high leverage longs, but also low leverage shorts are rising related to FTX. While on Bybit we can see only longs liquidation volume almost no shorts. Could indicate that FTX whales are placing shorts now. But that’s a speculation and not a solid statement. If the volume in shorts would rise, that would confirm that.
Inspos Conclusion: In my opinion they are planning the shorts op. We will maintain that price level until the distribution is done. But as usual, we need to be ready in case they surprise us.
URL to chart: https://cryptoquant.com/prochart/zFcleLpk1mYReou
Option Trading Analysis
Data Analysis:
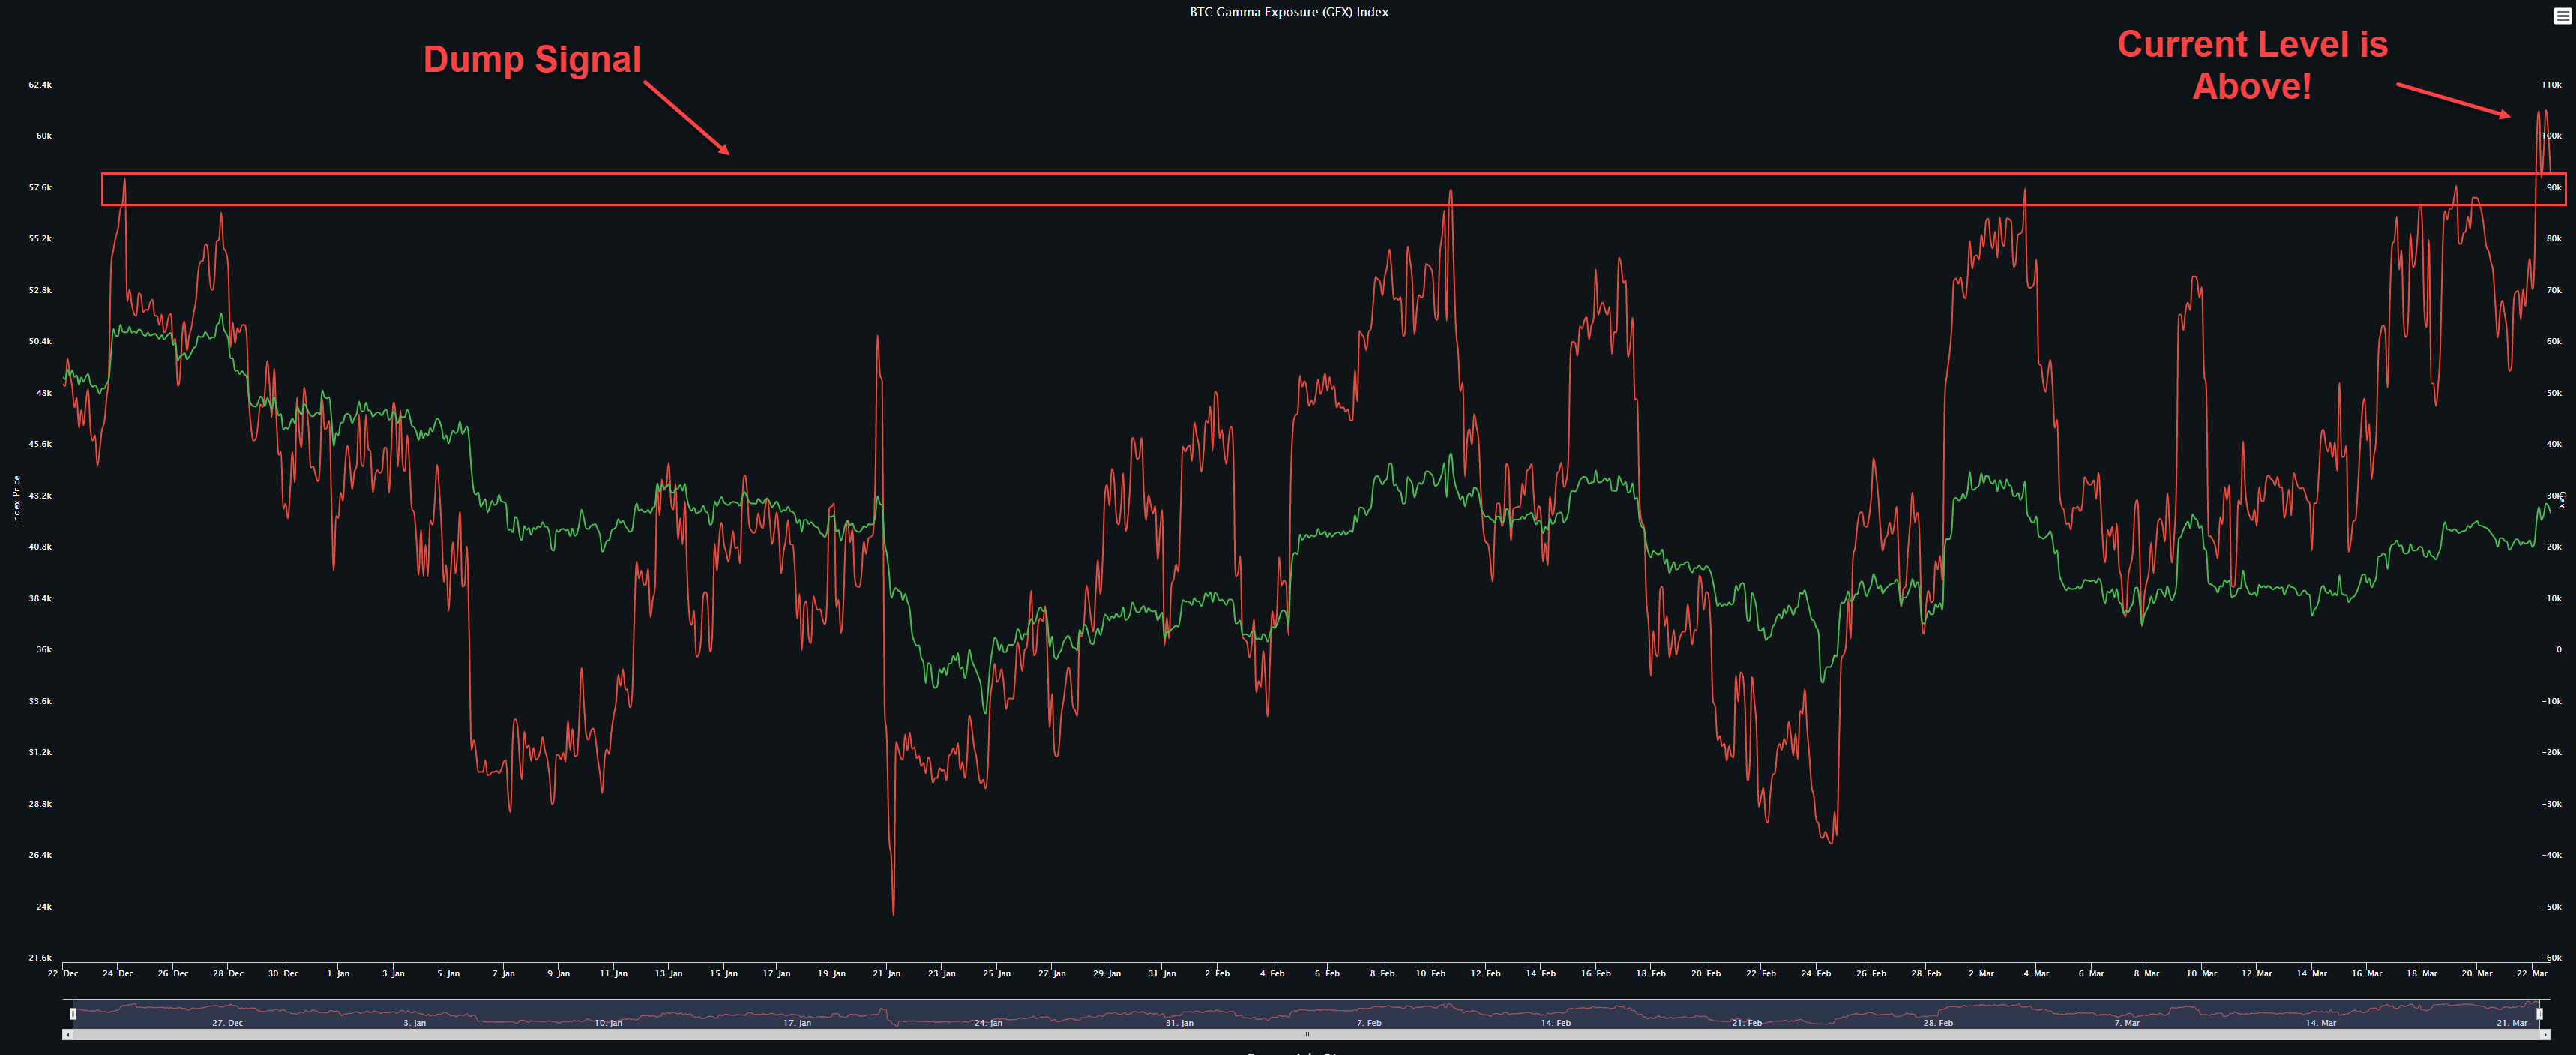
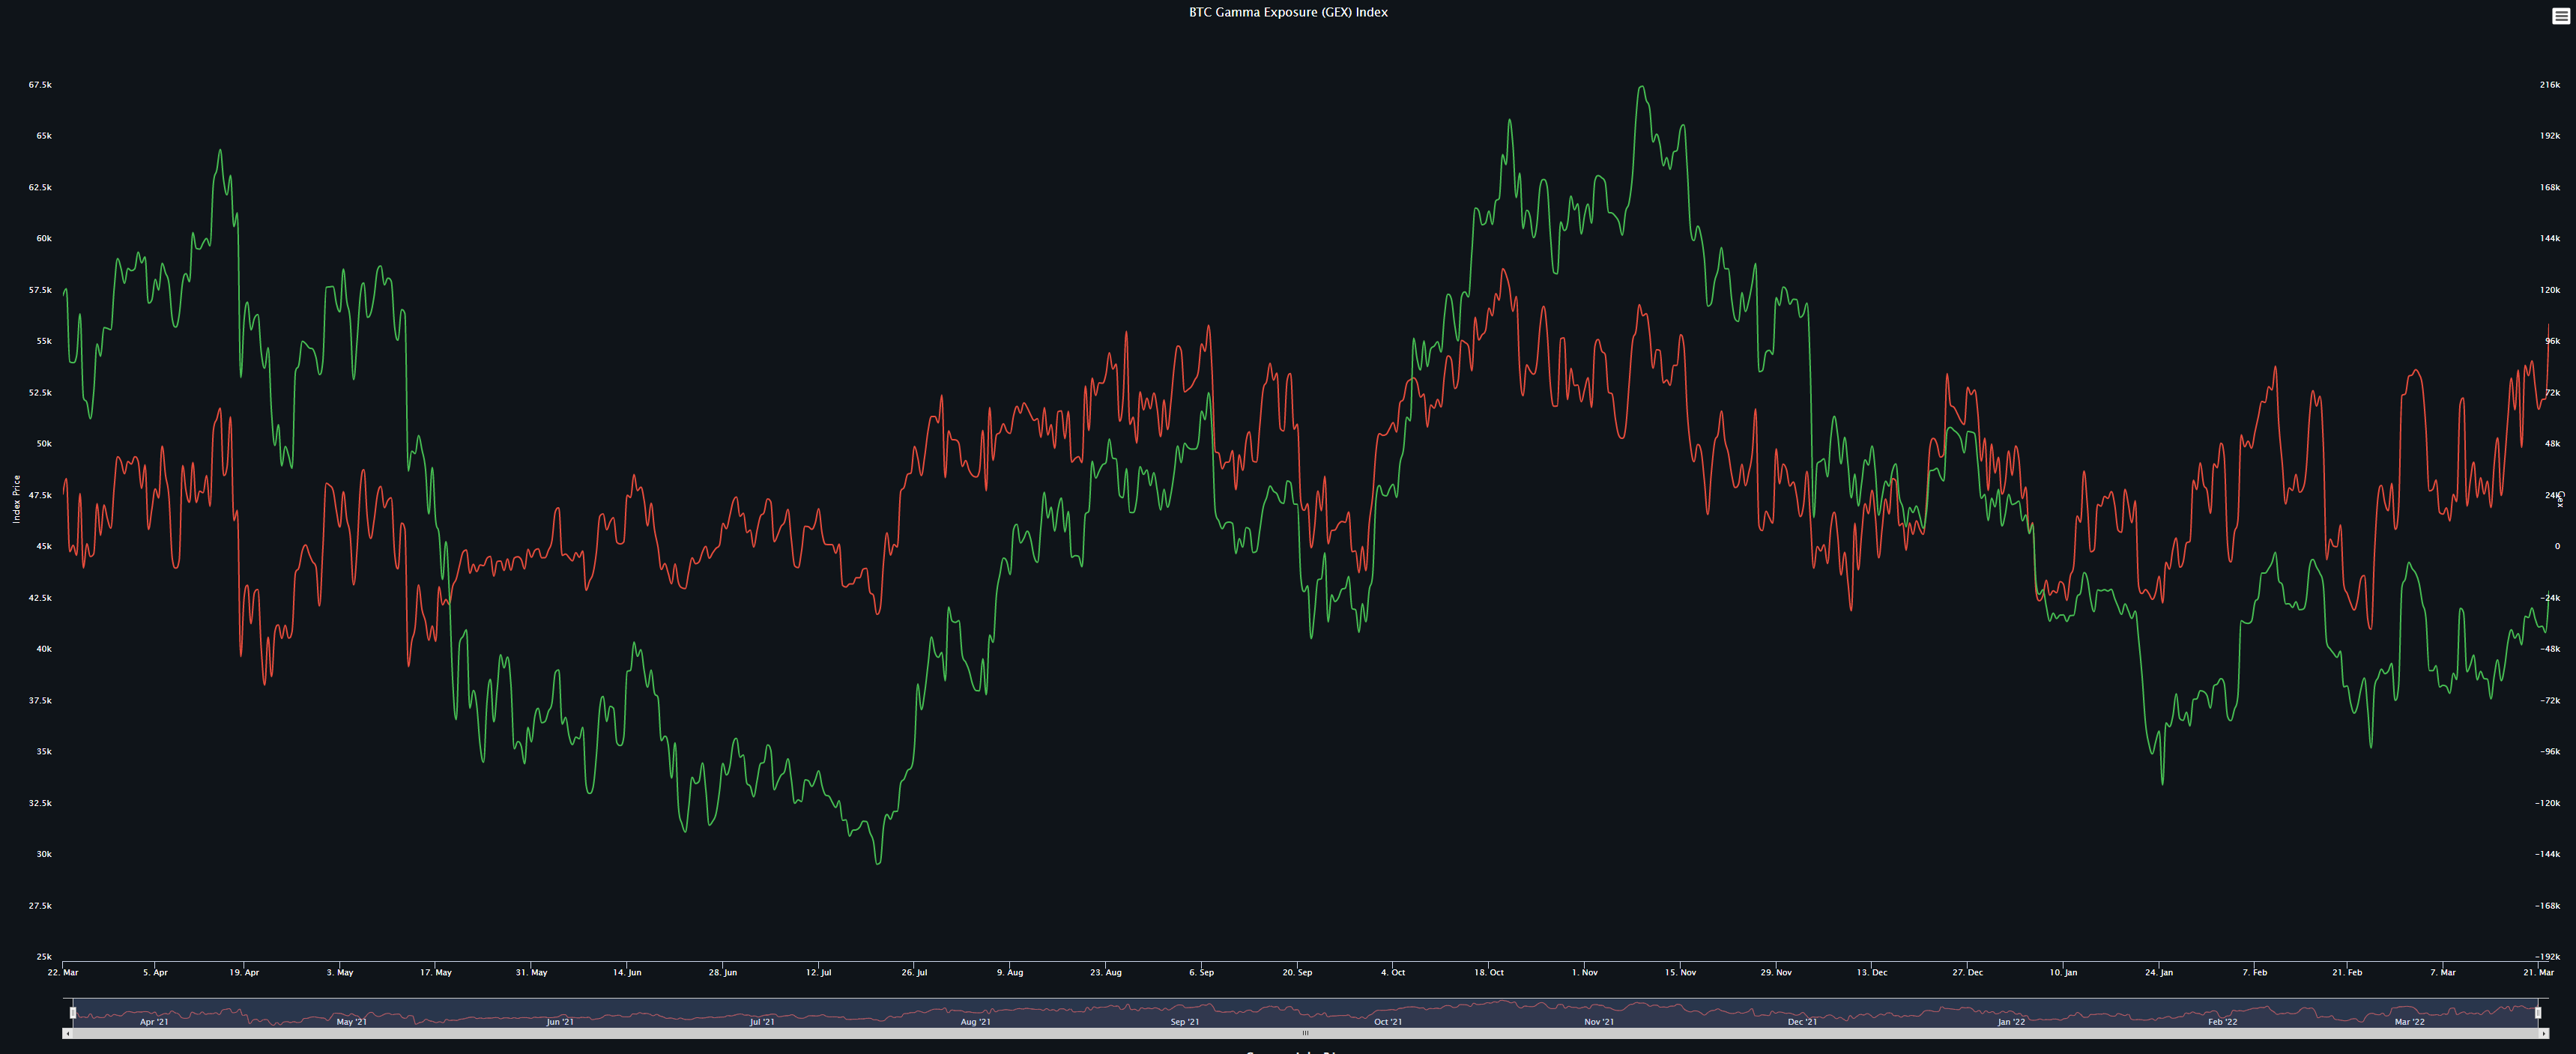
As predicted yesterday, in case we would pump, like we did, the GEX would lift up even more feeding the bear. Everytime when the GEX hits the top, the price dumped afterwards. Now we reached even a level above of the 3 months top. I have added the One Year comparison. Check what happenend everytime when the GEX hits the top and check our current position!
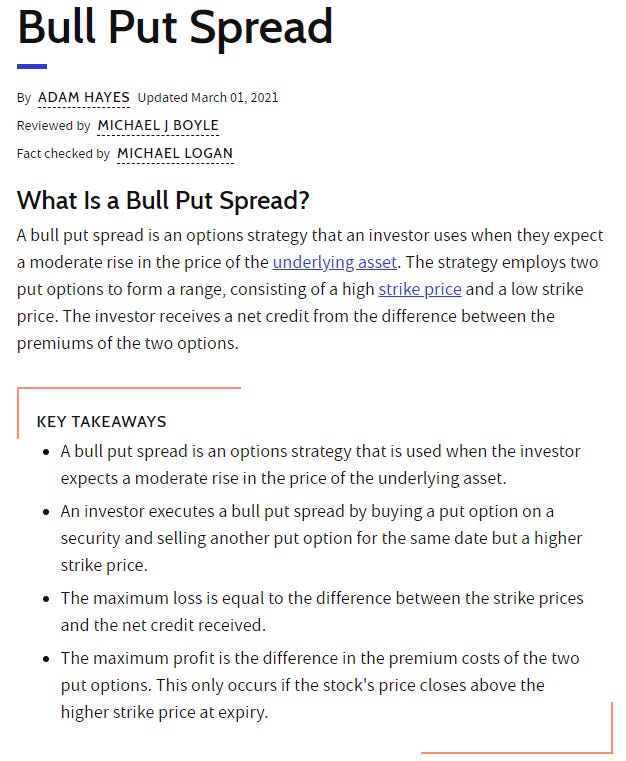
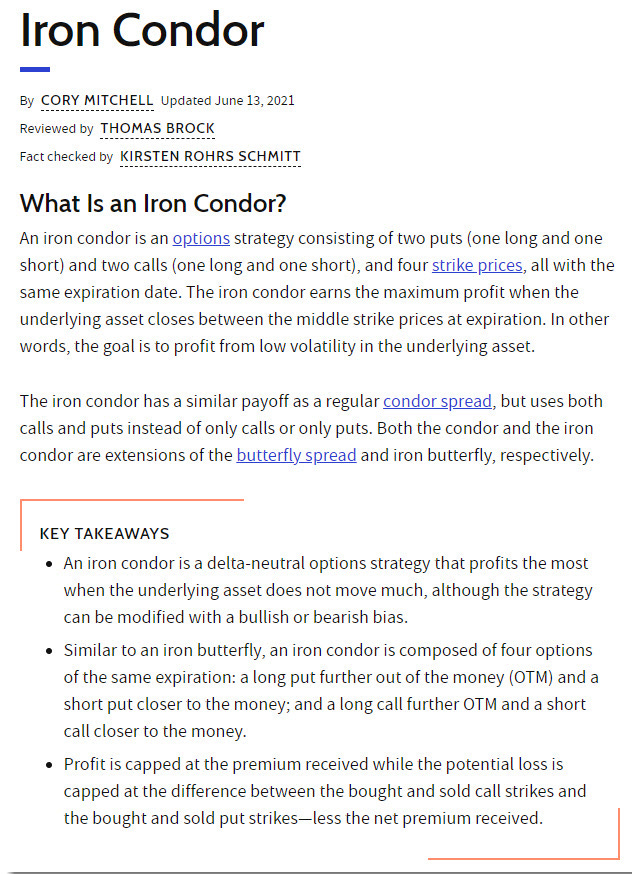
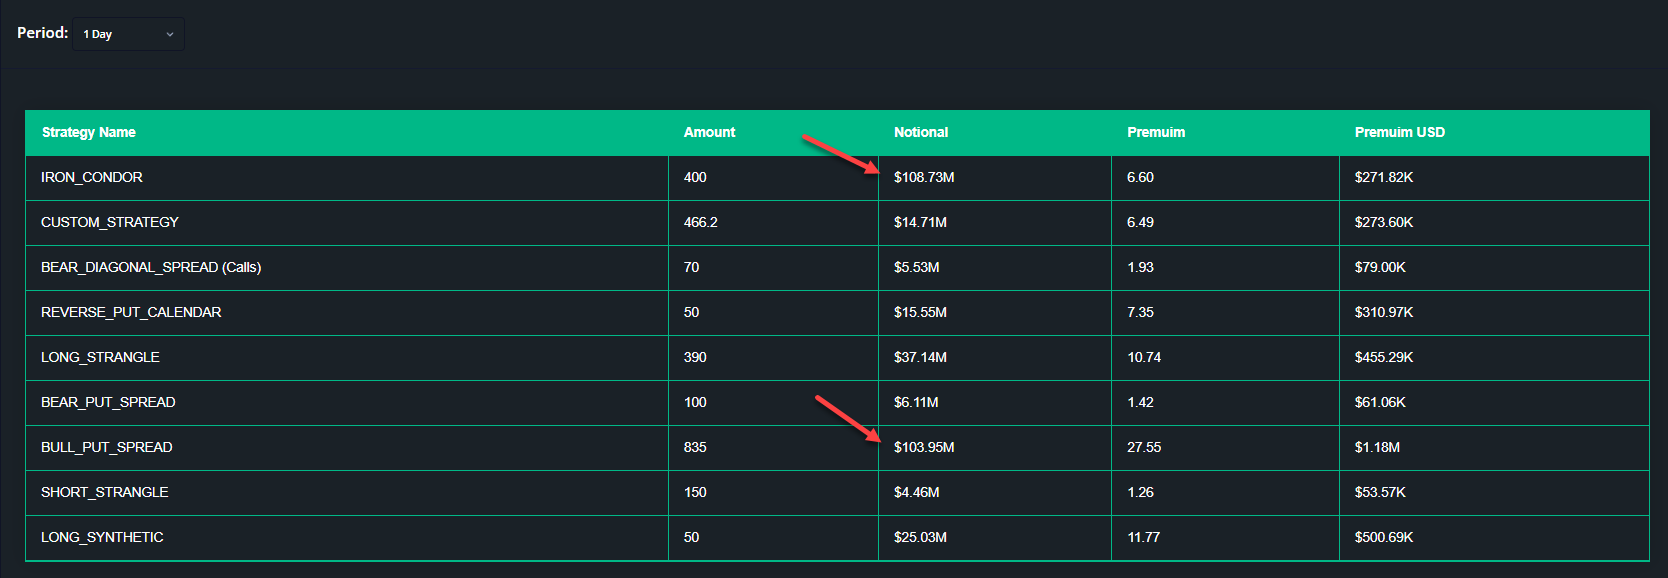
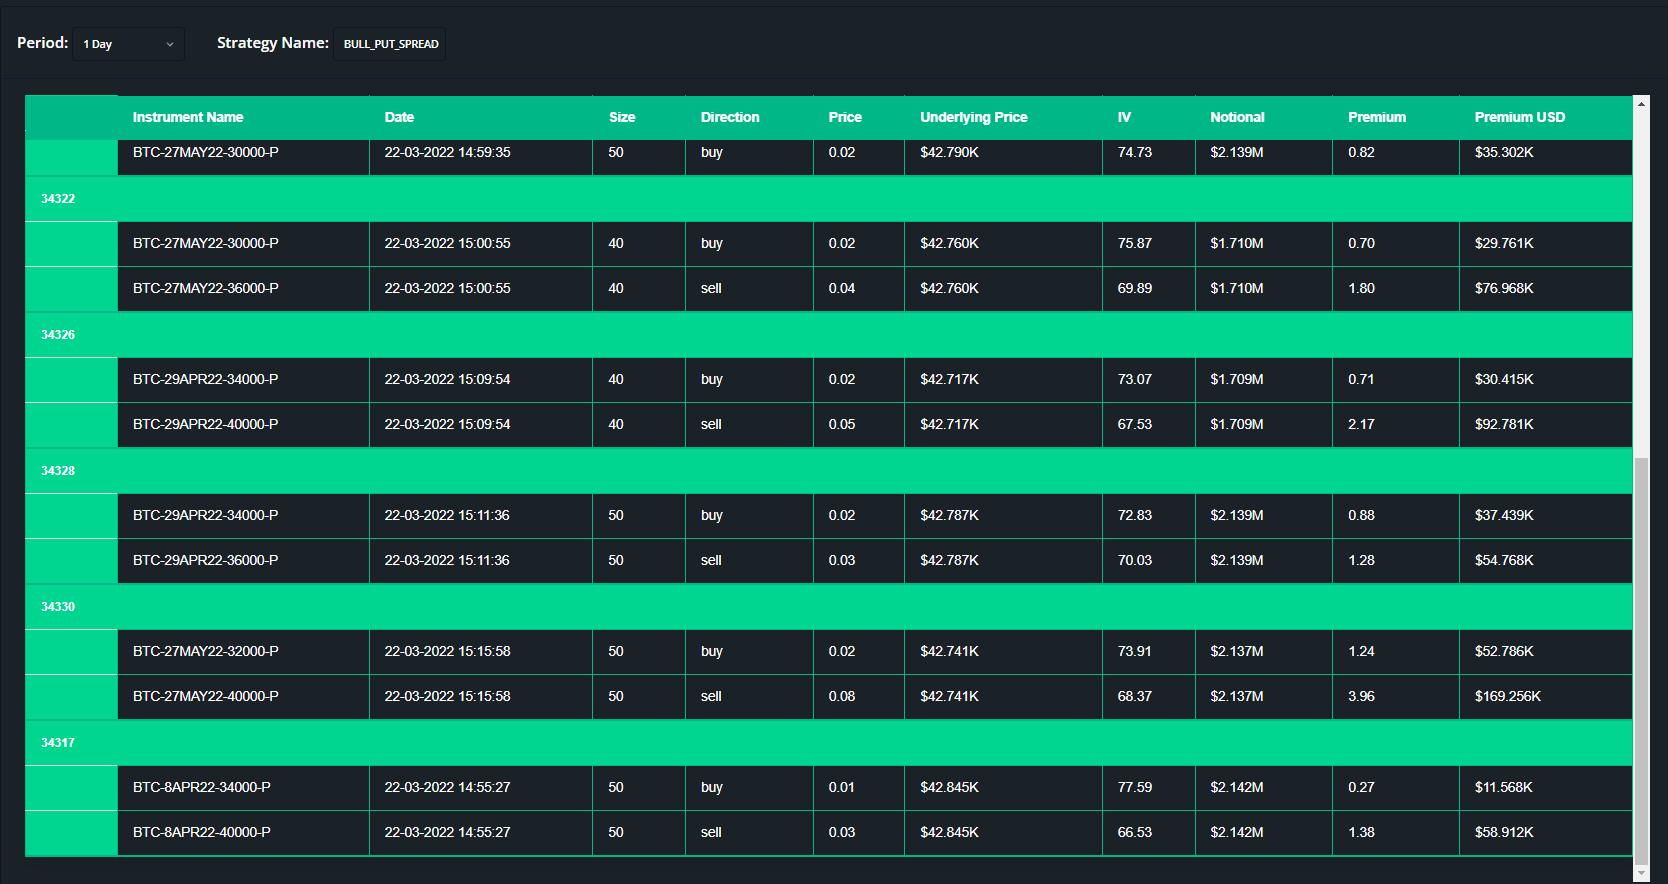
Since yesterday they traded almost 2 strategies. Iron condor and Bull Put Spread.
Bull Put Spread Explanation
Iron Condor Explanation
Both are neither bullish nor bearish. Both try to make gain with premium with moderate or even neutral price action. Interesting here, the Iron Condor is linked to one trade!
Inspos Conclusion: Based on option trading they expect a moderate positive price action or even just a sideway run. Based on GEX I would say, both are wrong.
URL to Chart:
https://app.laevitas.ch/dashboard/btc/deribit/options/activity/overview
Exchange Order Walls
Analysis:
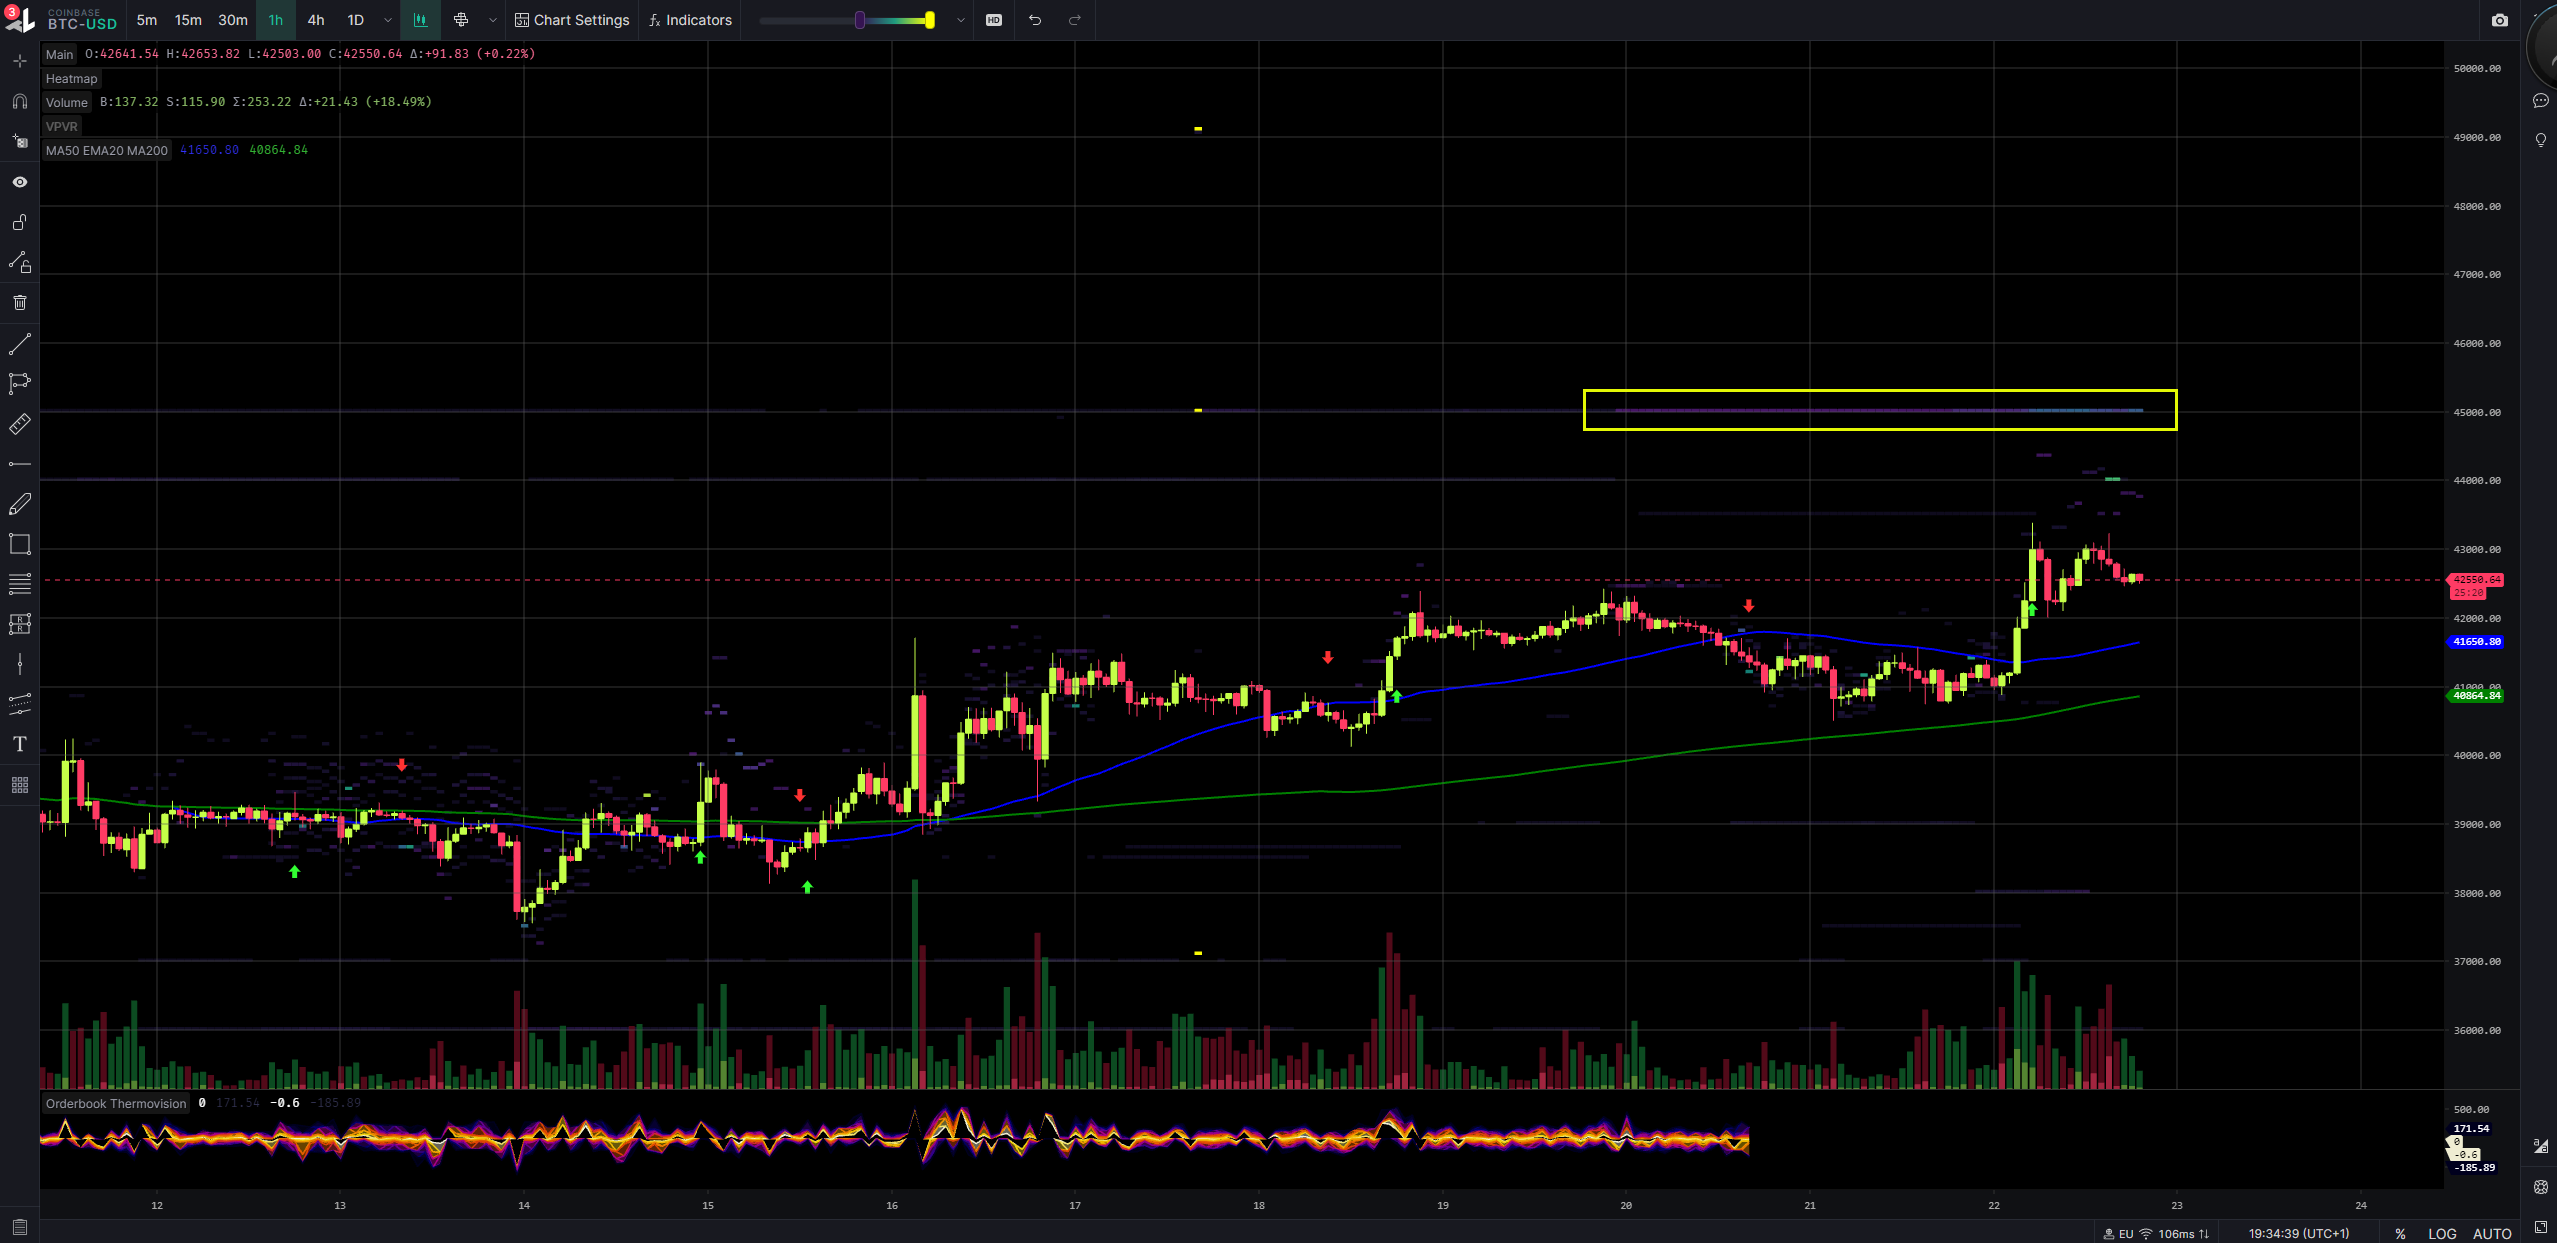
Coinbase limiting the way up at 45k.
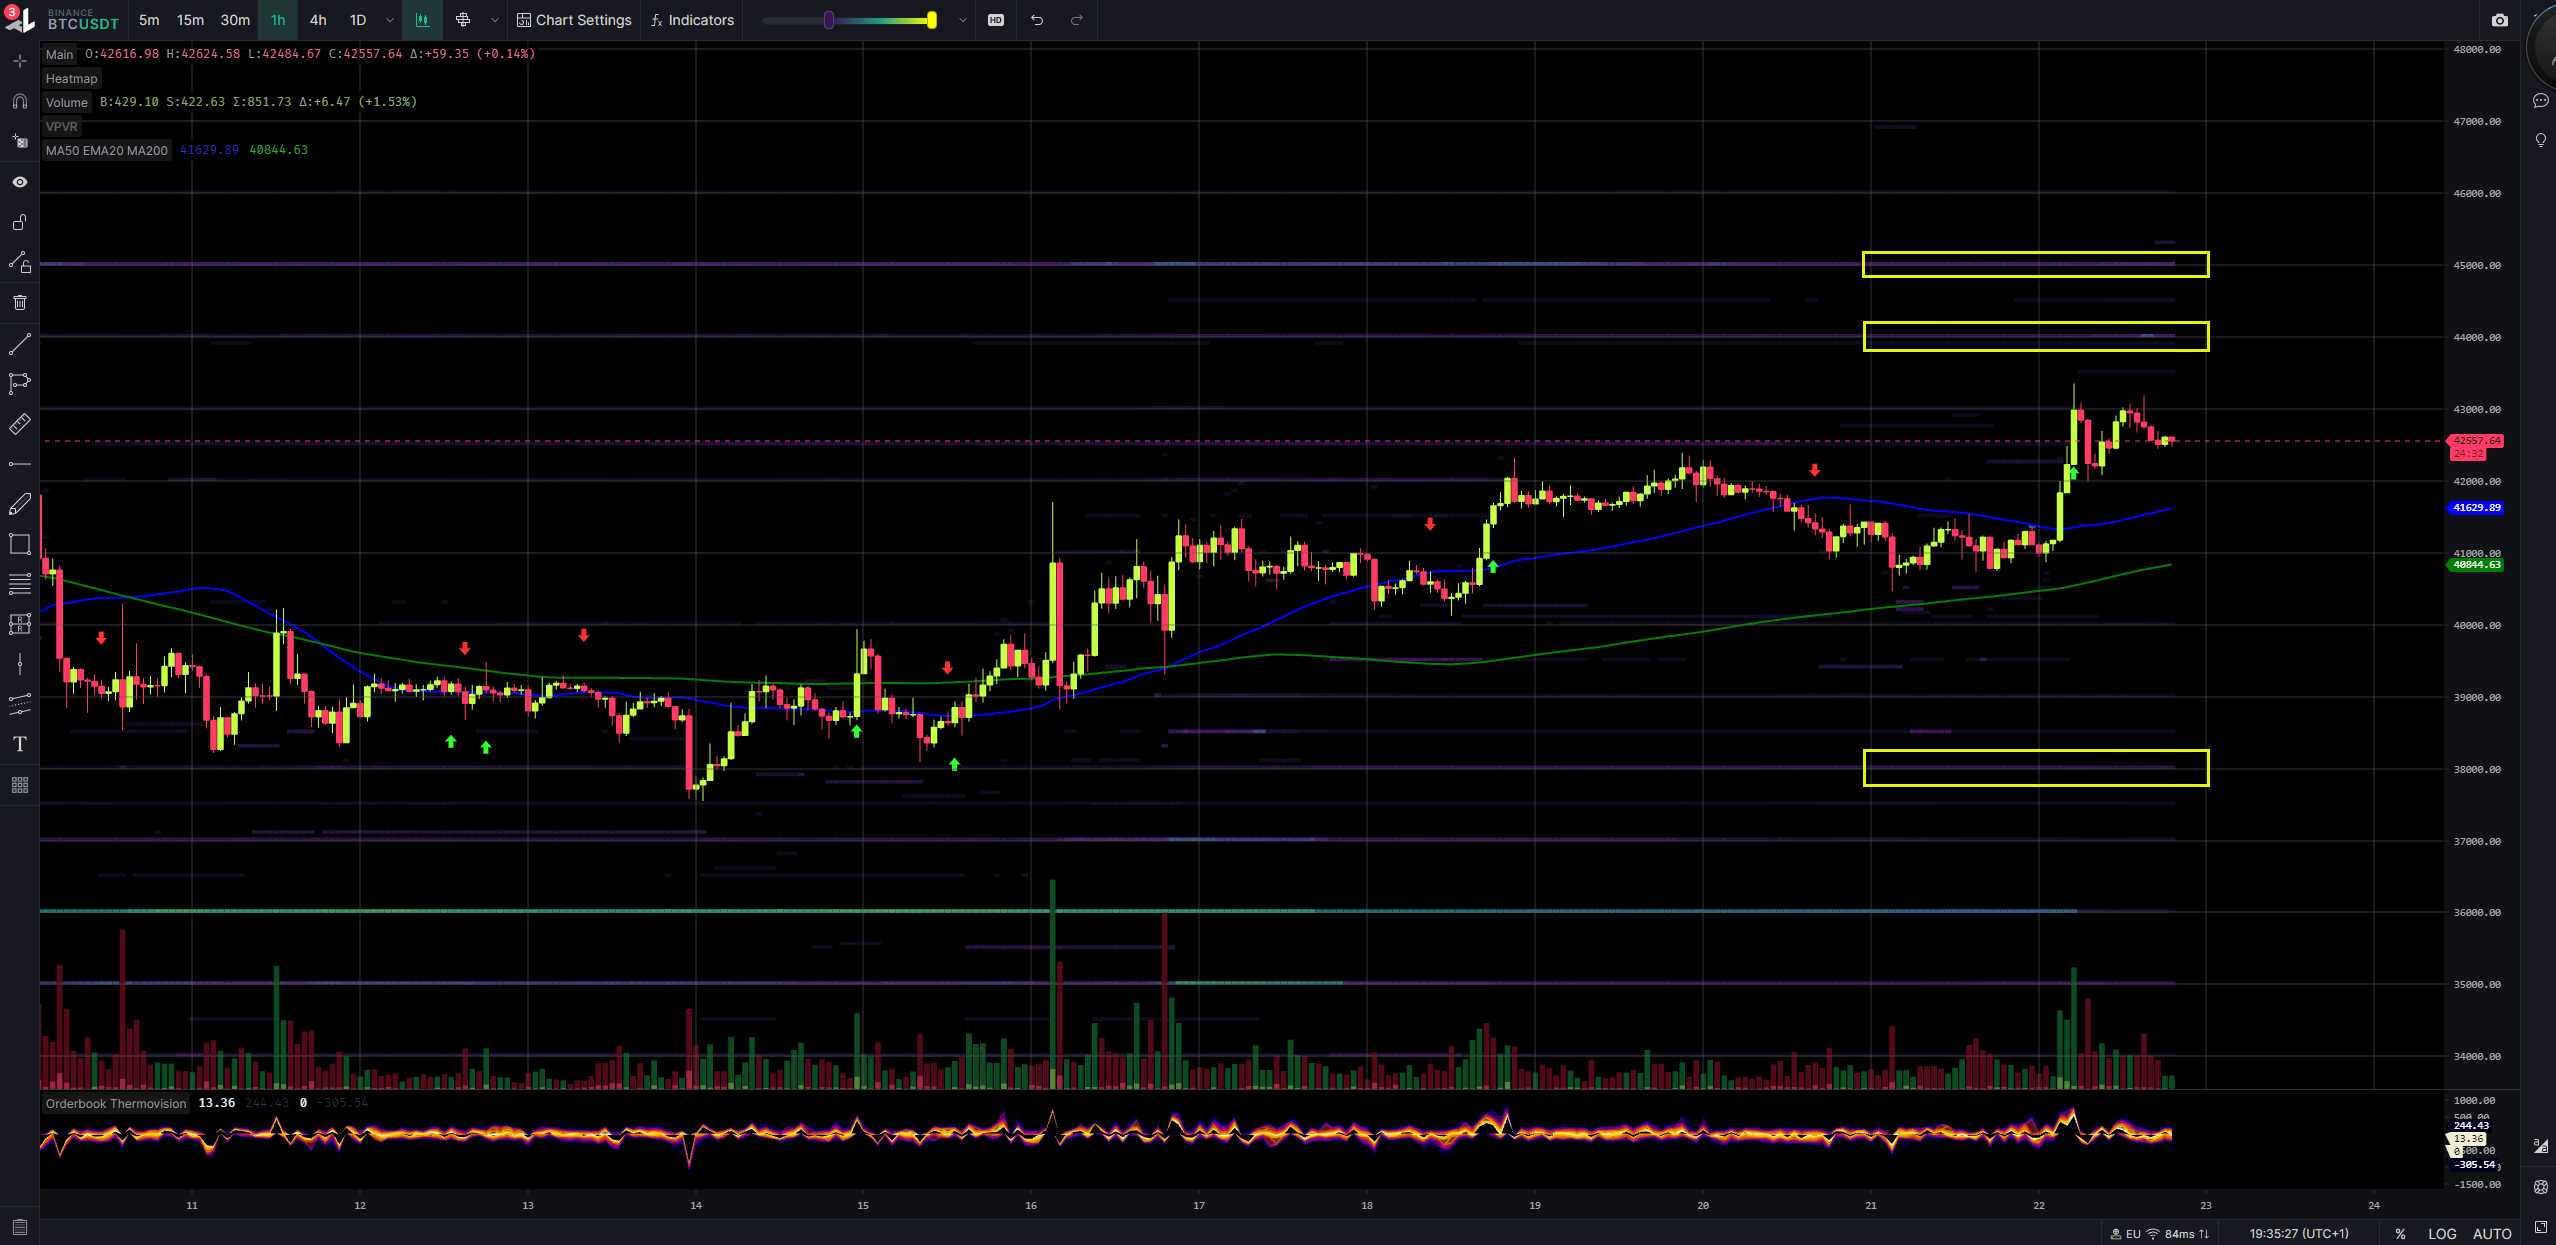
Binance limiting the way up at 44k/45k and limiting the way down at 38k.
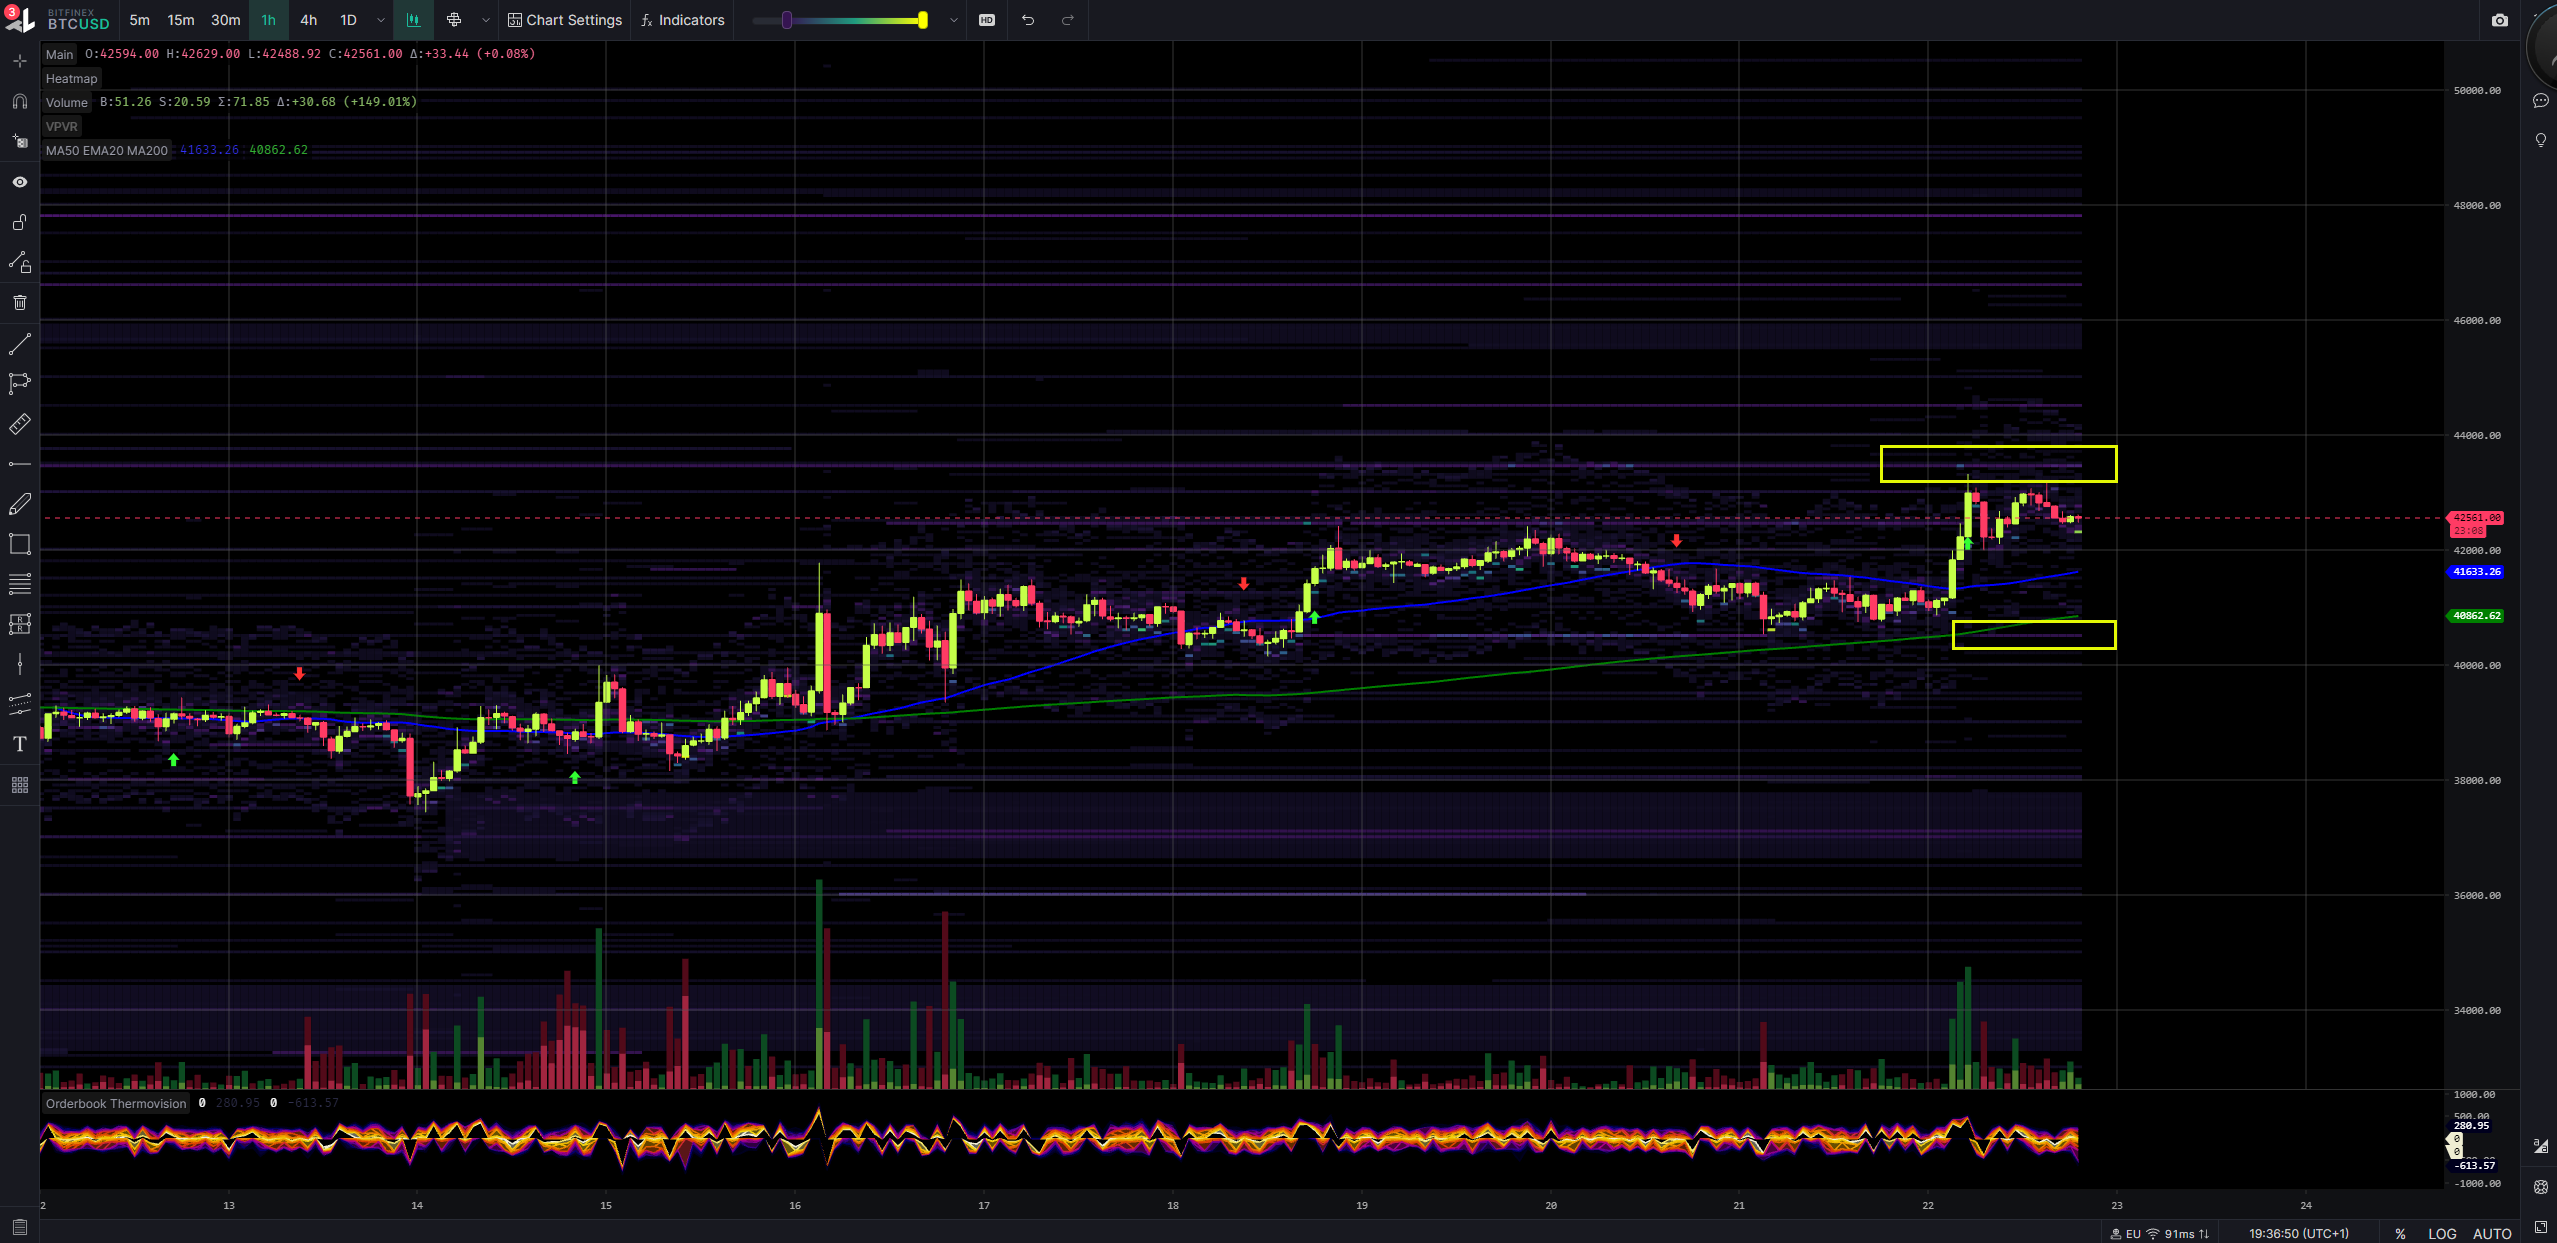
Bitfinex limiting the way up at 43.5k and the way down at 40.5k. No big volume walls detected.
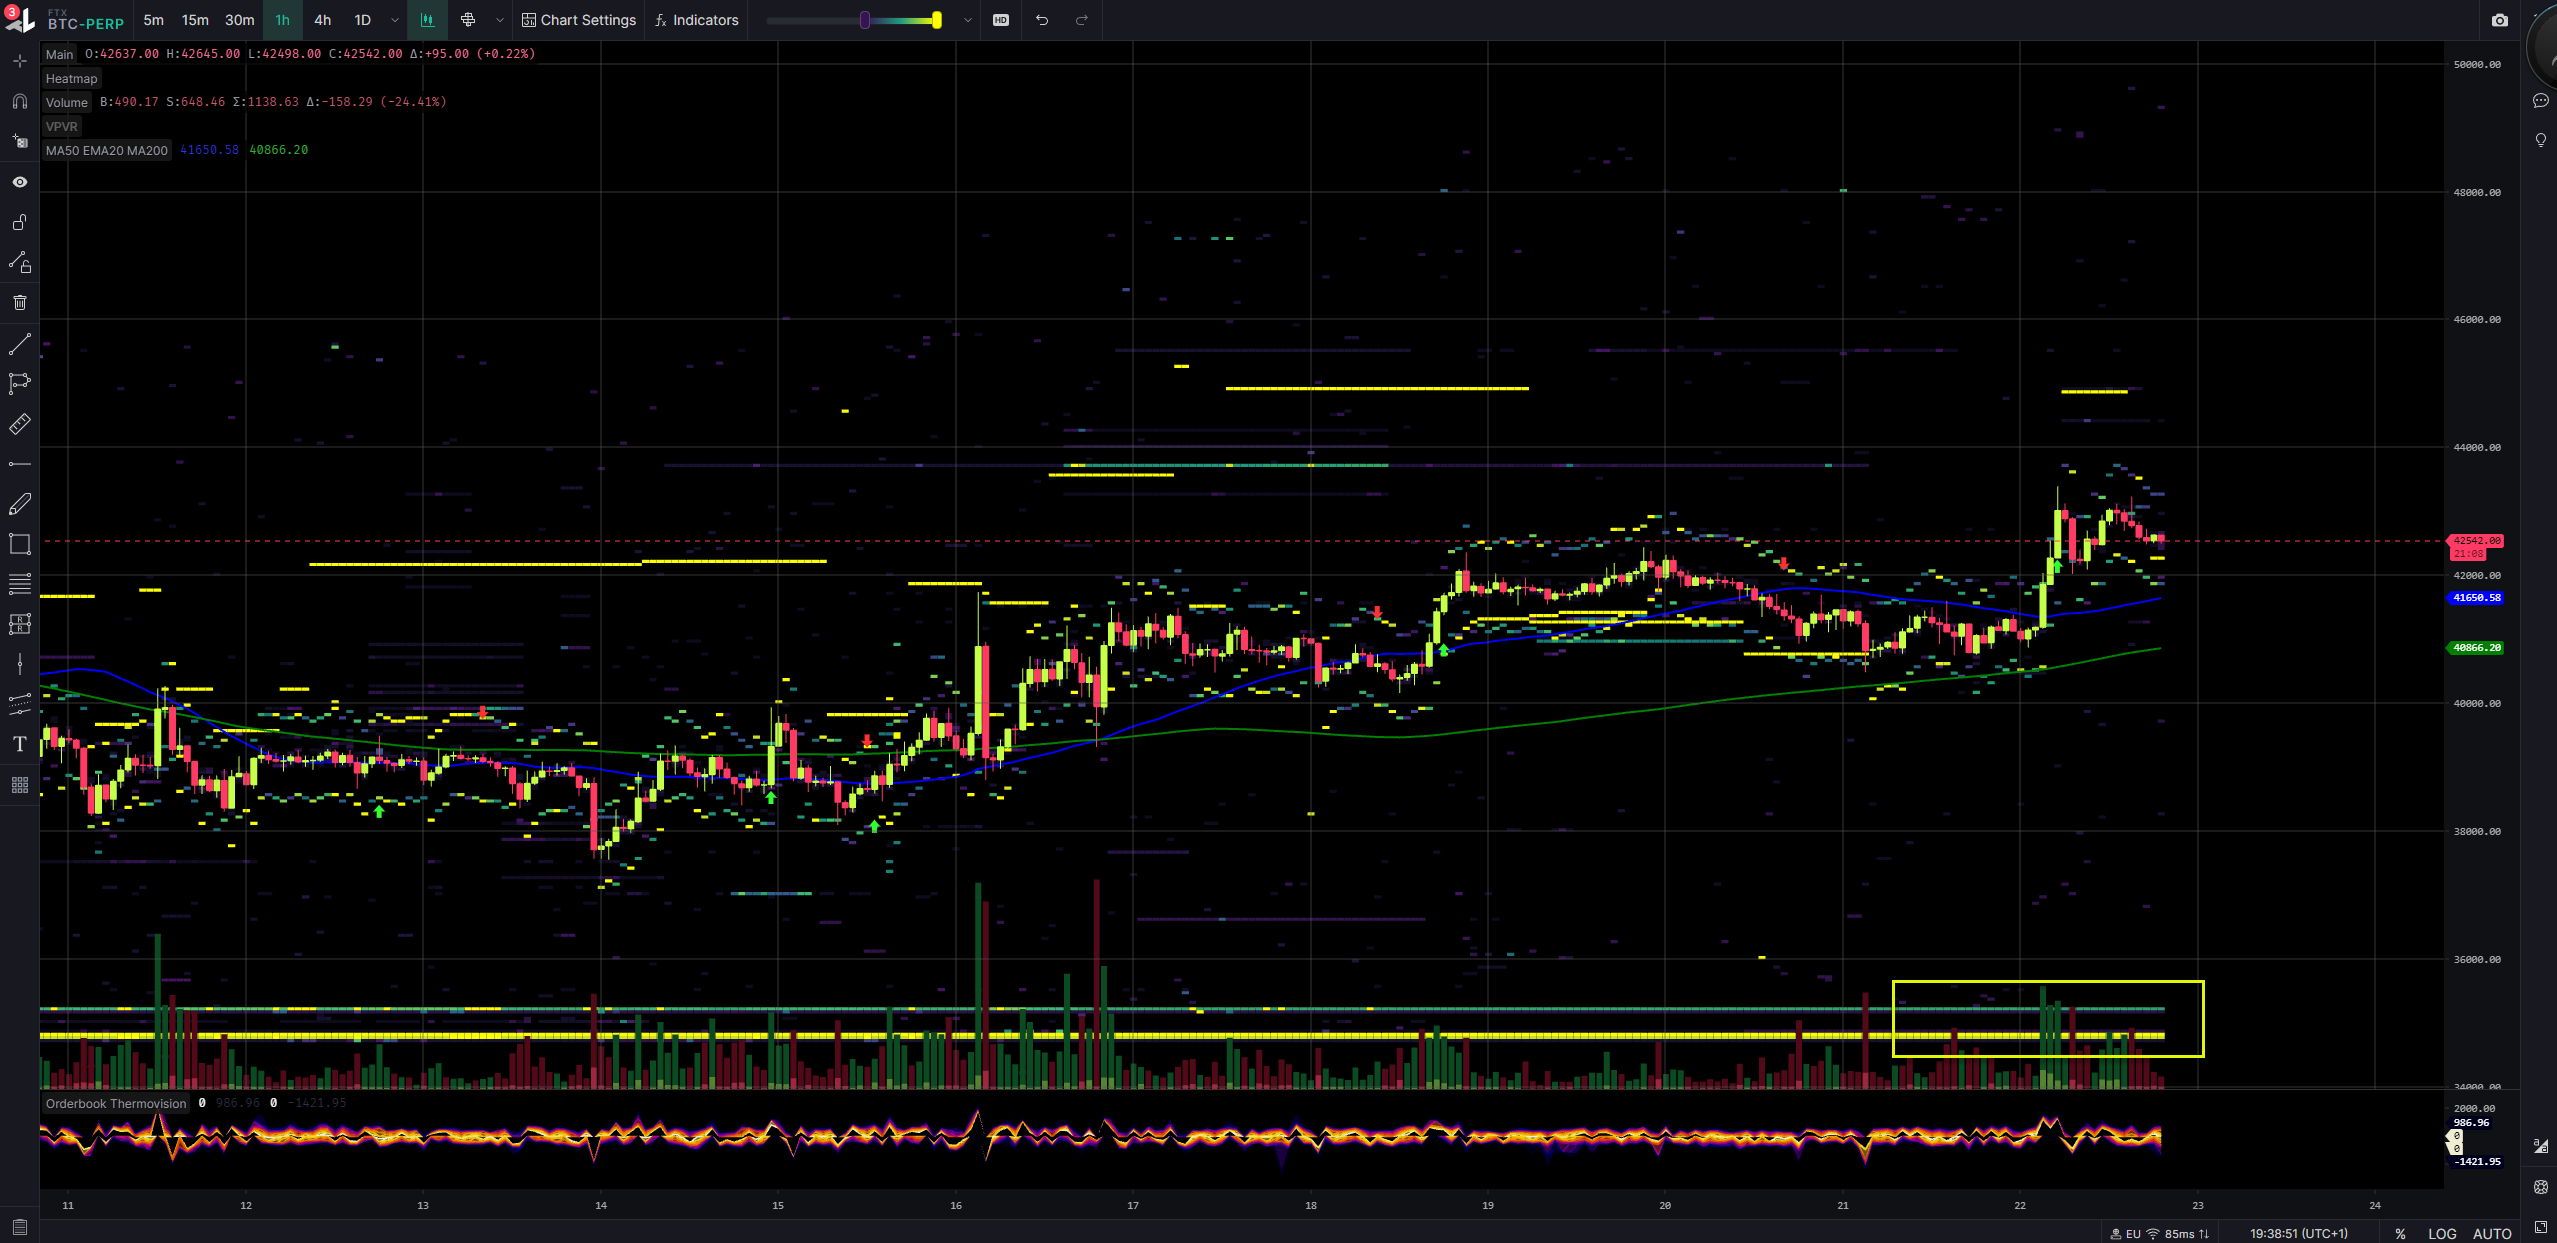
FTX Perp limiting the way down at 35.2k.
Additional exchanges without charts
Kraken limiting the way up at 43.5k while Binance Futures limiting the way up at 43.8k and Okex Futures at 44.5k.
Inspos Conclusion: At the moment 43.5k looks like local top and 38k-40k local bottom in case we start to dump.
URL to chart: https://www.tradinglite.com/
Inspos Conclusion and personal trade strategy
Still missing solid bullish signals. Short-term its possible to lift up a bit more, but based on on-chain data, accumulation/distribution, future trading, option trading and walls I think we reached again our local top. We should maintain our current level a bit to distribute all the tokens and when we are done I would expect a big dump due the high GEX and leverage ratio related to futures. Market Makers like to make the opposite of what market actors expect, in particular related to option trading.
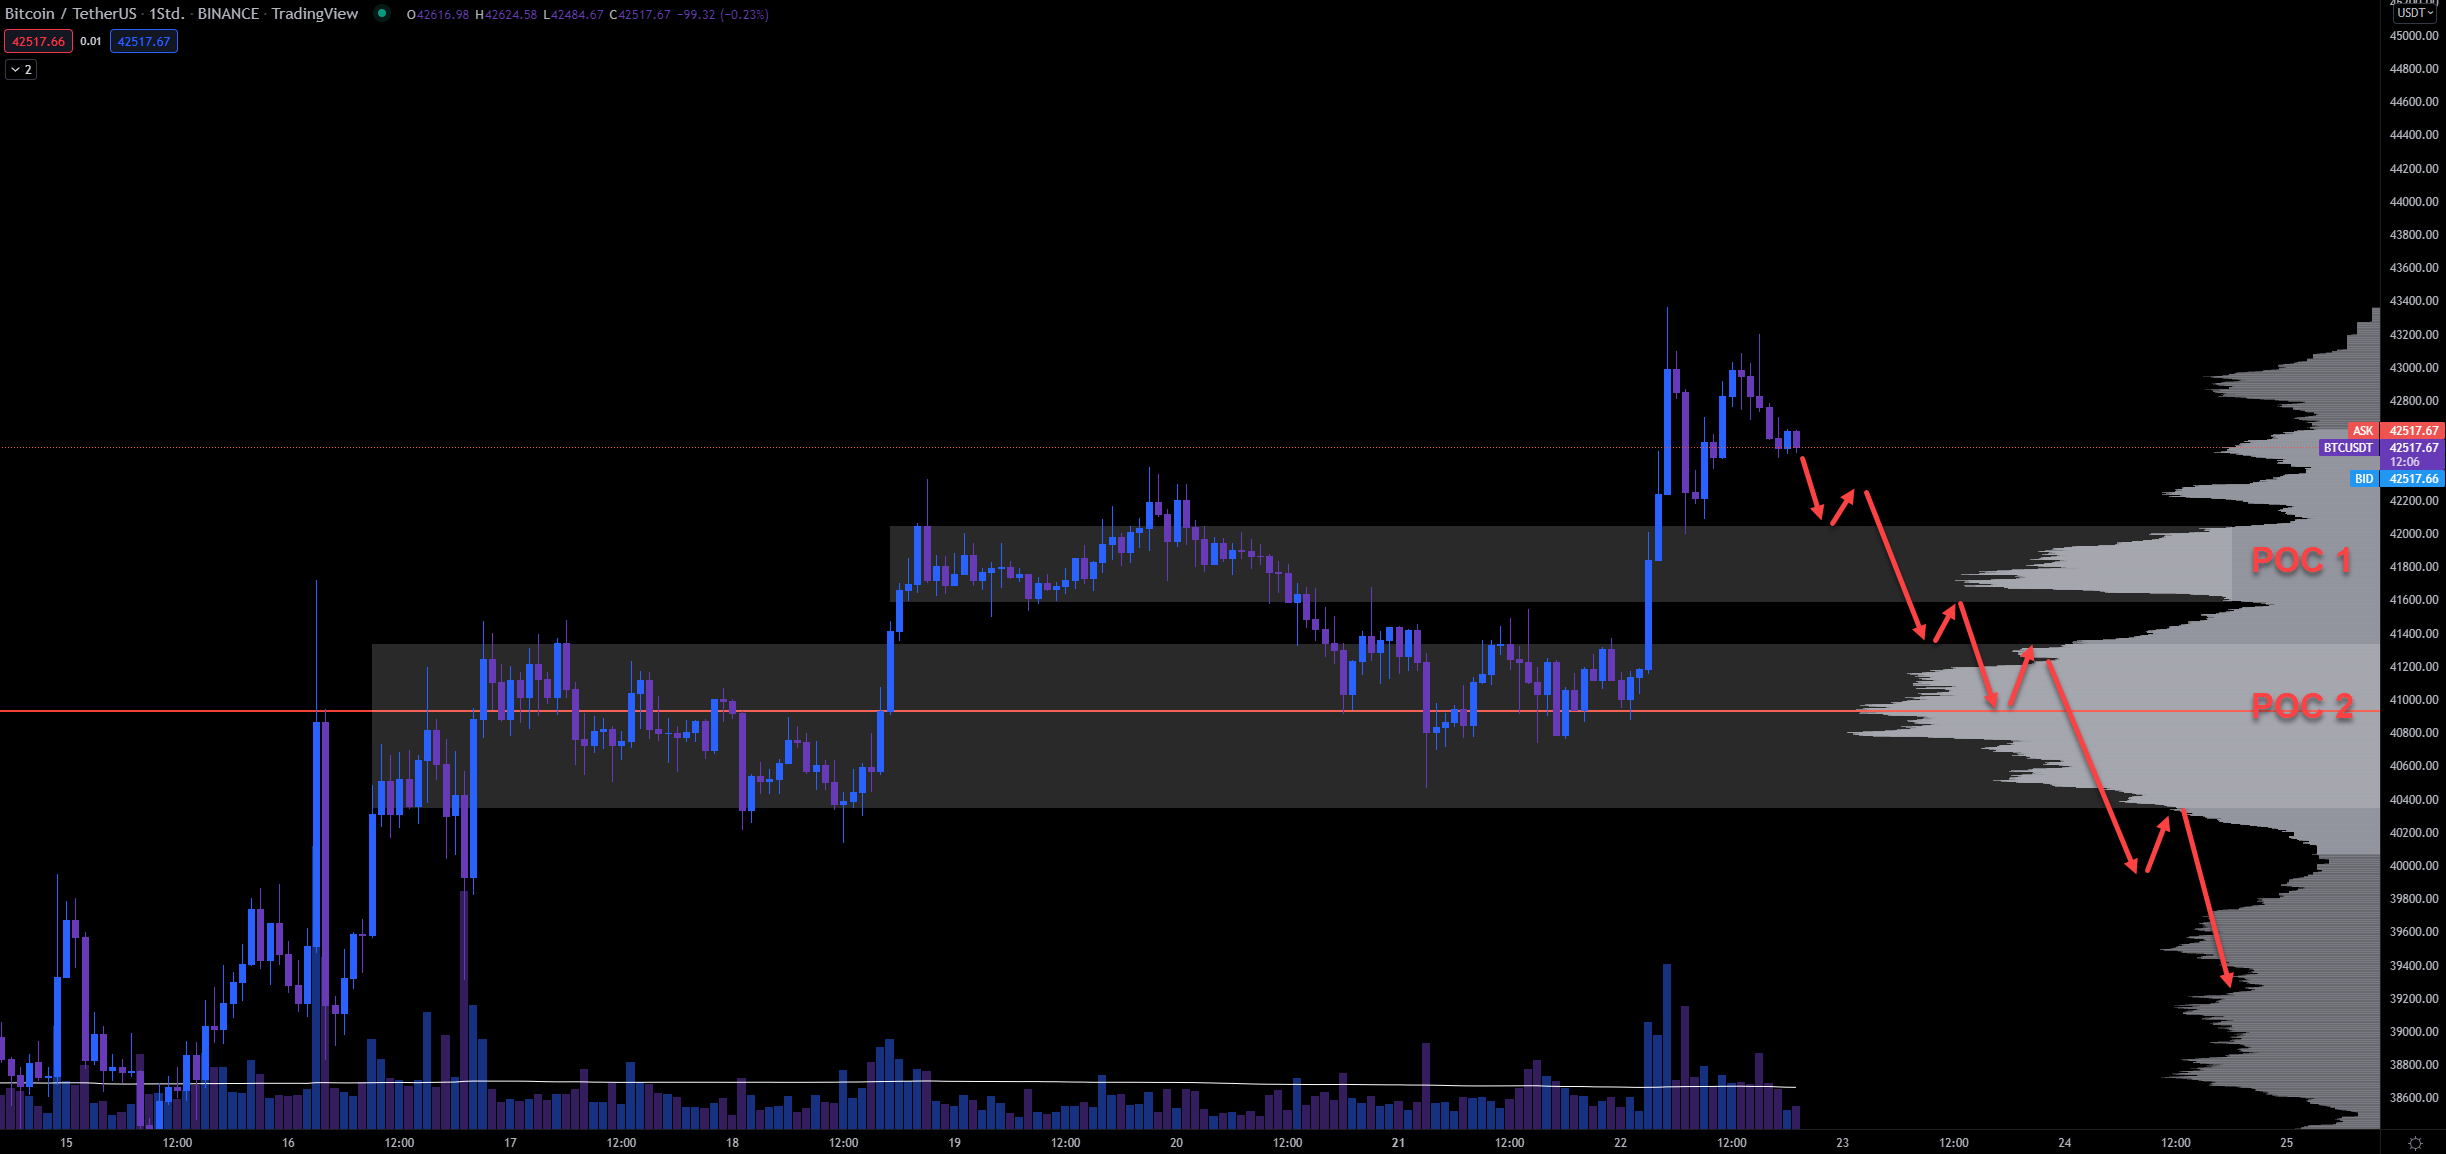
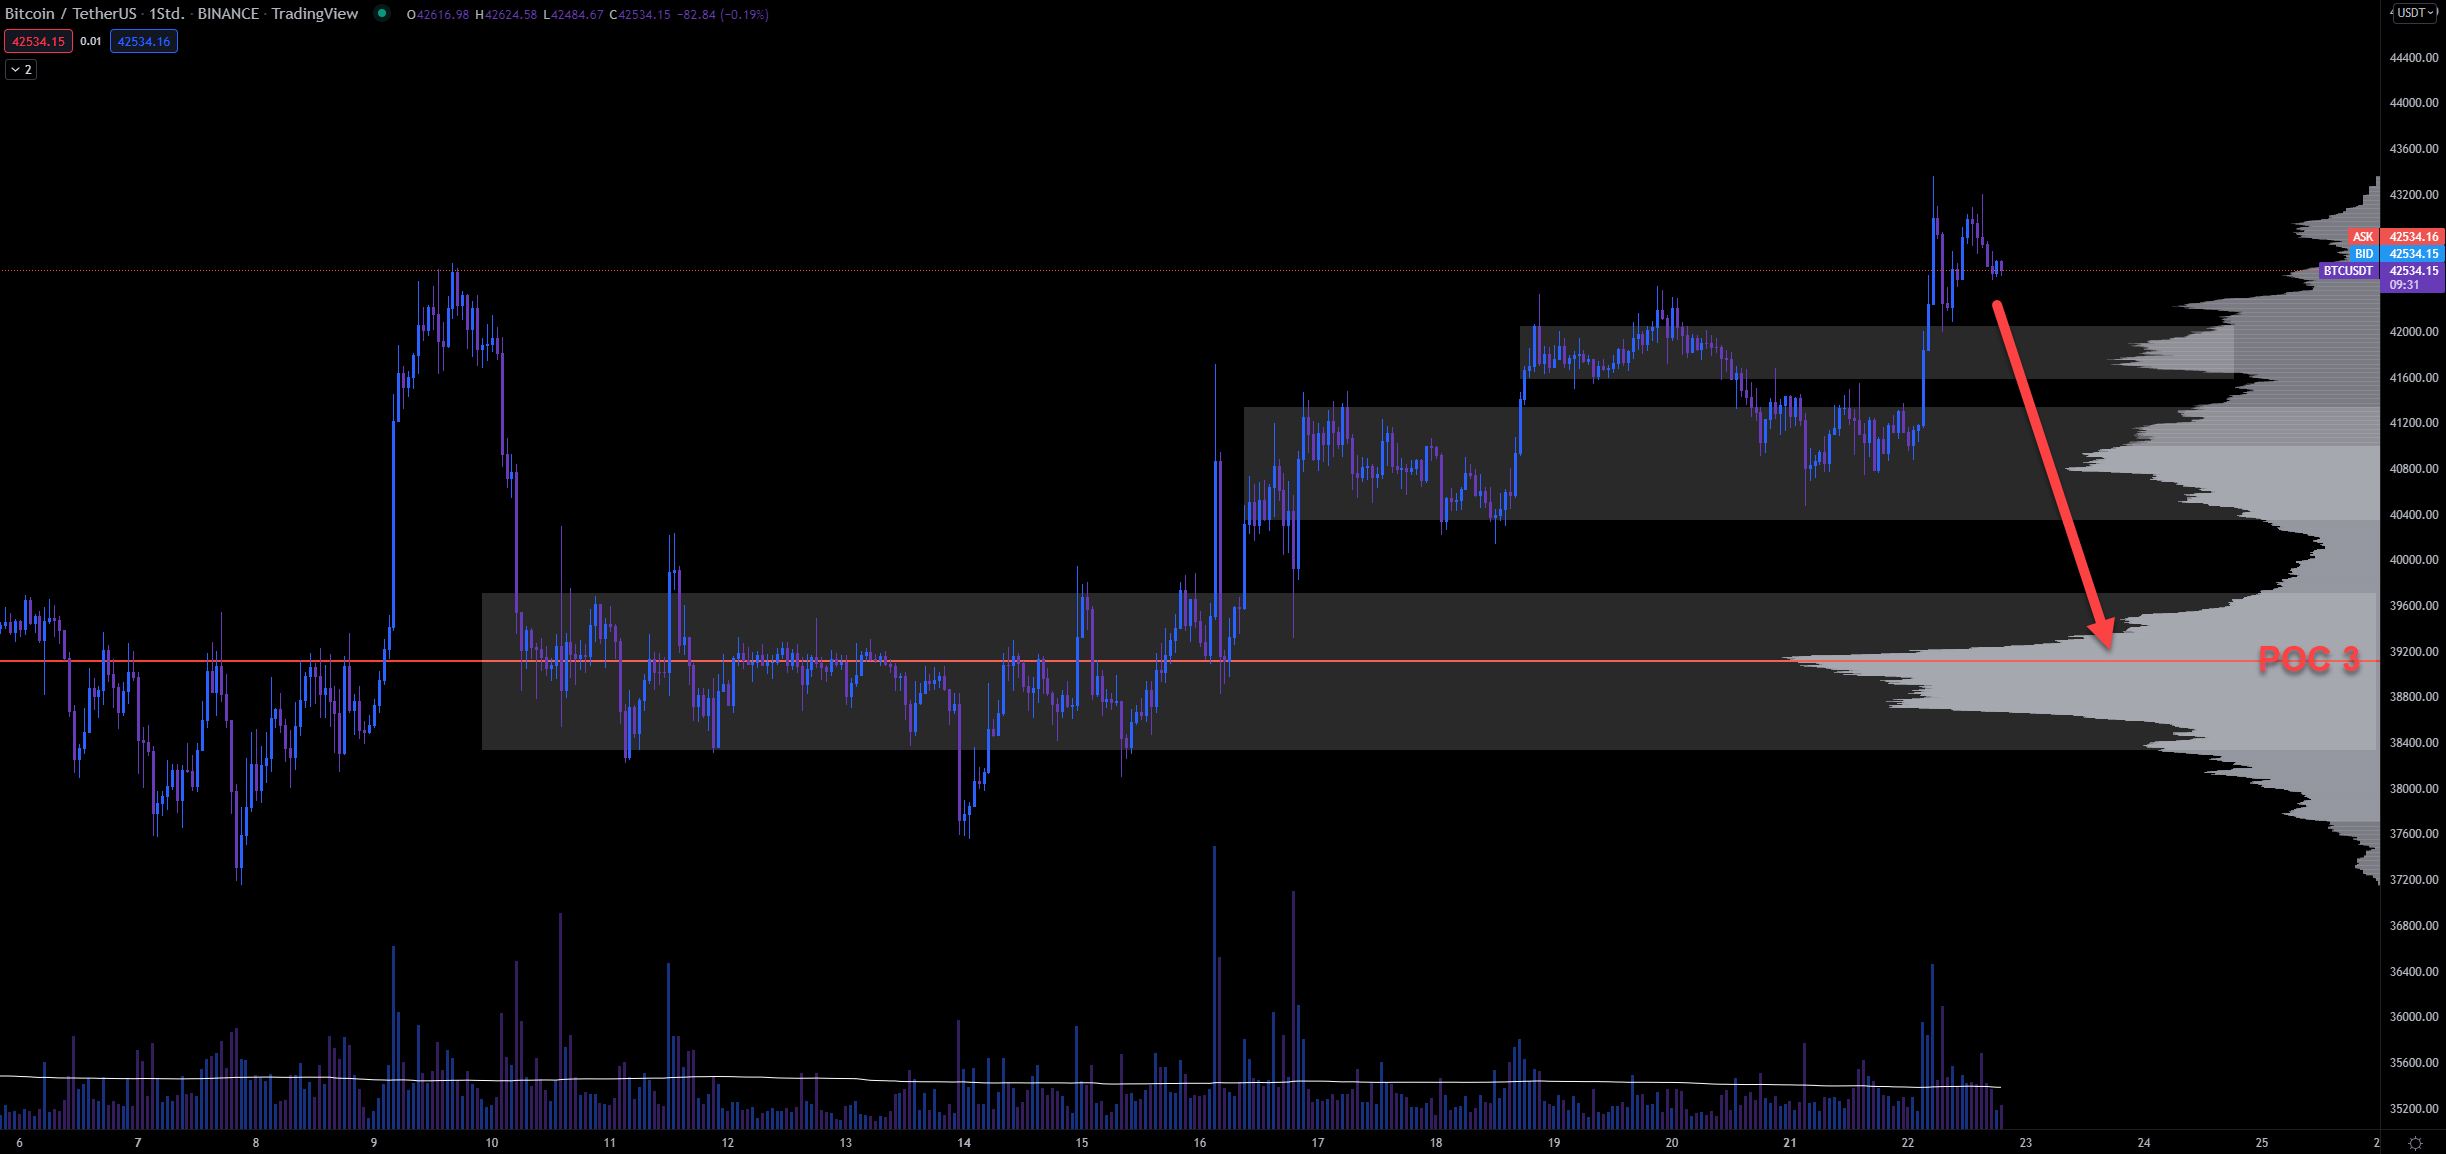
In case we dump I would expect POC 1 first. Maintain there and retest resistance (42k) and support (41.6k). In case we drop more POC 2 should be our destination. Also here, a retest of resistance (41.3k) and support (40.3k). If we are very bearish and we drop even more, POC 3 should be the level where we retrace due the fact that we will find liquidity for sure there. We have here a resistance at 39.7k and a support at 38.3k.
It’s just my personal opinion and no financial advice! Always make your own conclusions.



Hello what is High GEX ?