Hourly View
Since sunday is our whales ratio (1) rising indicating an incoming sell pressure by whales. Correlates perfectly with the price action (2), showing the impact of the rising sell pressure. Our whales ratio 30h average (3) is also rising heading its top indicating big sell pressure coming. The consequence was a dead cat bounce from 41.5k to 42.5k as expected and mentioned in my analysis yesterday. Our netflow chart (4) shows several positive but also negative netflows since yesterday. At the end I would say it’s almost neutral. Just last hour we have detected a big negative netflow (more outflows than inflows) of almost 3,670 BTC.
URL to chart: https://cryptoquant.com/prochart/vYNO3z1cx9LcSvg
Block View
As usual our blockview time frame give us a better overview of what is happening. As you can see here too, the whales ratio correlates well with the price action. Whales ratio (1) have started to rise yesterday evening close after we have started to lift up heading ouut local top at 42.5k and has started to retrace heading our current price level due the rising sell pressure. Also our whales ratio 30block average (2) is showing a much better correlation between the indicator and price action. Our netflow chart (3) shows here what happend since midnight. Exchanges has received more tokens related to whales, the netflow chart shows almost 1,700 BTC positive netflow within 90 minutes and directly afterwards we have detected big negative netflows of almost 3,900 BTC indicating big outflows. As long as we have such negative netflows I’m not expecting big dumps to lower price ranges below 38k as many expect.
URL to chart: https://cryptoquant.com/prochart/vYNO3z1cx9LcSvg
Option Trading
Expiry 21JAN22
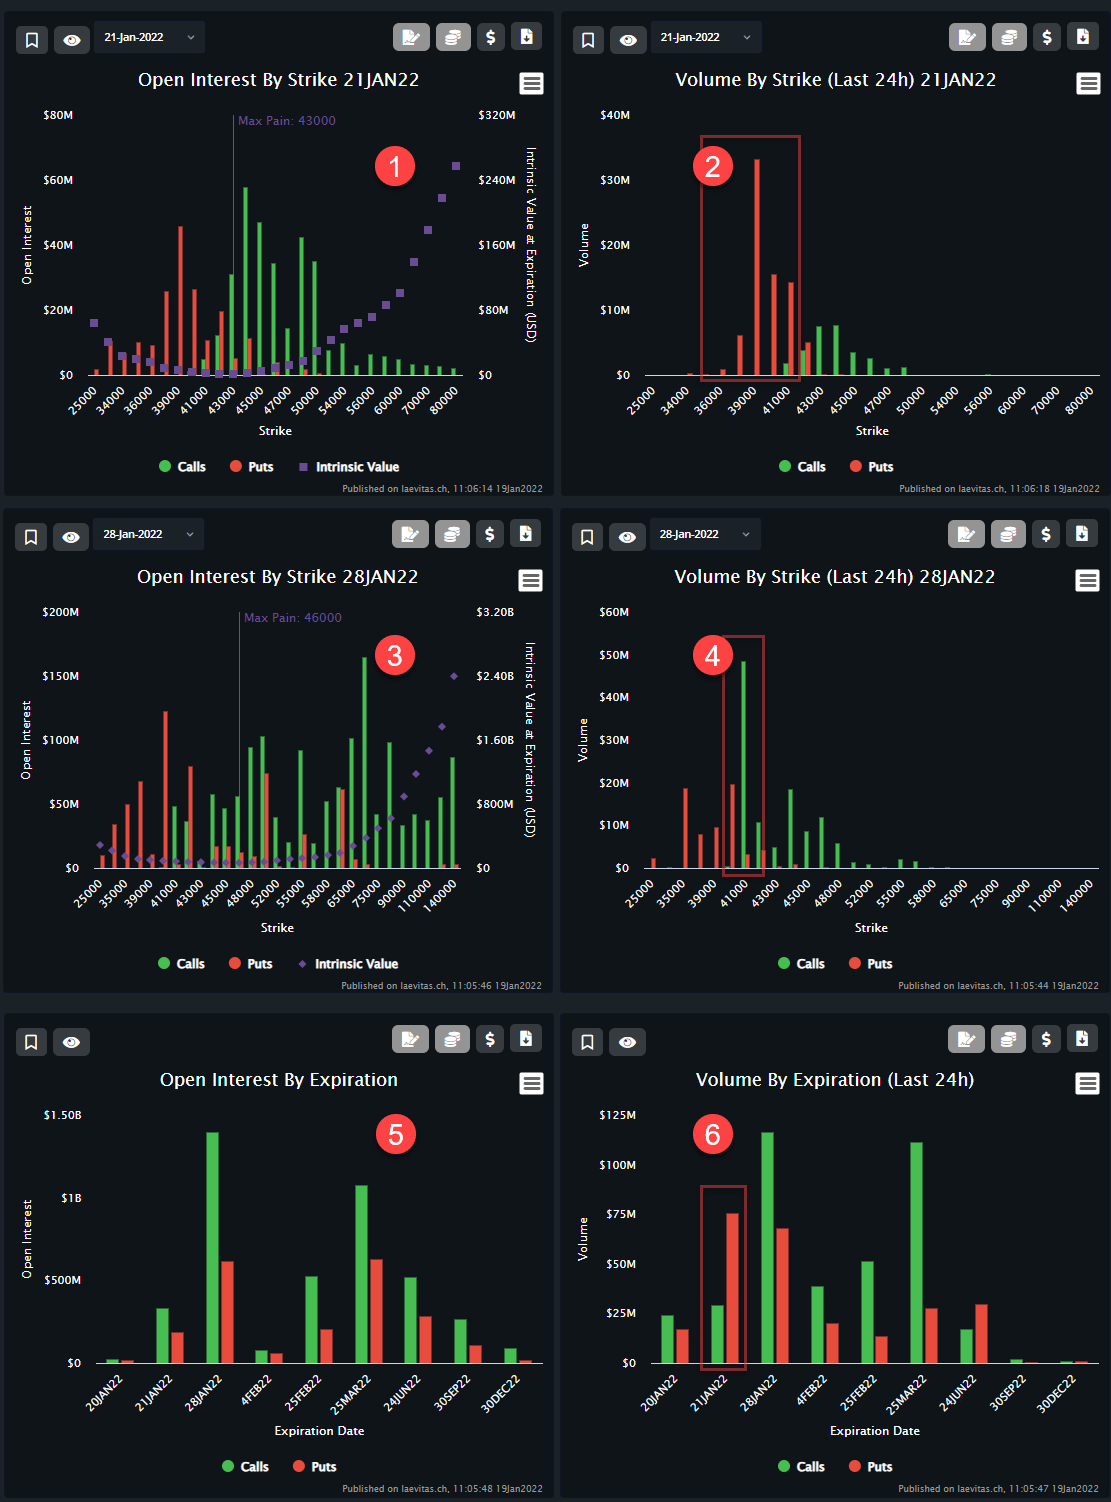
Our max pain here is still 43k (1). The biggest Open Interest by Strike is still at 44k with $57.7 million (- $2 million since yesterday) in Calls and $45.78 million in Puts at 39k. It seems that some Put traders are expecting more dump until this expiry. Not really bullish.
That matches with the volume within 24h. We have received $33.19 million (2) in Puts at 39k since yesterday as the biggest trade indicating a bearish trend.
In our Volume by Expiration (24h) (6) we can see the big red bar indicating more Puts as Calls traded for this expiry.
Expiry 28JAN22
Bad news here. Our max pain (3) for this expiry has dropped from 48k to 46k since yesterday indicating also here a bearish trend. Even if we can detect a big volume in Calls (Last 24h) (4), $48.36 million in Calls at 41k. The only bullish thing here, they expect a price above of 41k until end of the month. In my opinion that’s not really bullish too.
However, even if more Puts (6) are arriving related to the 28Jan22 expiry, we have still a higher Open Interest in Calls than in Puts (5). That’s at least a bullish sign.
URL to App: https://app.laevitas.ch/dashboard/btc/deribit/options/activity/overview
Future Trading
Daily View
Future trading is not showing any big changes again. The Leverage Ratio (1) keeps rising, but the Funding rate didn’t really move yesterday and has maintained its level.
URL to chart: https://cryptoquant.com/prochart/h5G7kAg6yAM9hRC
Hourly View
Only if we zoom in we can detect some useful information for our trade strategy. Funding Rate (1) is rising and it has leaved its negative Funding Rate to neutral, indicating that more Longs are arriving and so leaving the negative Funding Rate range, while the Leverage Ratio (2) is rising too. Indicating that more high leverage Longs are on the table now and that traders are expecting a pump soon. That could be a trap for them, if we keep dumping all these late high leverage longs will be liquidated and generate more sell pressure.
URL to chart: https://cryptoquant.com/prochart/h5G7kAg6yAM9hRC
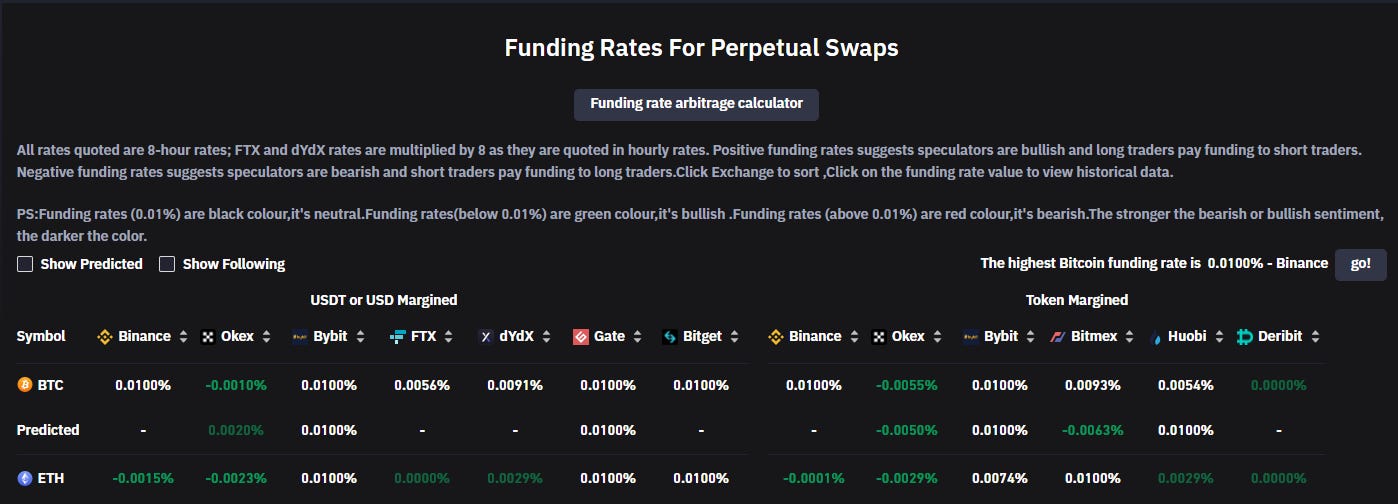
Also Coinglass confirms the observation described above. Funding rates of the last 8h are almost all neutral, except one that is a bit negative (Okex).
URL to App: https://www.coinglass.com/FundingRate
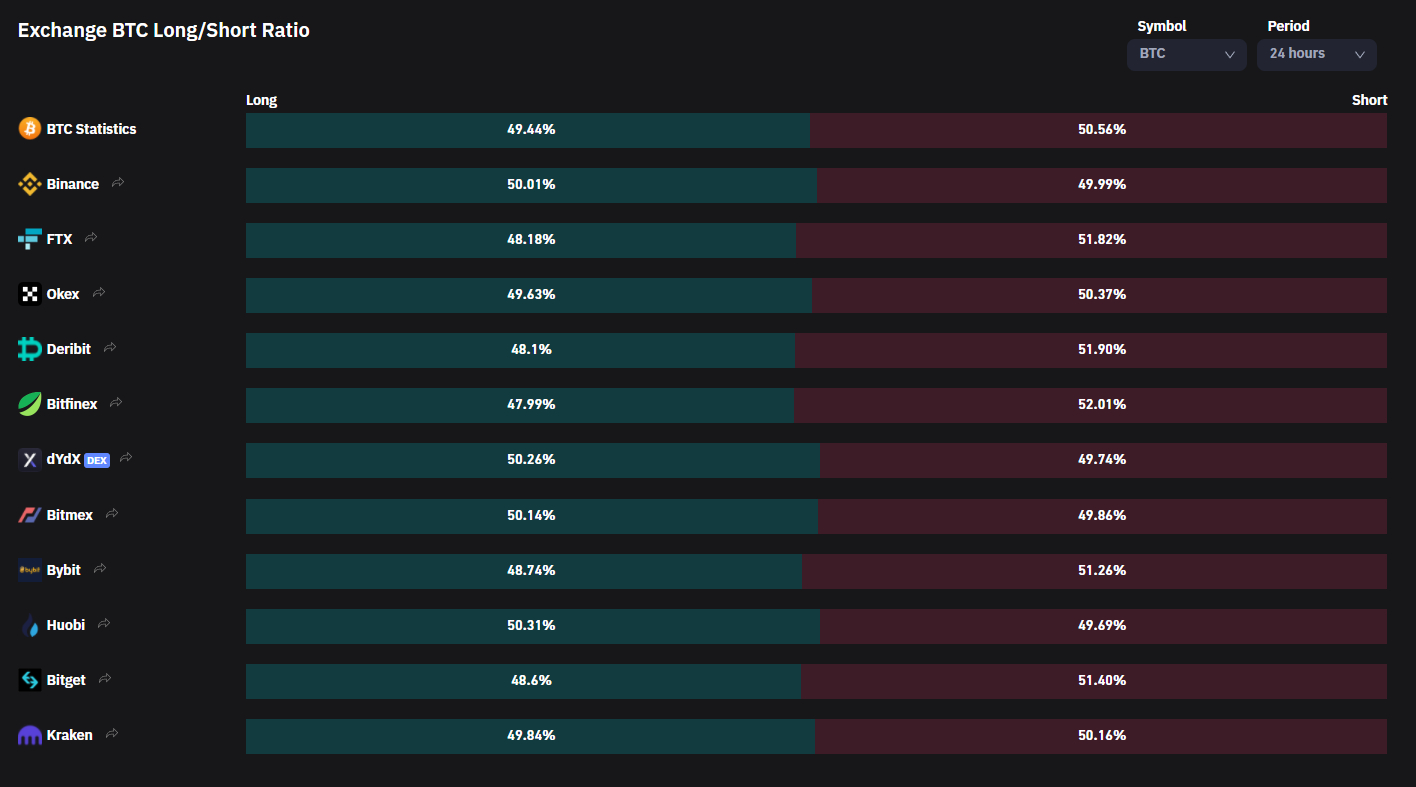
Also the Long/Short Ration of the last 24h confirms that more and more traders are placing longs now.
URL to App: https://www.coinglass.com/LongShortRatio
Market Activity
Block View
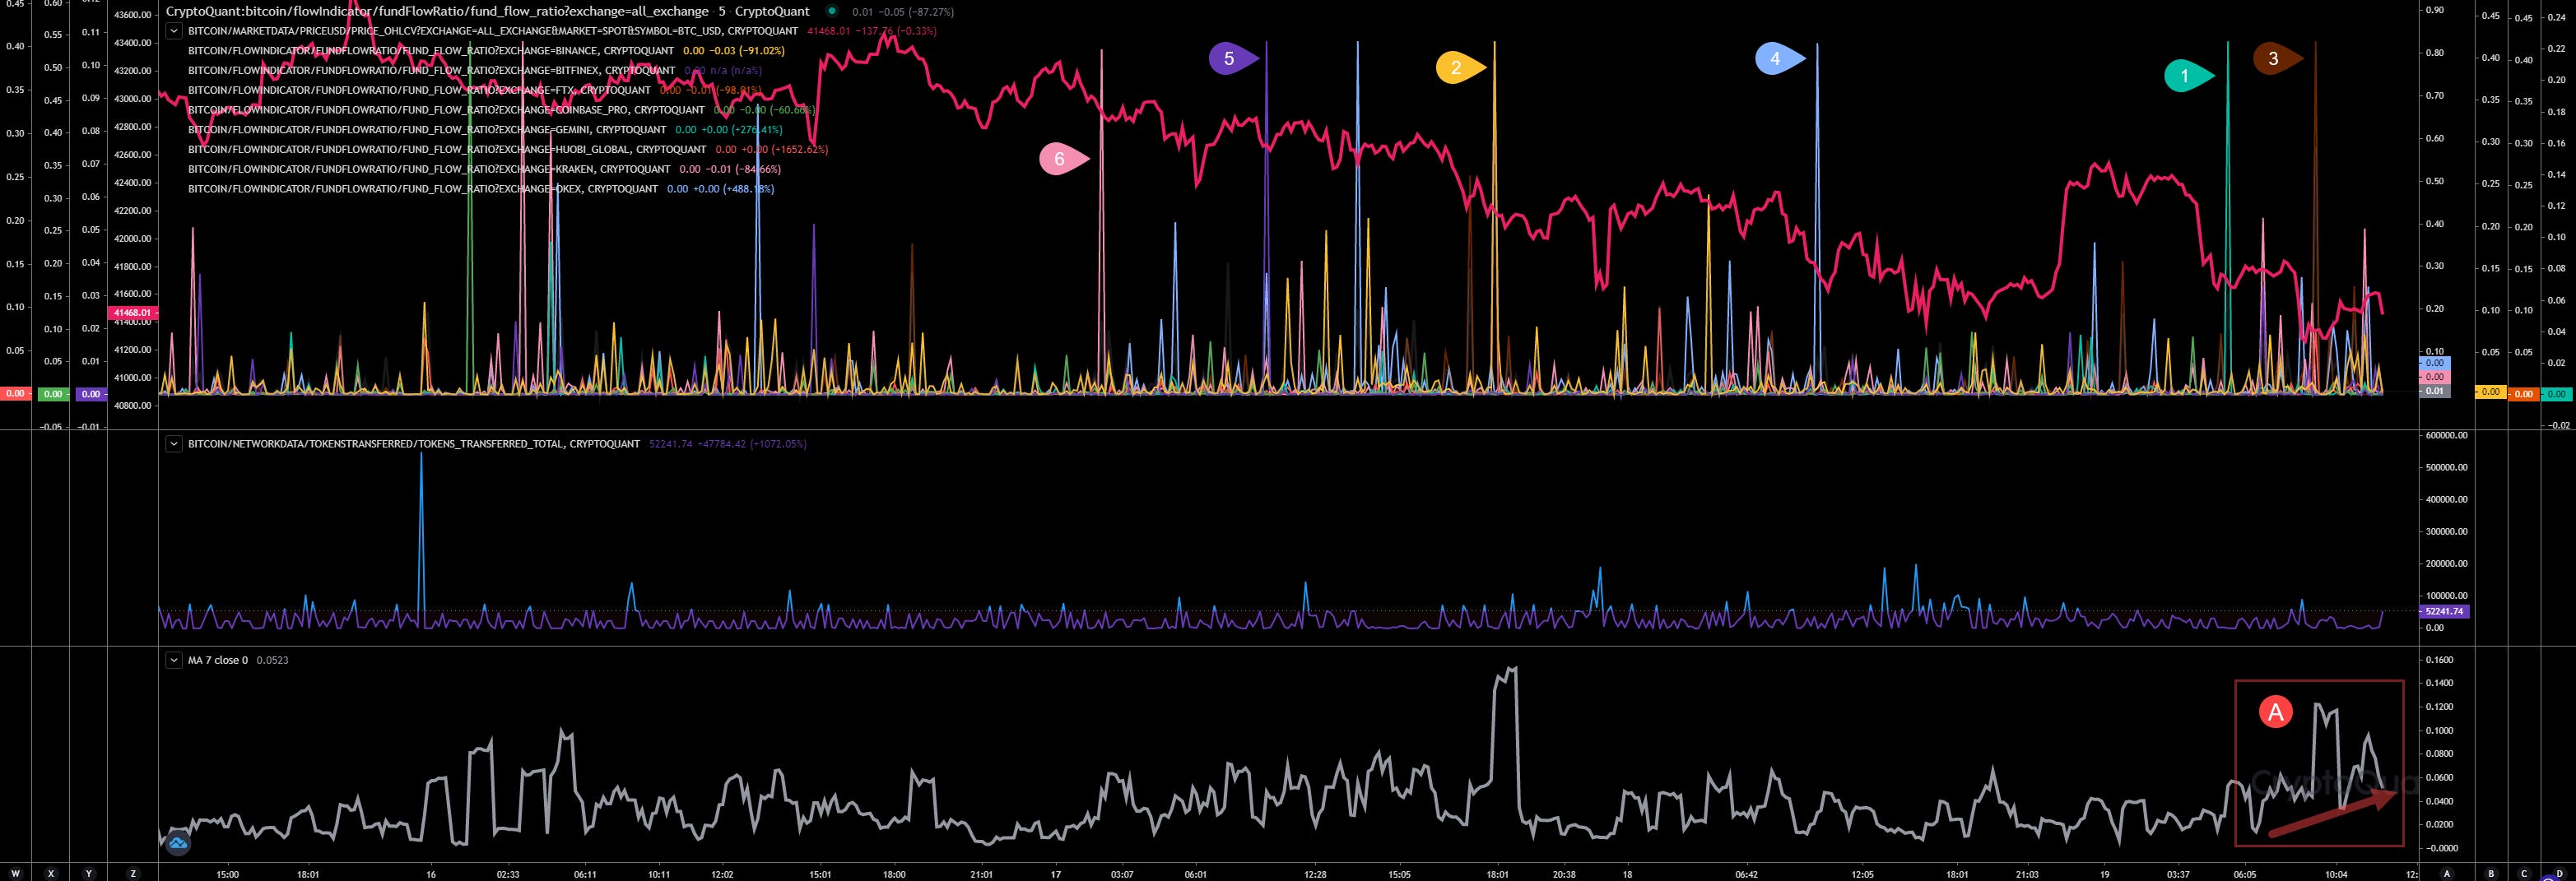
#1 - Gemini
#2 - Binance
#3 - FTX
#4 - Okex
#5 - Bitfinex
#6 - Kraken
Also here unfortunately nothing new. Binance is still the dump driver it seems. Its activity correlates with falling prices afterwards while the activity of other exchanges correlates with positive price action. Also interesting here, exchanges activity is rising right now (A) while the price is lifting up.
URL to chart: https://cryptoquant.com/prochart/MIV7FeYFXsE62DT
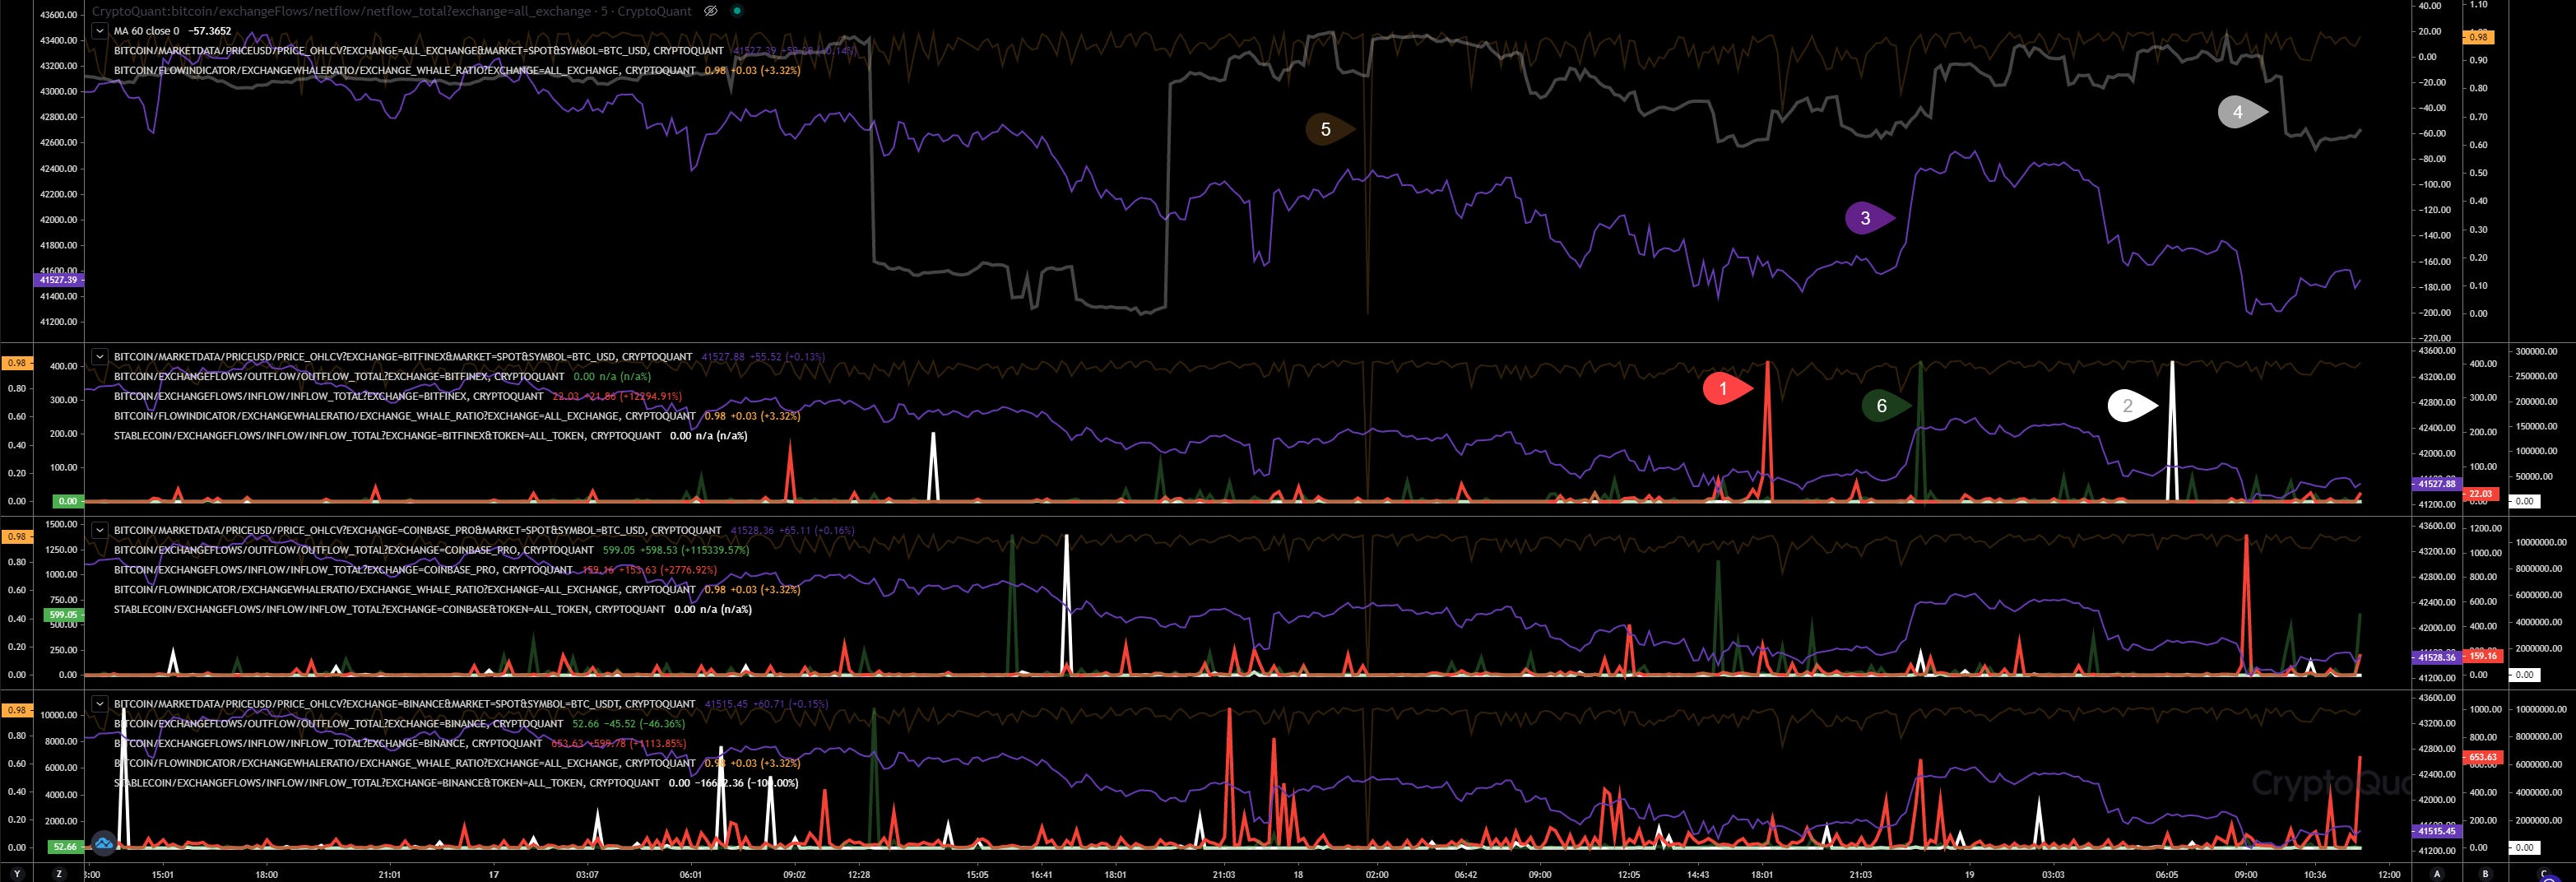
Exchange Activities
#1 - BTC Inflows
#2 - Stablecoin Inflows
#3 - BTC Price (USD)
#4 - Total Netflow
#5 - Total Whales Ratio
#6 - BTC Outflows
URL to chart: https://cryptoquant.com/prochart/5orKIwFerljHvhr
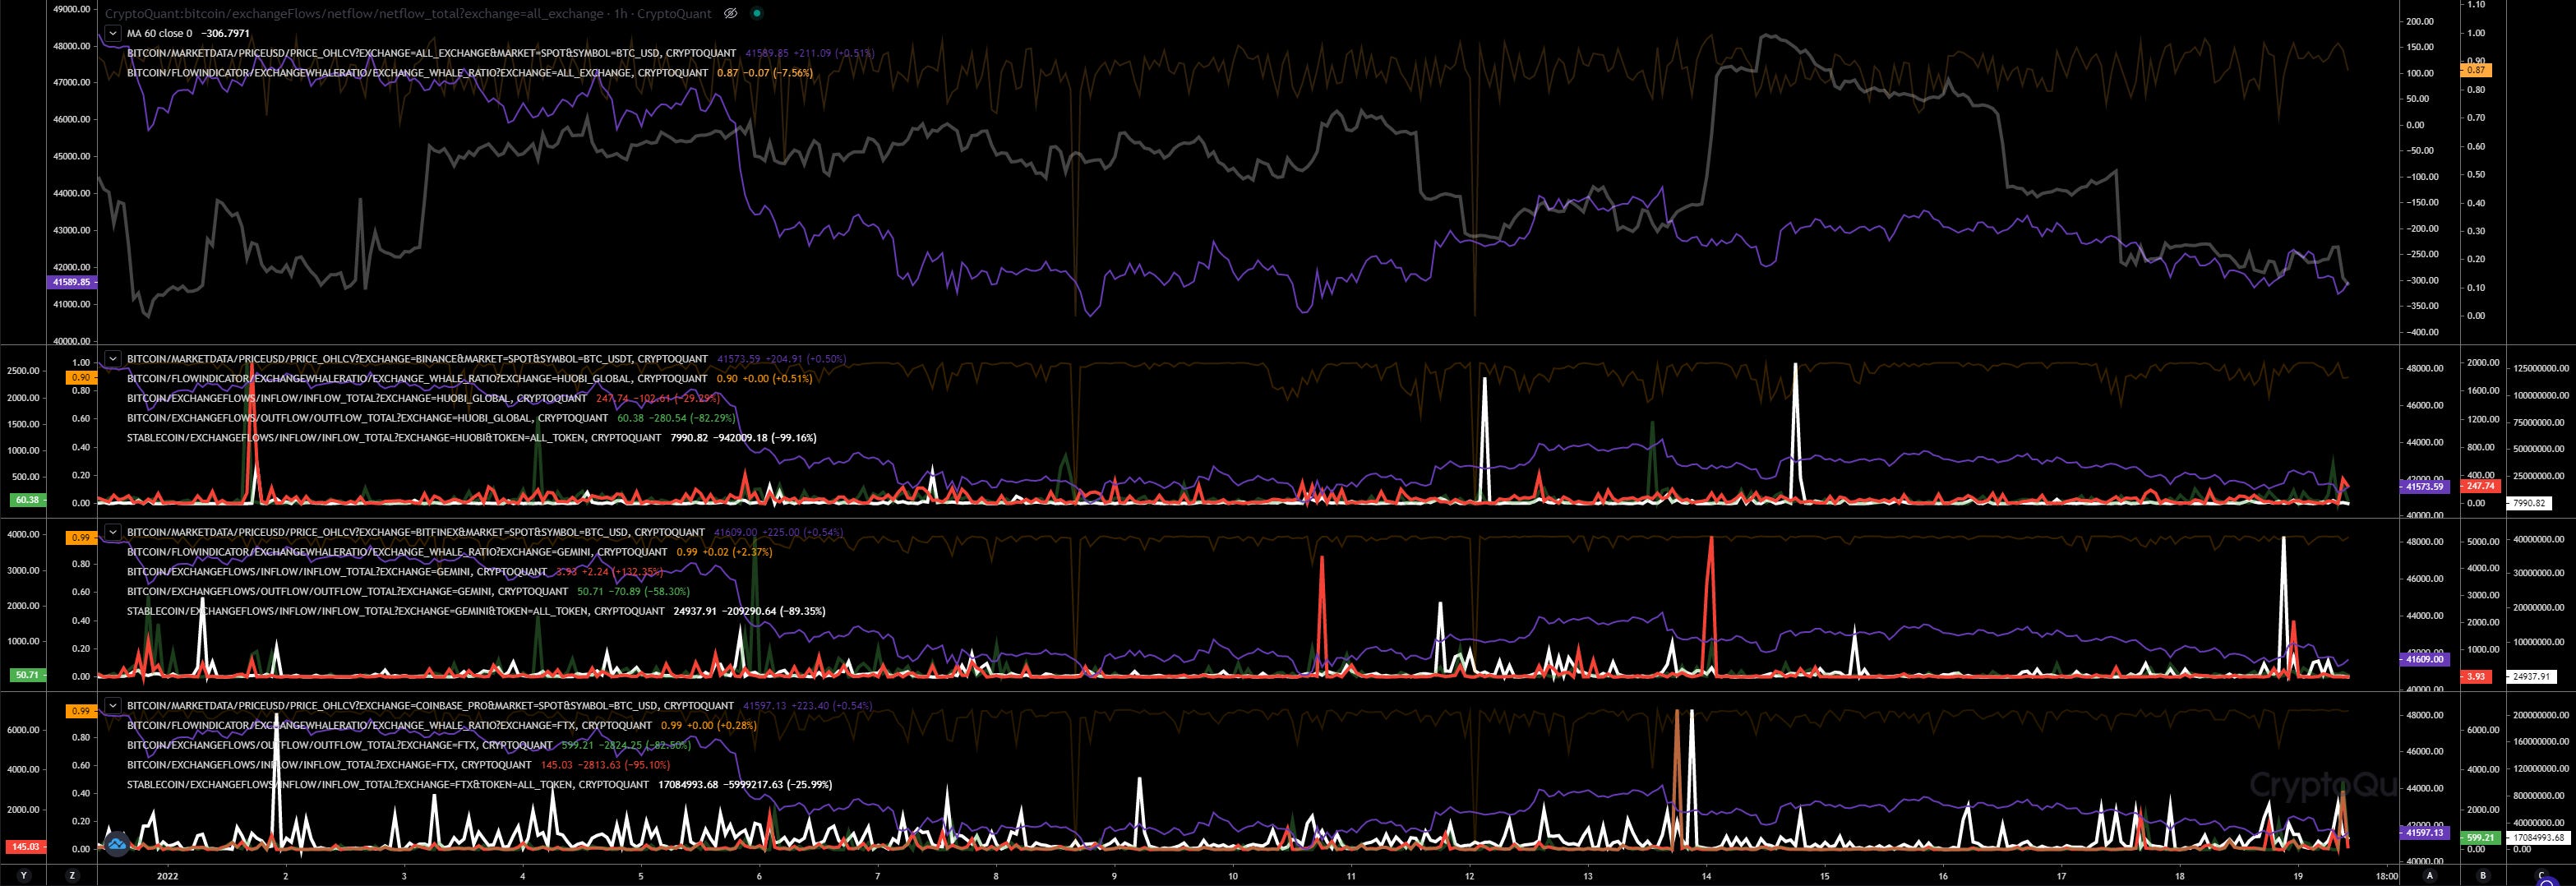
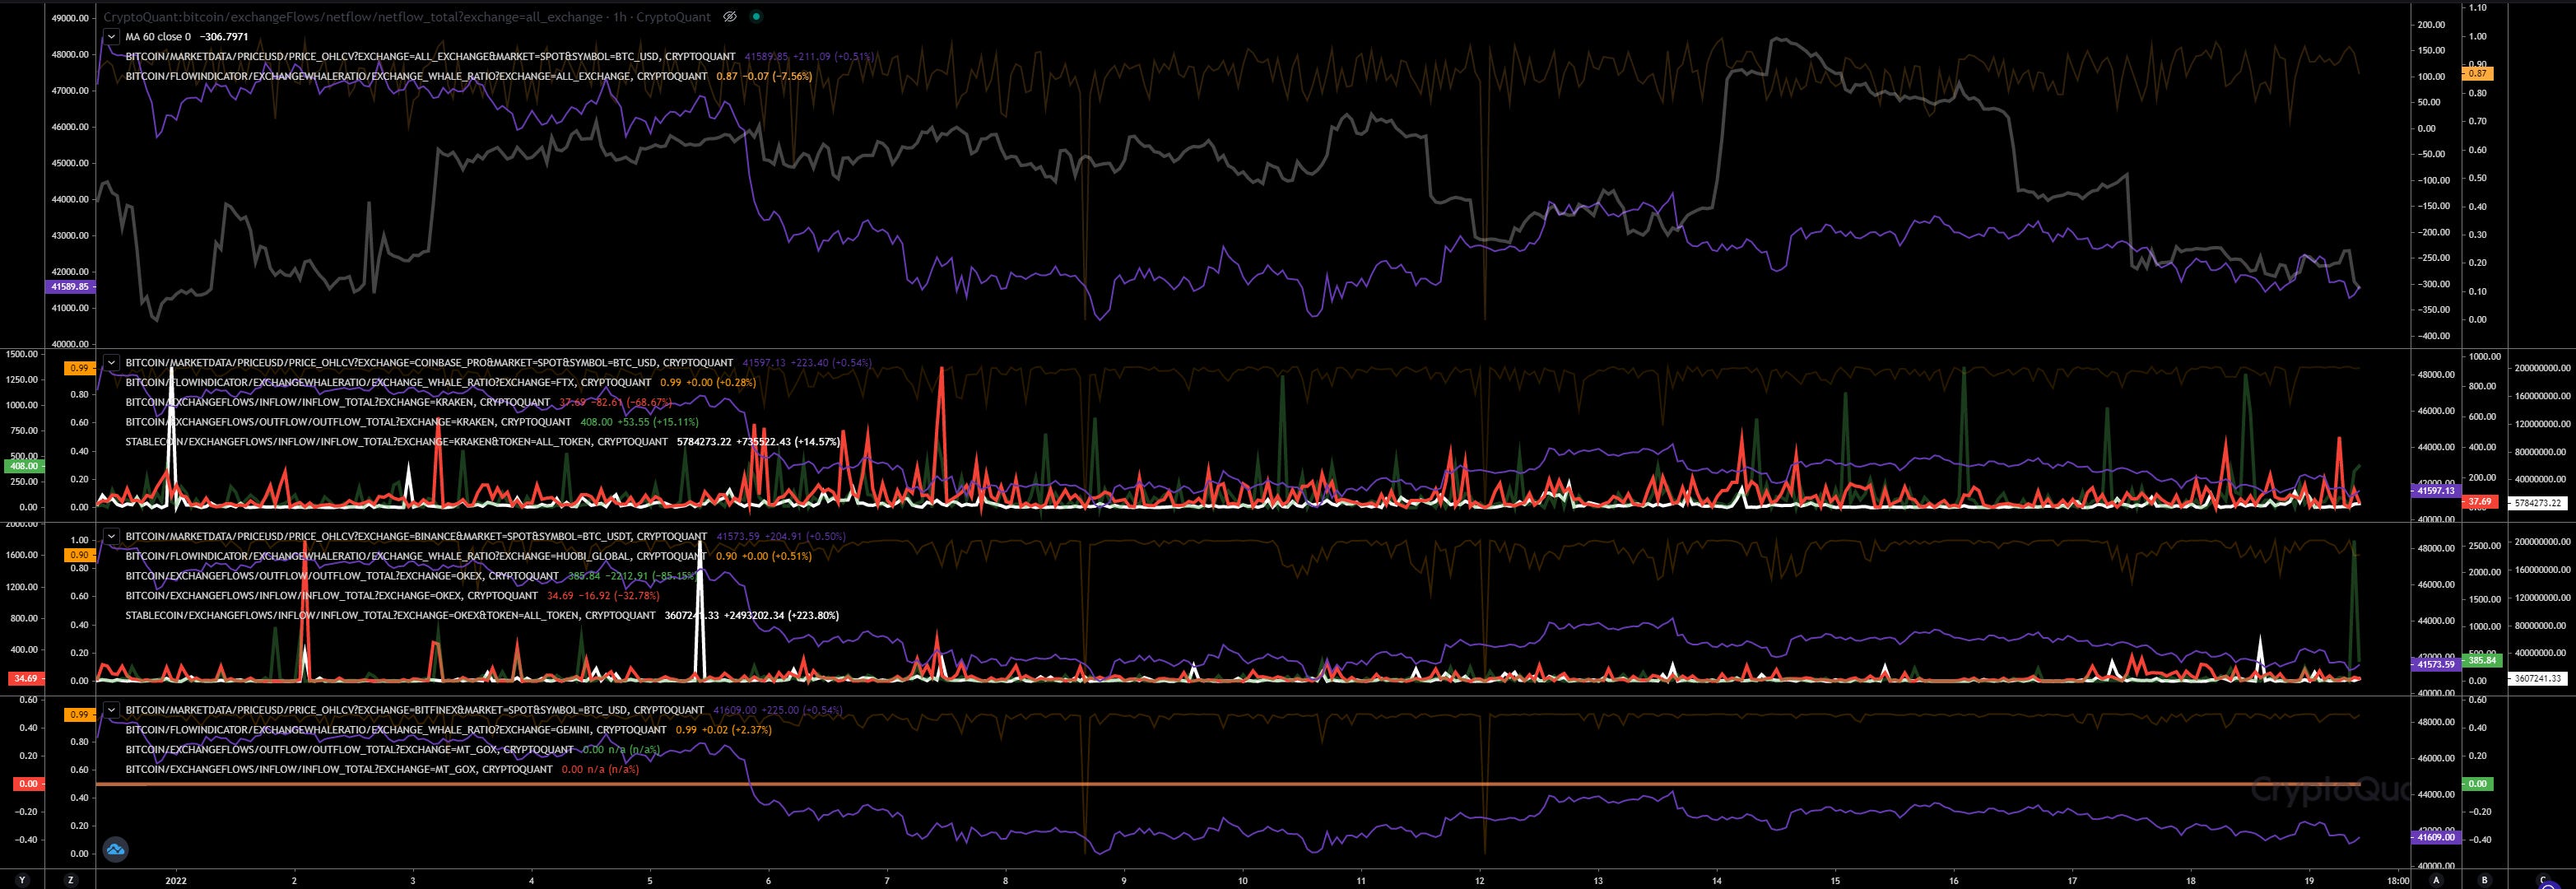
We can see here where the sell pressure comes from. Binance showing more inflows than outflows. Coinbase showing more outflows and one big inflows today, Bitfinex shows several little outflows, but nothing big.
Huobi showing here bigger stablecoin inflows, but related to in- or outflows almost neutral, while Gemini is showing more inflows and a big stablecoin inflows tonight. FTX seems to be the stablecoin king. Here showing many stablecoin inflows, inflows and outflows are neutral. As soon an inflow is detect on FTX directly afterwards an outflow happens next.
Kraken is in my opinion leading in outflows indicating more purchases happening here. They are showing almost everyday an outflow of almost 600 - 800 BTC. Okex is showing a low activity, except today. We have detected here a big outflow of almost 2,500 BTC. That correlates with the inflow happenend 02-01-2022 of almost the same volume.
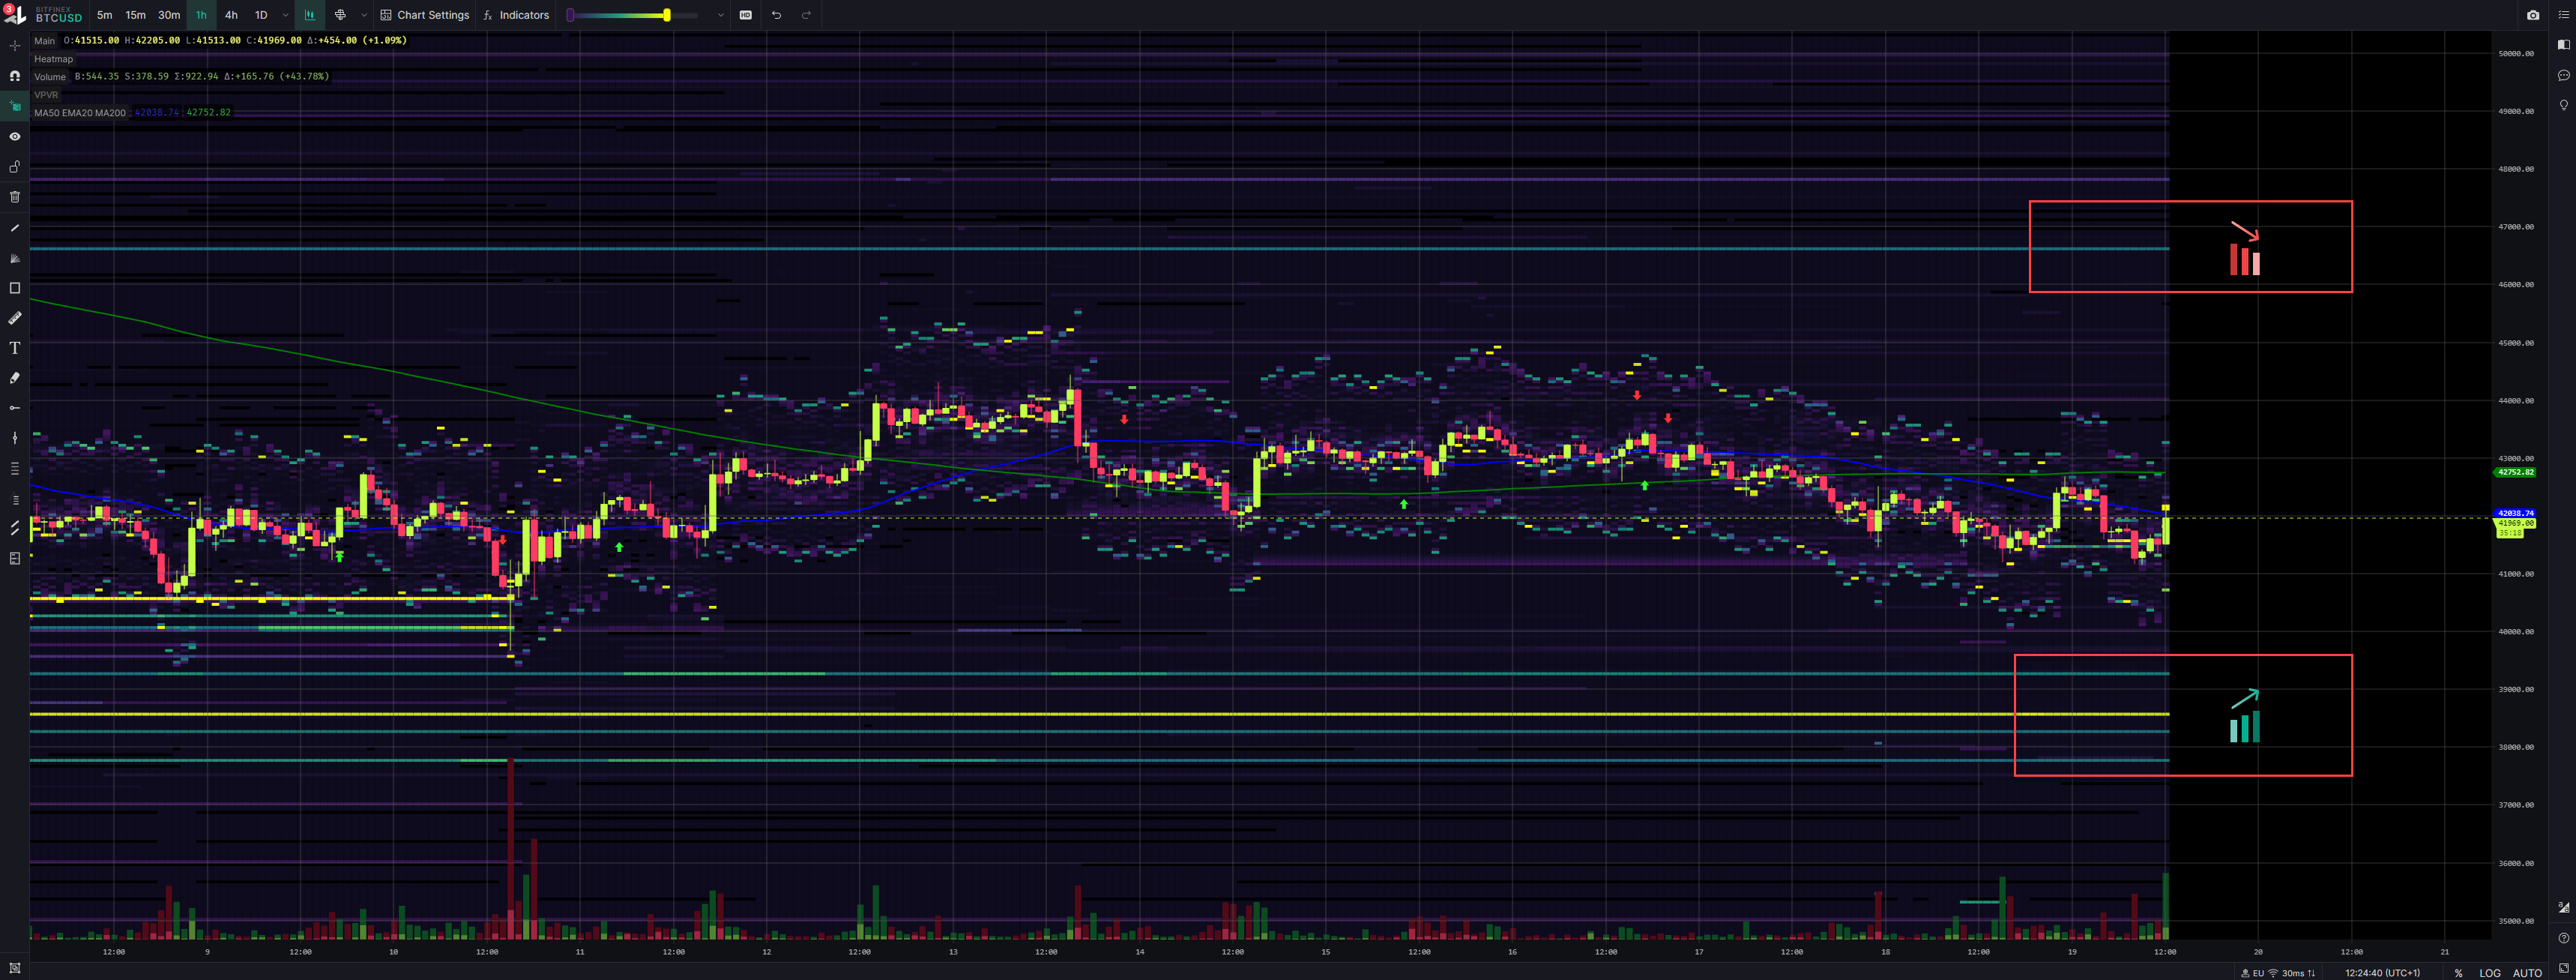
Exchange Walls
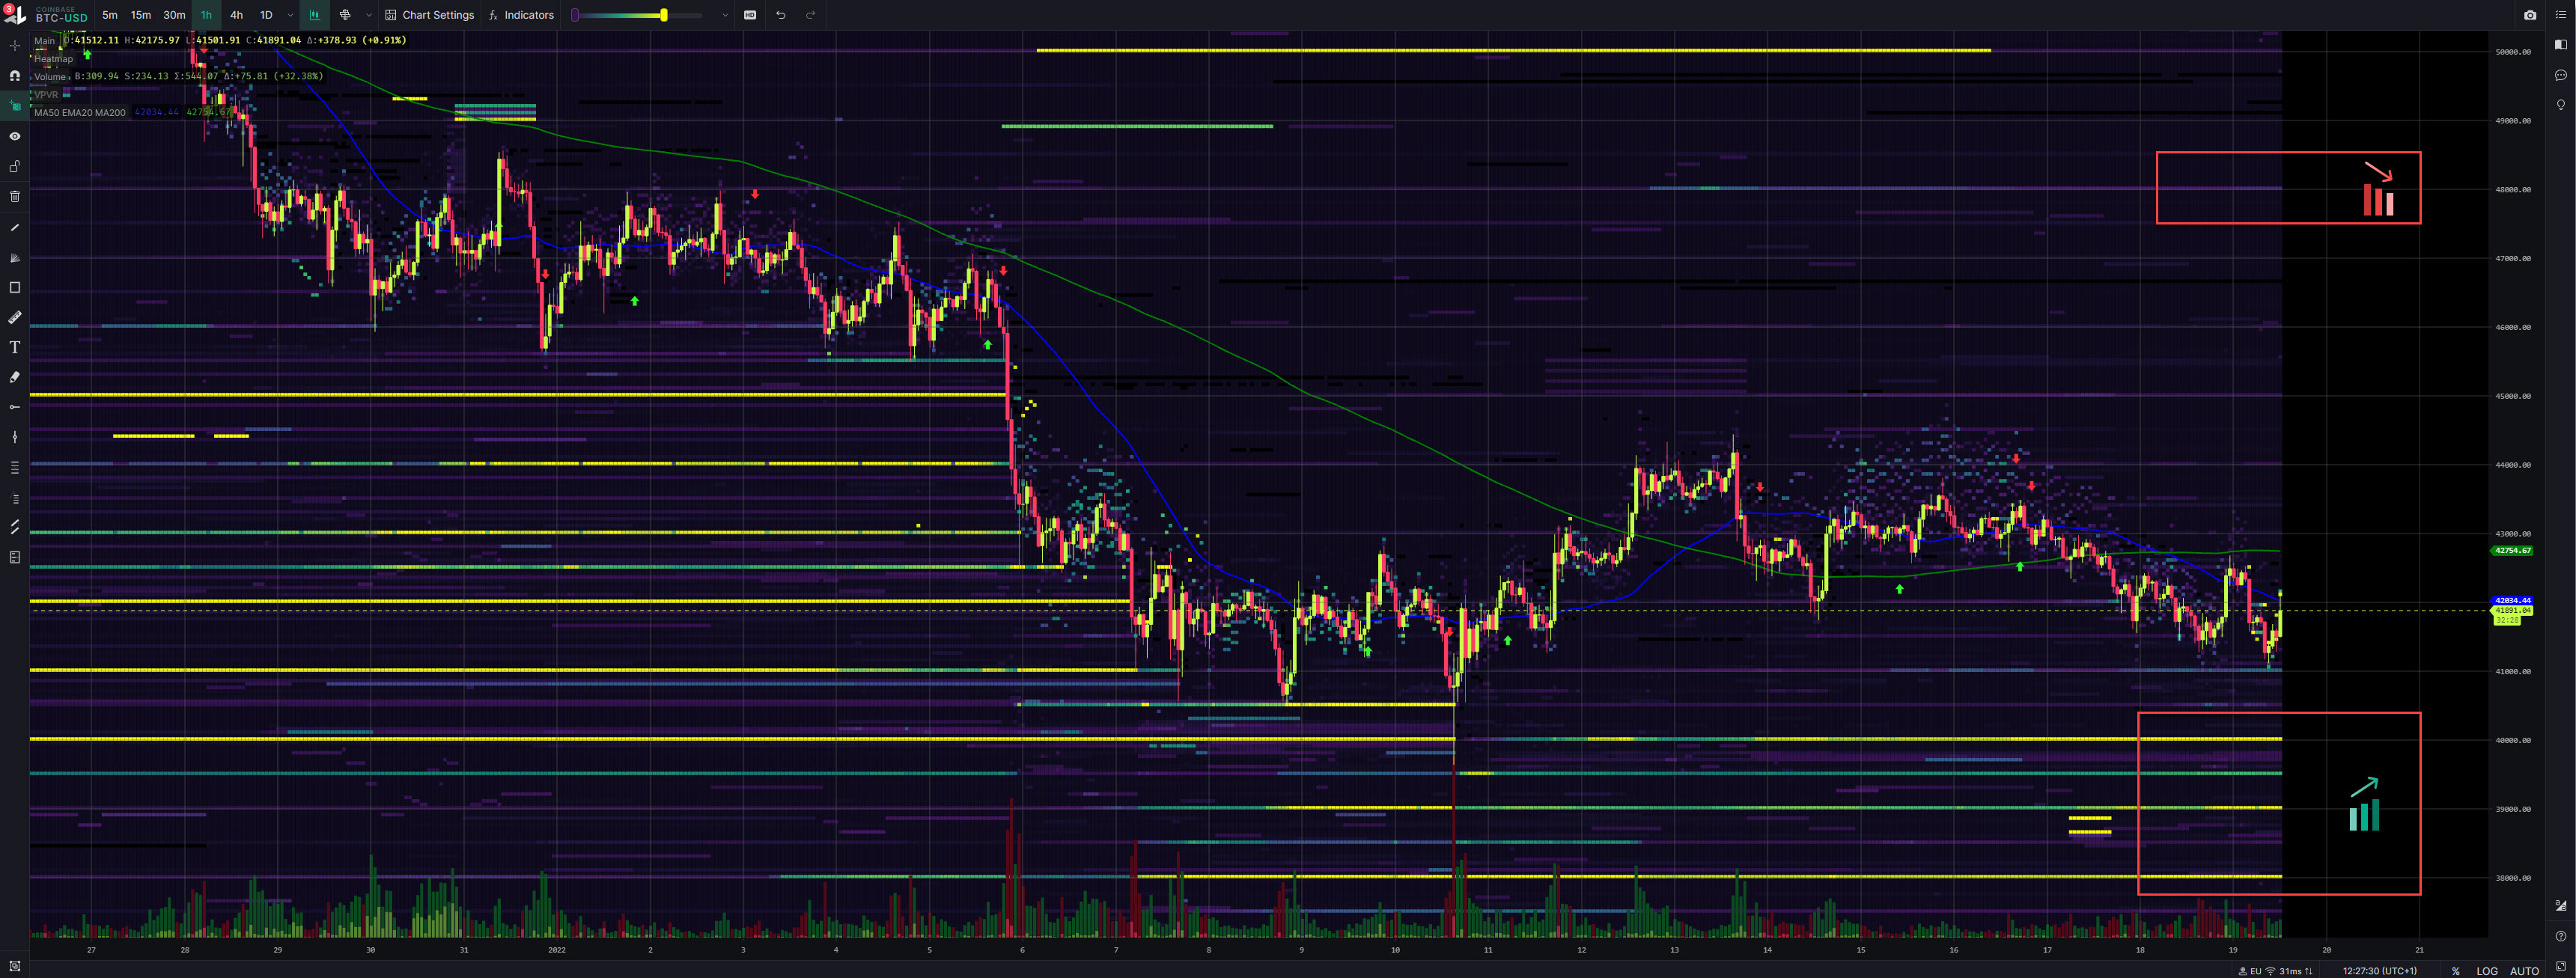
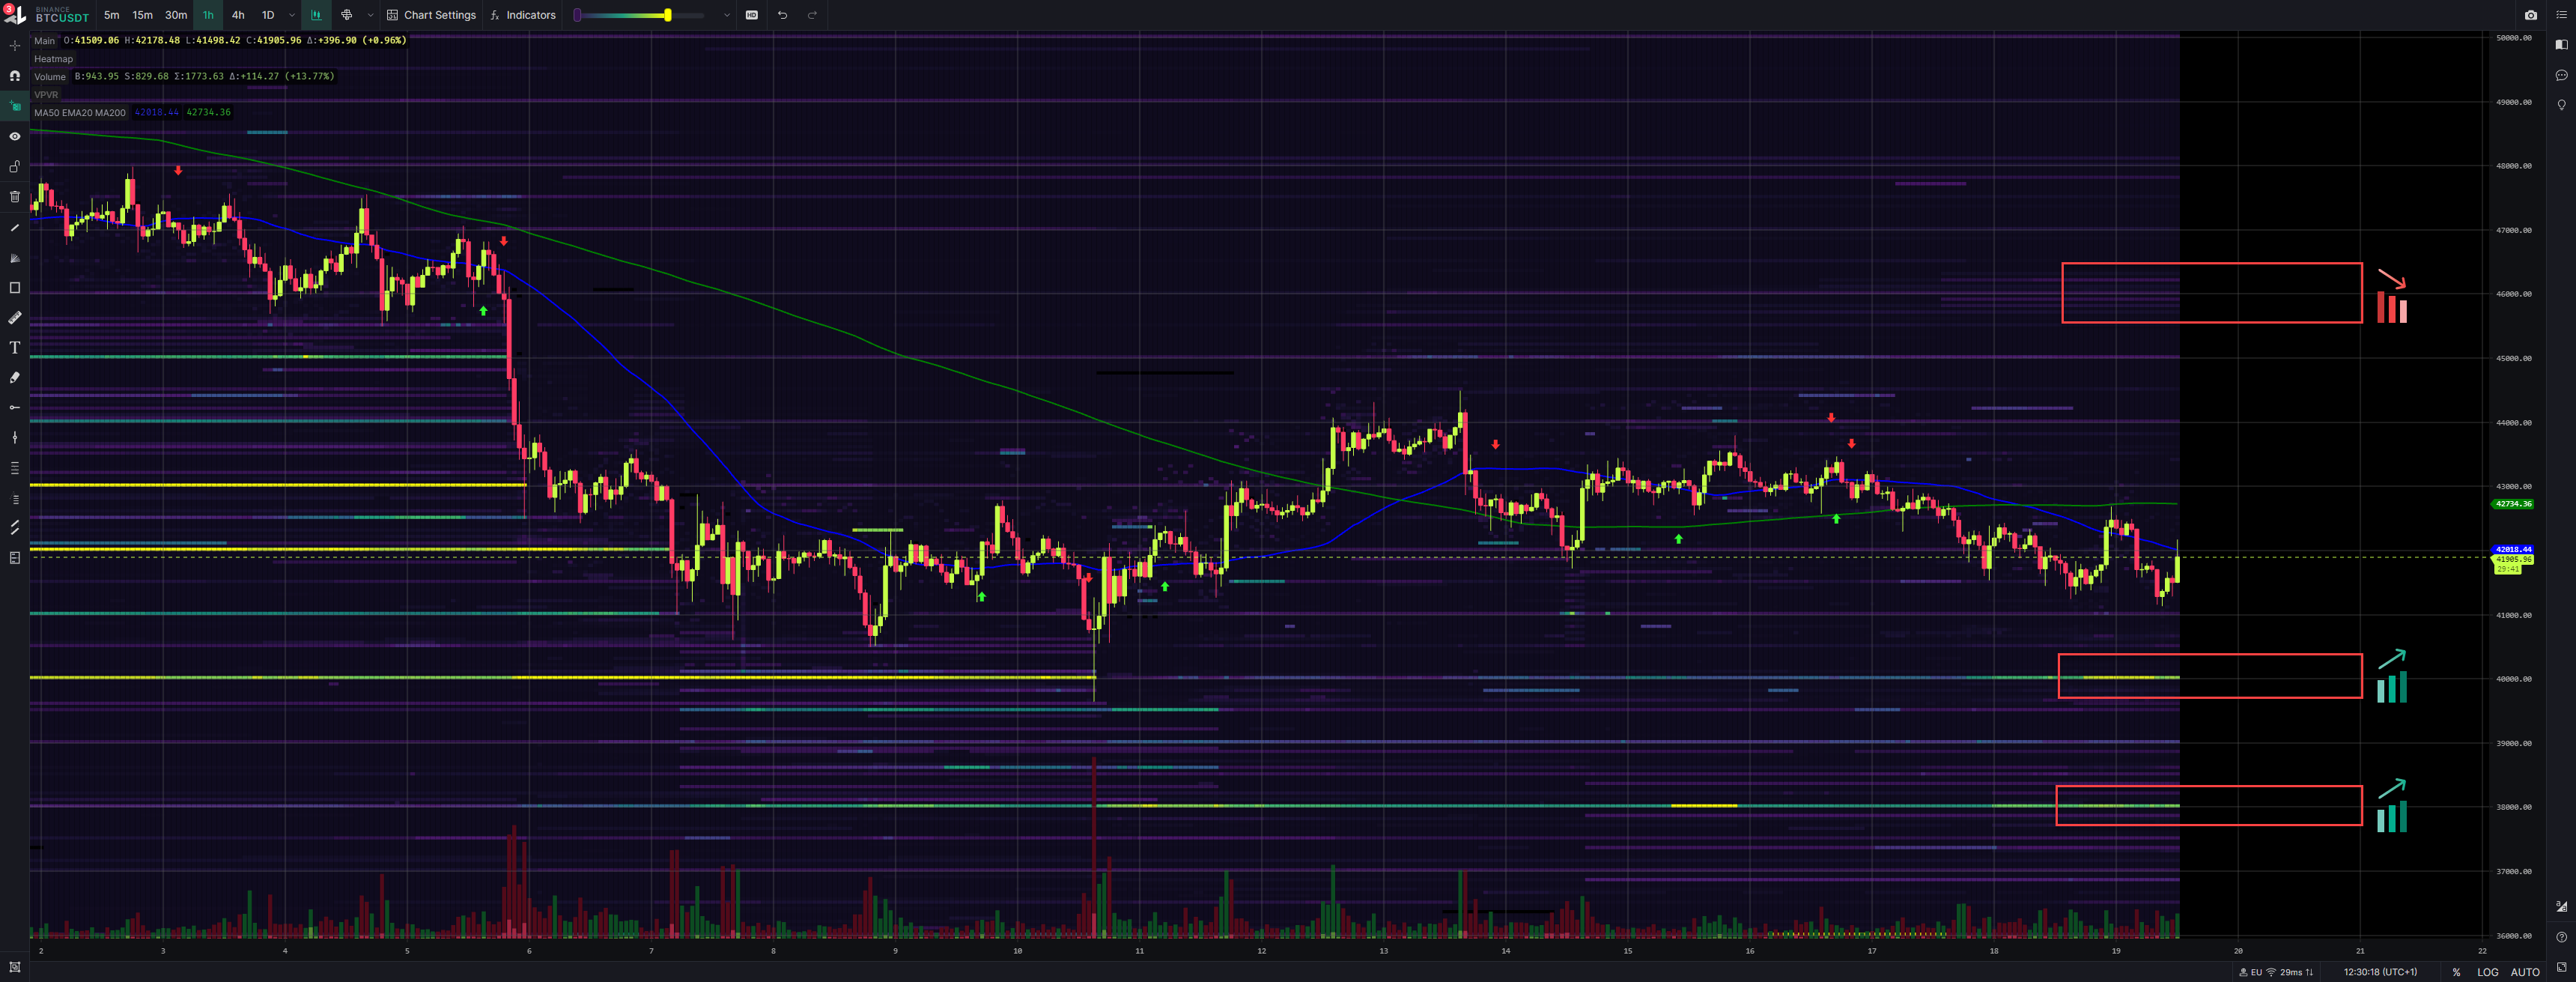
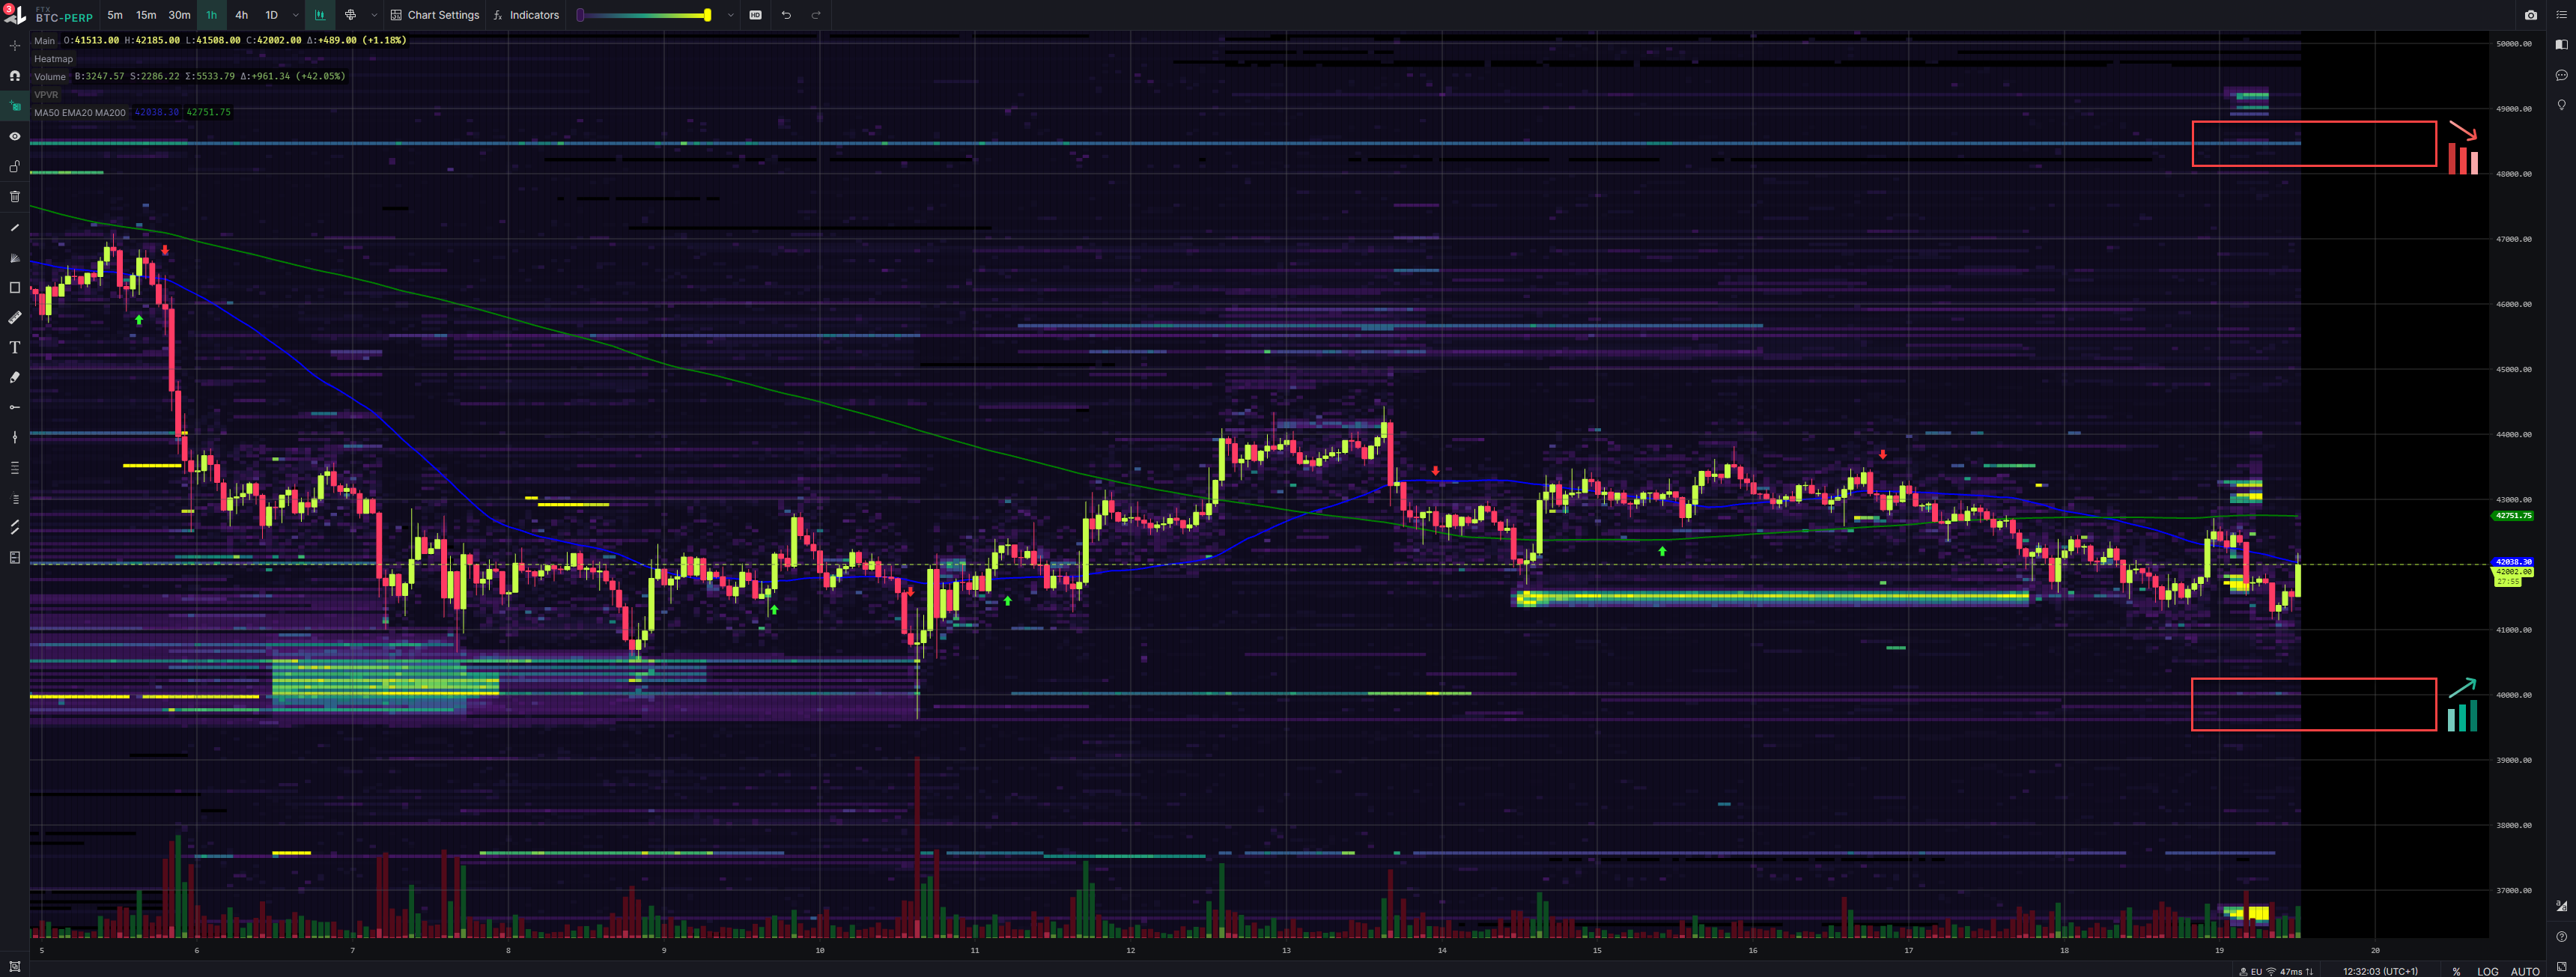
#1 - Bitfinex | Walls: Upper at 46.6k, Lower at 39.3k
#2 - Coinbase | Walls: Upper at 48k, Lower at 40k
#3 - Binance | Walls: Upper at 46k, Lower at 40k
#4 - FTX | Walls: Upper at 48.5k, Lower at 40k
#5 - Kraken | Walls: Upper at 44.8k, Lower at 40k
Inspos Conclusion and personal trade strategy
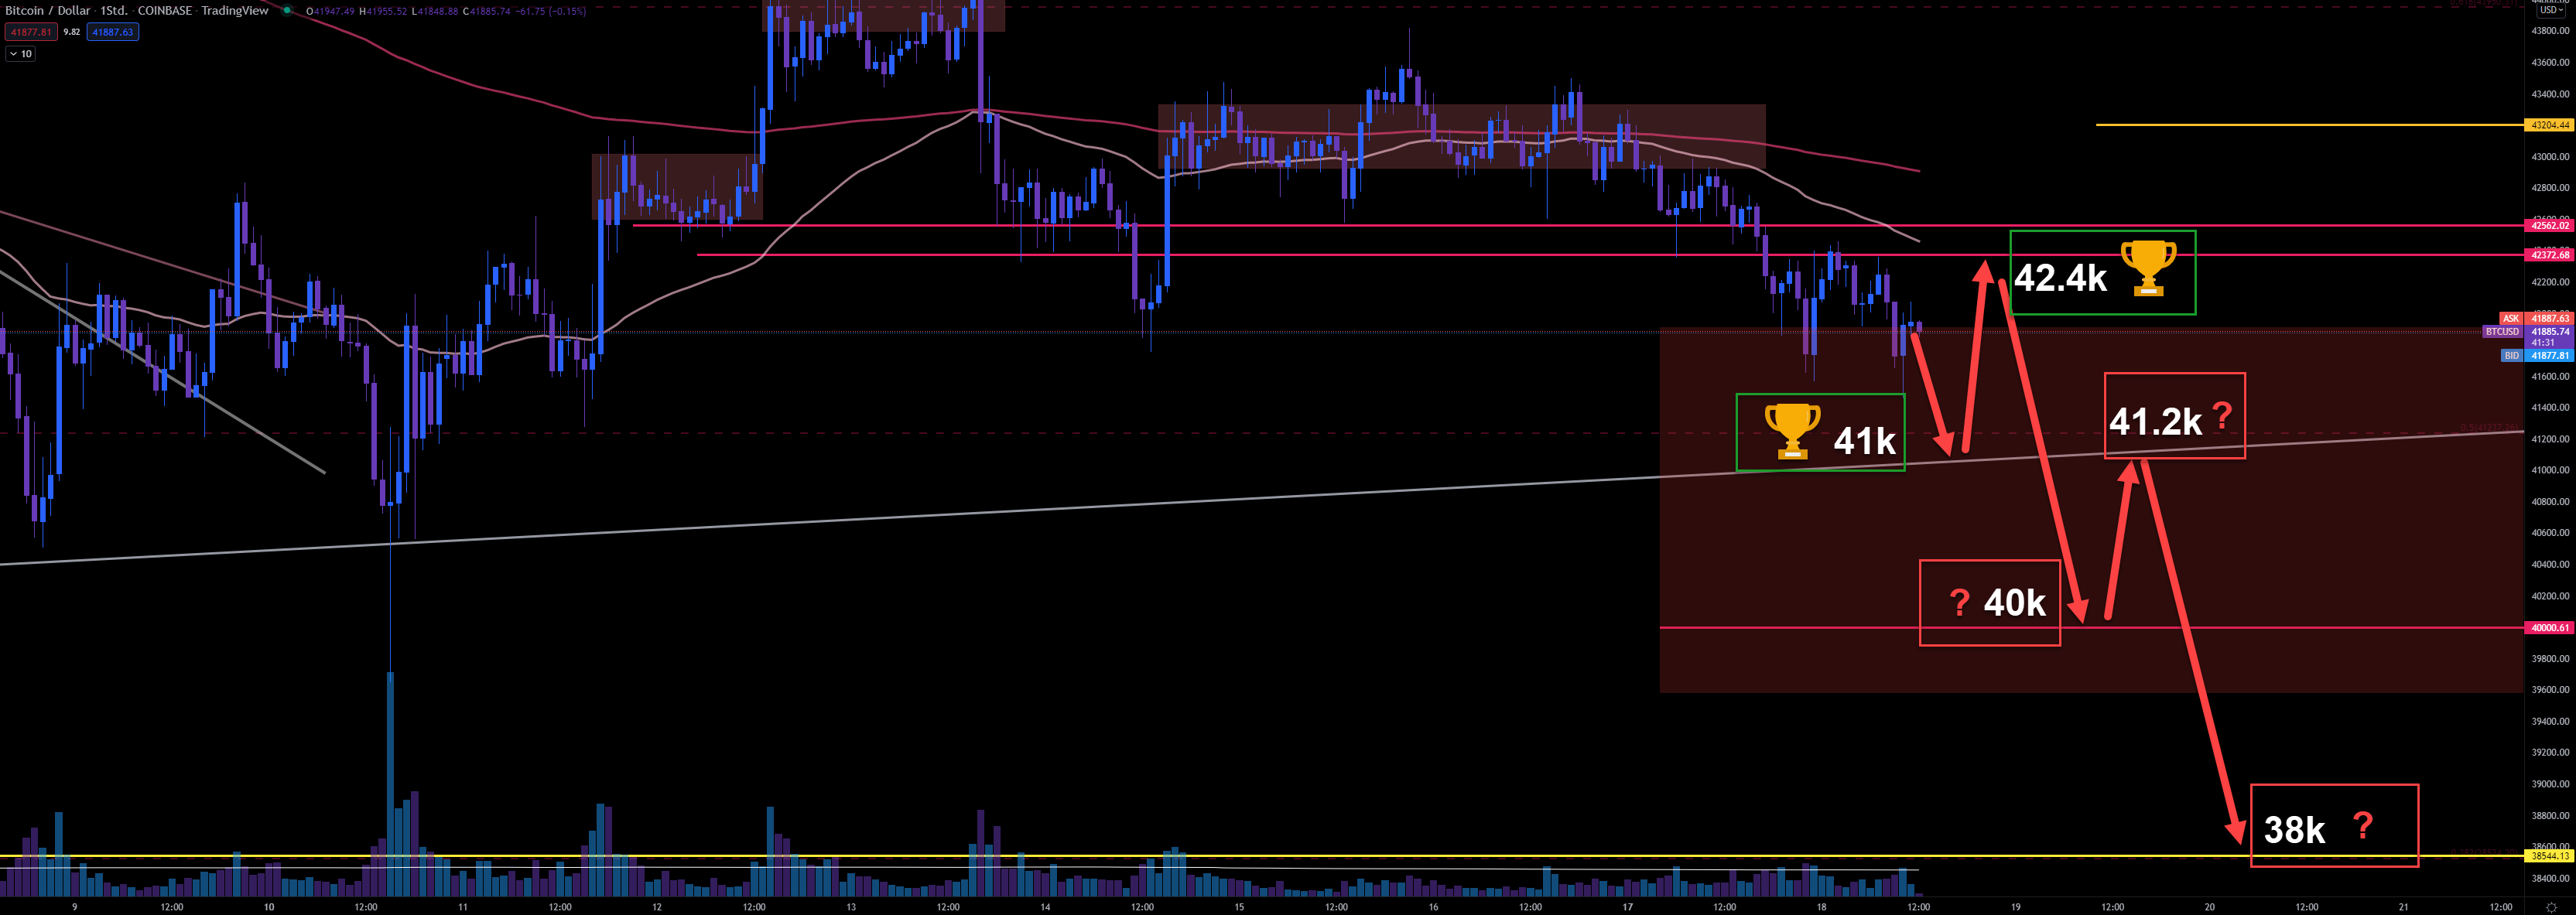
Based on my analysis I’m maintain bearish short-term. Expecting a last final move heading 40k. We are still detecting big inflows related to our dump driver Binance, but the volume of these inflows are less than a week ago. That is bullish. Option traders adjusting their trade strategy as described is more bearish, also the reduction of the max pain for 28Jan22 isn’t bullish at all. However, walls in lower ranges are disappearing and that could indicate a early end of the current sell pressure. If so, is 40k our bottom and we will lift up heading at least our max pain of 46k for the 28Jan22 expiry. SPX did today a big jump heading it’s resistance at 4590 and BTC is following. I’m fine with that. But SPX is now stalling there and it can retrace next. If so, it has formed another dead cat bounce and BTC will follow. Would at least match with my expectations of a 40k retest before we start to pump. So, I stick to my plan from yesterday. We have reached 41k as expected, we have reached 42.4k as expected too, now the buy pressure is rising and we lifted up at 41.2k again heading 42.2k but it failed and is retracing again. The volume is ok, but in my opinion not big enough to pump hard. So, I’m still expecting 40k. Only if I see that the volume starts to rise even more at 41k again, I would start to flip to long. Until our last price action is another dead cat bounce that will liquidate late longs to push heading my 40k target.





Thank you, great content
♥