Hourly View
Our whales ratio (1) has once again warned us about an incoming downward trend. Since last saturday the whales ratio 30D average (2) has started to rise indicating an incoming sell pressure by whales. Our netflow (3) is showing several positive netflows (3) indicating big inflows by whales too. At the moment it’s not clear if this 8,000 BTC inflow on Binance was a whale transaction or just an internal op. However, we noticed netflows of 1,400 BTC, 1,630 BTC and 1,000 BTC yesterday. That’s enough volume to let the market dump in price more as we trade with low volume.
Block View
Our block view is showing that the whales ratio (1) has risen hard since 15Jan22 where we reached almost 44k. If we check the whales ratio 30D average (2) we can see the positive trend indicating a rising sell pressure coming to the price action. We can see the consequence of it. The price has started to decline heading our current price level of 42k. Our netflow (3) is showing more red than green since midnight, indicating more outflows than inflows. Nevertheless, no big moves detected here yet. As long the whales ratio maintains that high we will notice the sell pressure and we should maintain a lower level.
Option Trading
Expiry 21JAN22
Our max pain here is still 43k (1). The Open Interest by Strike is still at 44k with $59.7 million in Calls and $12.09 million in Puts.
In the last 24h we can detect more volume (2) in Puts than in Calls. Showing a Puts volume of almost $33 million between 40k - 42k indicating a bearish sentiment in the last 24h by option traders. We also have a volume of almost $10.6 million in Calls at 43k. No that bullish. It seems option traders are not expecting a big pump until 21Jan22. I’m fine with that, I wasn’t expecting any big bullish move until end of the month anyway.
Expiry 28JAN22
We can see a complete different picture for this expiry. Max main is still 48k (3). No big changes detected here except more volume (4) generated in the last 24h in Puts than in Calls. Anyway, based on its Open Interest we still have more volume in upper price ranges with Calls. Much more Puts volume in lower price ranges. That’s bullish.
Also our Open Interest (5) By Expiration doesn’t show any big changes. Only the Volume By Expiration (6) shows how the sentiment is shifting to bearish at the moment. At least for the expiries 21Jan22, 25Mar22 and 24Jan22 we have detected more Puts volume than Call volume.
Future Trading
Daily View
Nothing has changed here since days. Leverage ratio (1) maintains its high level, since 2 days rising a bit, and funding rates 50D average (2) is trending to negative indicating a bearish sentiment at future traders. To make clear, that is just to detect the trend and not useful to trade this information. The hourly view give us a much better better overview for our trade strategy.
Hourly View
Looks a bit different as we are zooming in. Since 14Jan22 the funding rate (1) was rising, but the leverage ratio (2) maintained its level. Since yesterday both are rising at the same time, indicating future traders flipped to bullish and placing high leverage longs expecting a pump soon. That’s bearish. At least it would rise the sell pressure if we dump more and it triggers a high leverage long cascade.
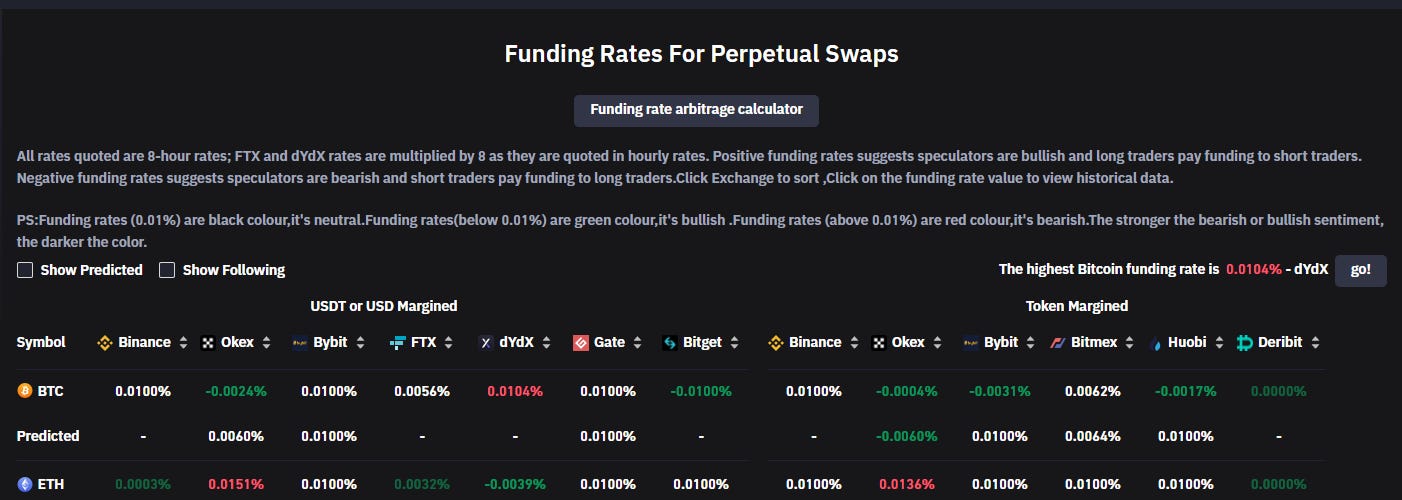
Also Coinglass confirms the observation described above. Funding rates of the last 8h are neutral or a bit negative.
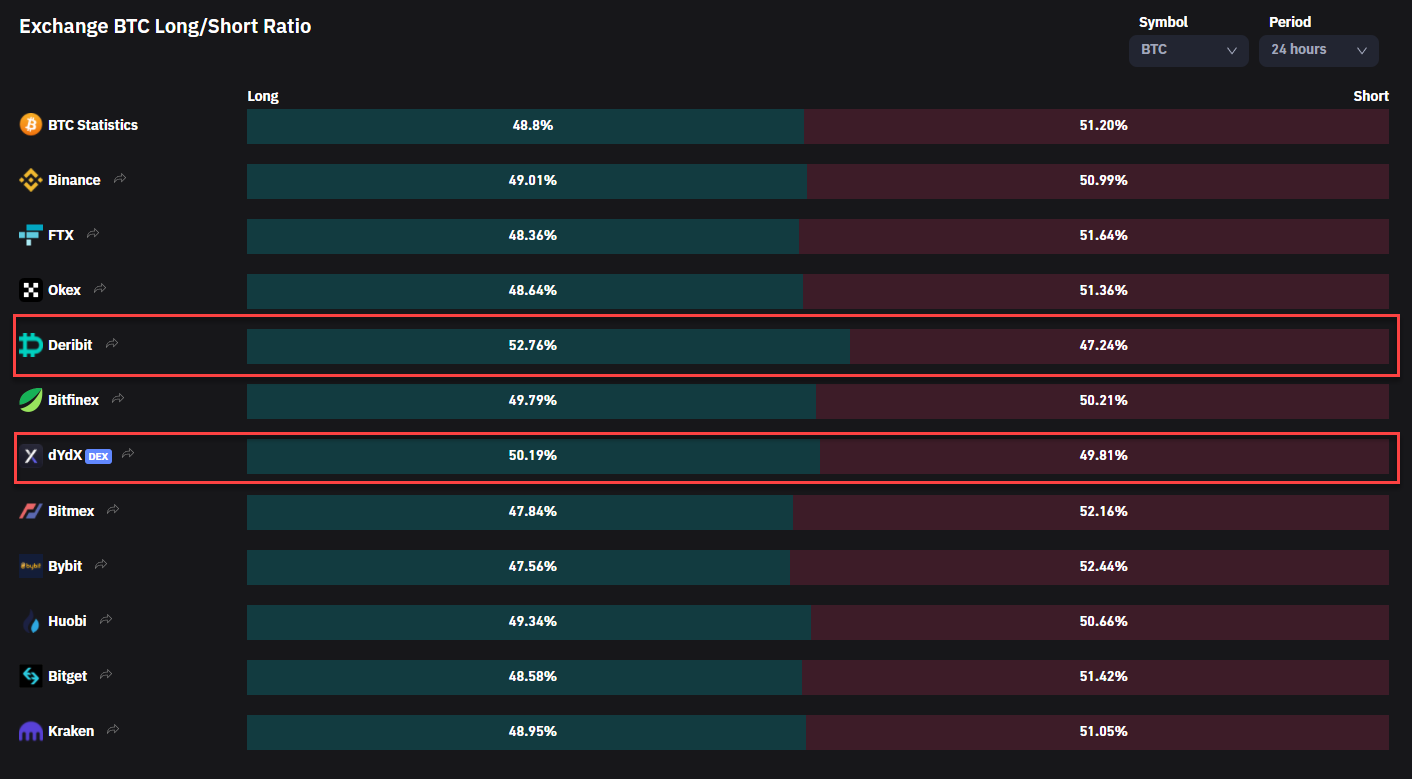
Almost every exchange has received more shorts within the last 24h except Deribit and dYdX. Also here no big changes detected.
Market Activity
Block View
#1 - Coinbase
#2 - Binance
#3 - FTX
#4 - Okex
#5 - Bitfinex
#6 - Kraken
Also here unfortunately nothing new. Binance and Okex activity correlates with bearish price actions while the remaining exchanges correlates with bullish price action. Interesting here is the fact, that Binance and Okex are two exchanges related to the China Mainland Ban. Chinese cannot buy crypto anymore and they cannot get any CNY anymore, but sell and withdraw stablecoins still works it seems. That correlates with our daily stablecoin outflows on Binance.
Our transaction activity on the network maintains low at the moment.
Exchange Activities
#1 - BTC Inflows
#2 - Stablecoin Inflows
#3 - BTC Price (USD)
#4 - Total Netflow
#5 - Total Whales Ratio
#6 - BTC Outflows
Only big inflow detected on Binance is maybe an internal operation. It’s not clear yet. As soon as I see a confirmation for that, I will tweet. At least on Bitfinex, Coinbase and Binance no huge BTC or stablecoin transactions detected.
On Huobi we can detect more stablecoin inflows. But the last big one ($130 million) happenend 15Jan22 and since then nothing happend. Only FTX is showing more stablecoin inflows yesterday. They received four times almost $70 million making a total volume of almost $280 million. BTC In- and outflows are neutral on FTX, like on Coinbase. As soon tokens arrived they disappear immediately afterwards.
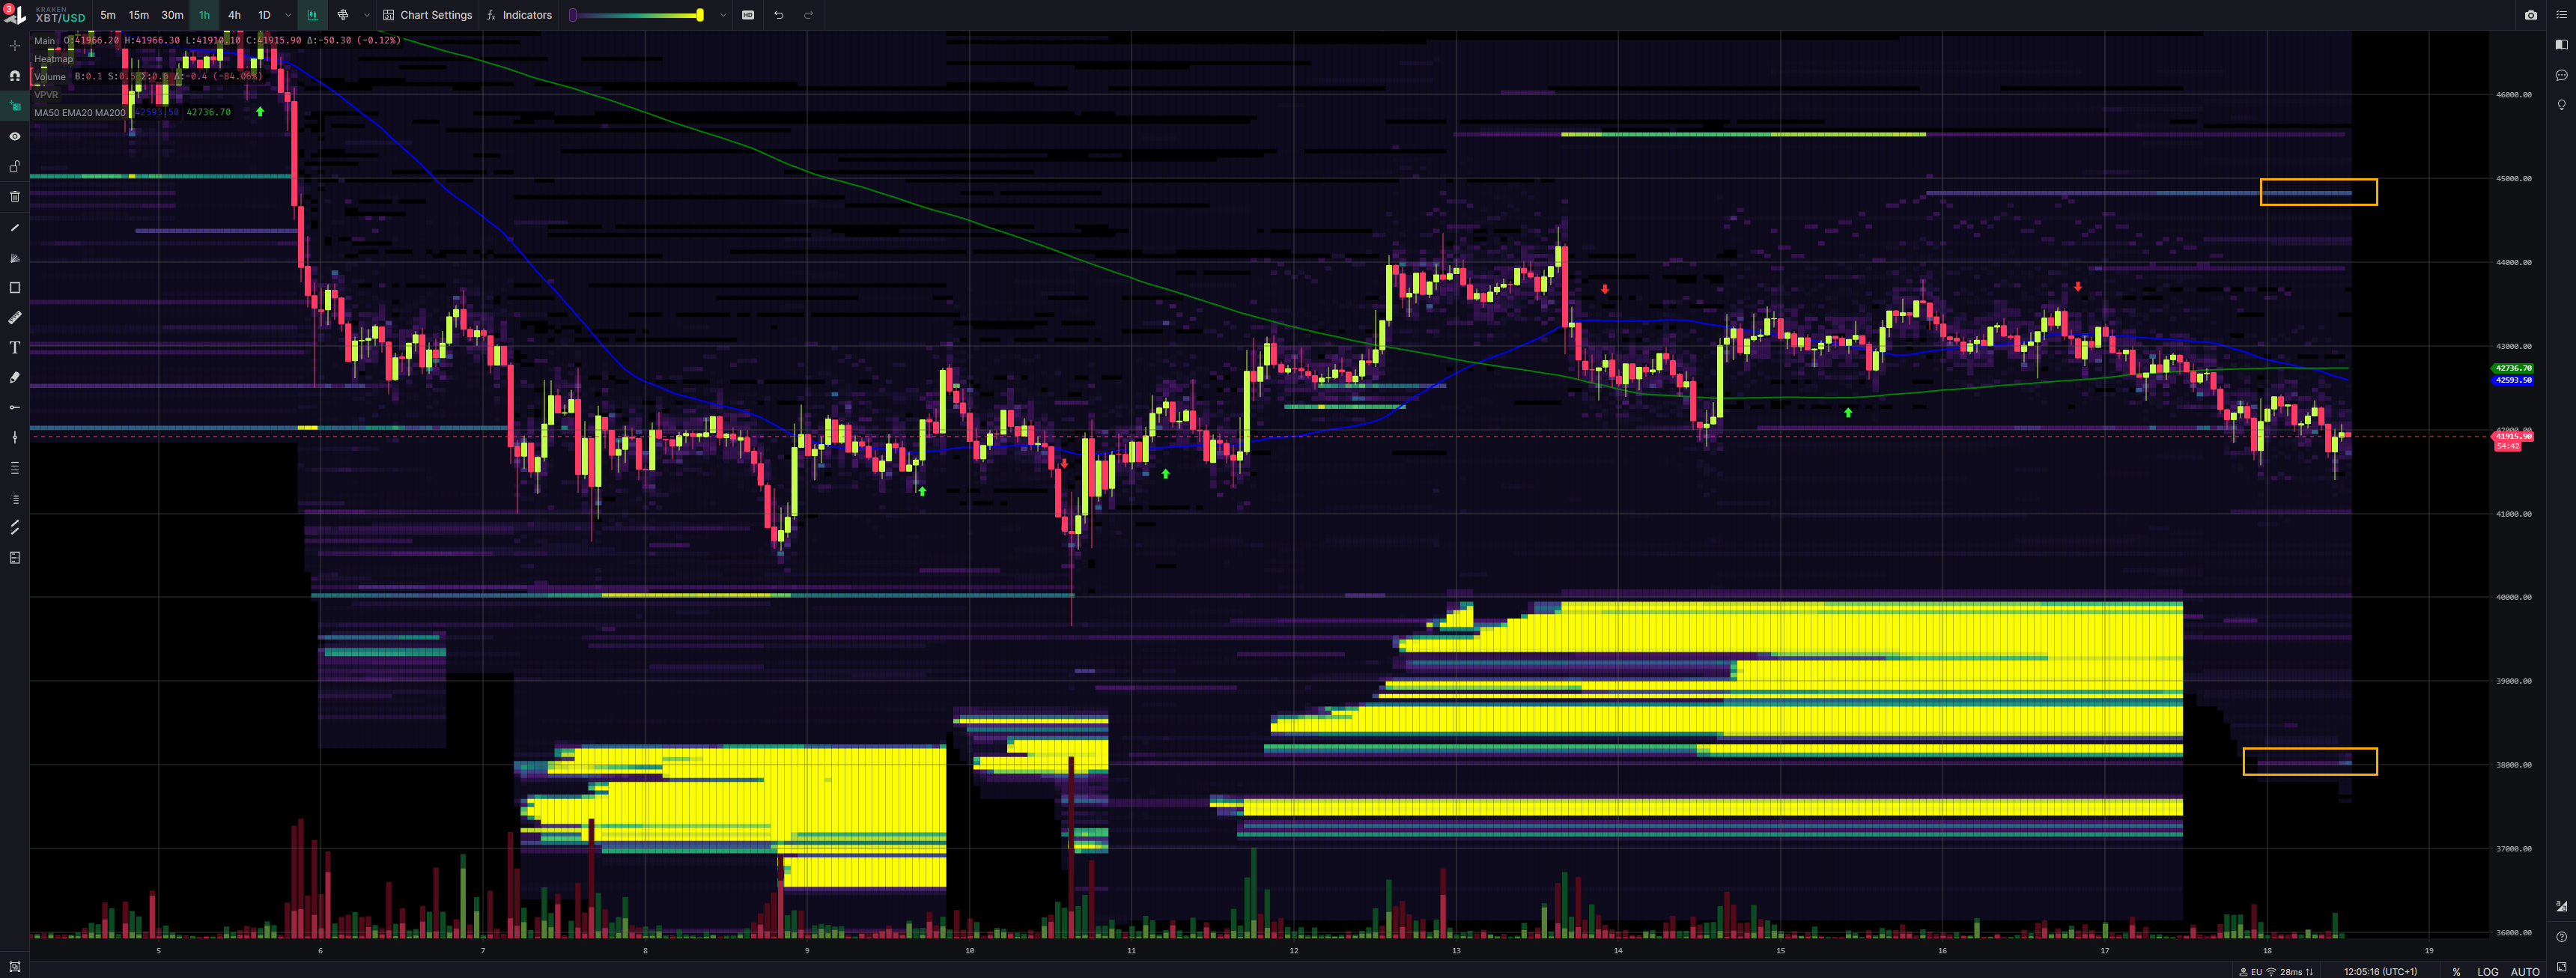
Today is Kraken my favorite exchange. Interesting what is happening there. As we know, they have removed their lower walls. We can see they had an outflow of almost 900 BTC yesterday but today detecting more inflows. Interesting here, the last inflow correlates perfectly with the recent dump in price from 42.3k to 41.5k.
Okex just shows a recent outflow of 230 BTC. That’s it. Yesterday they were actively receiving BTC. But the volume maintains relatively low compared to other exchange showing a volume of 200 - 300 BTC on each inflow.
Exchange Walls
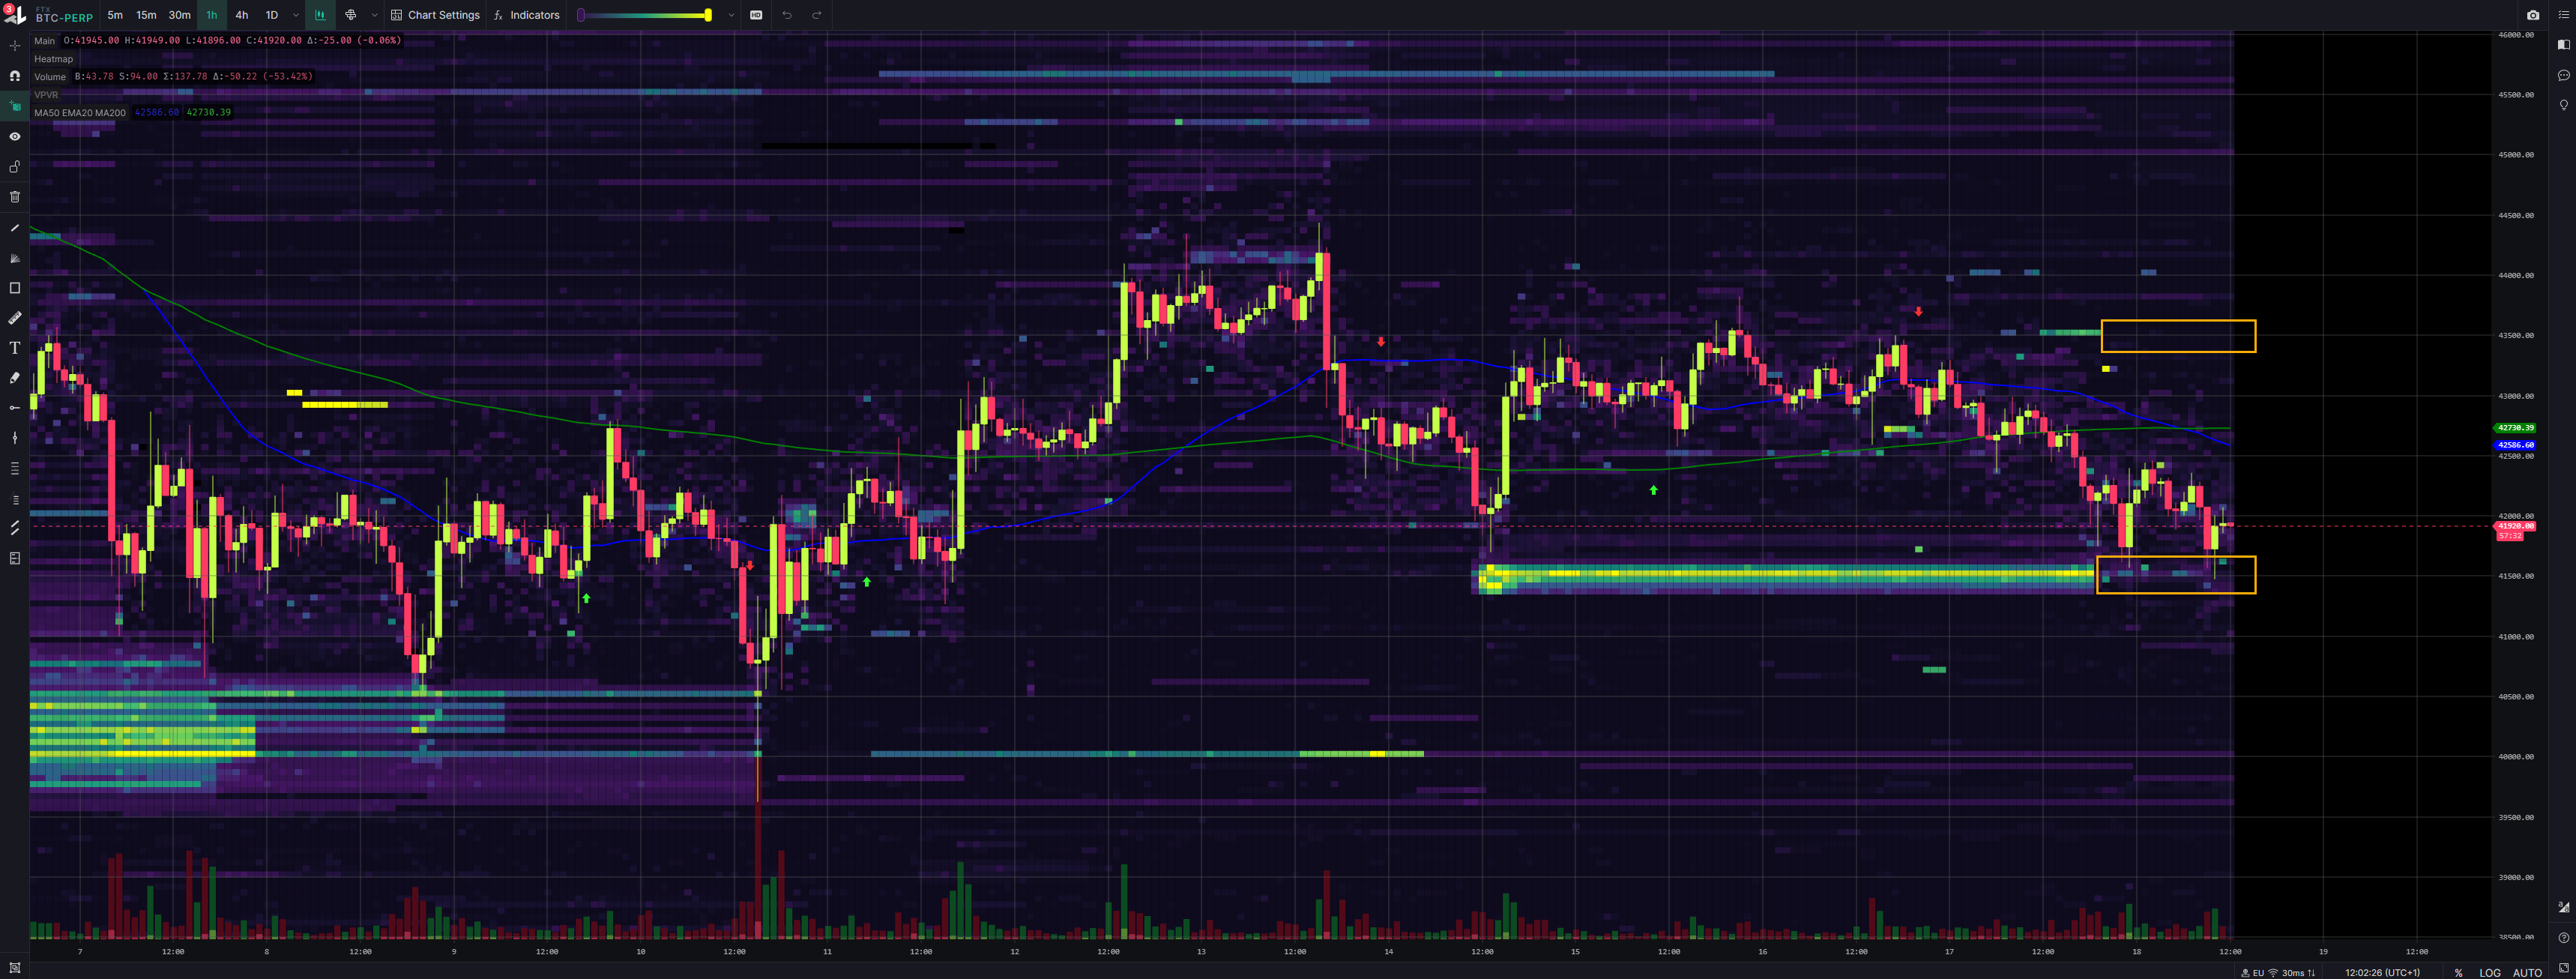
#1 - FTX | Walls: No big walls detected here anymore!
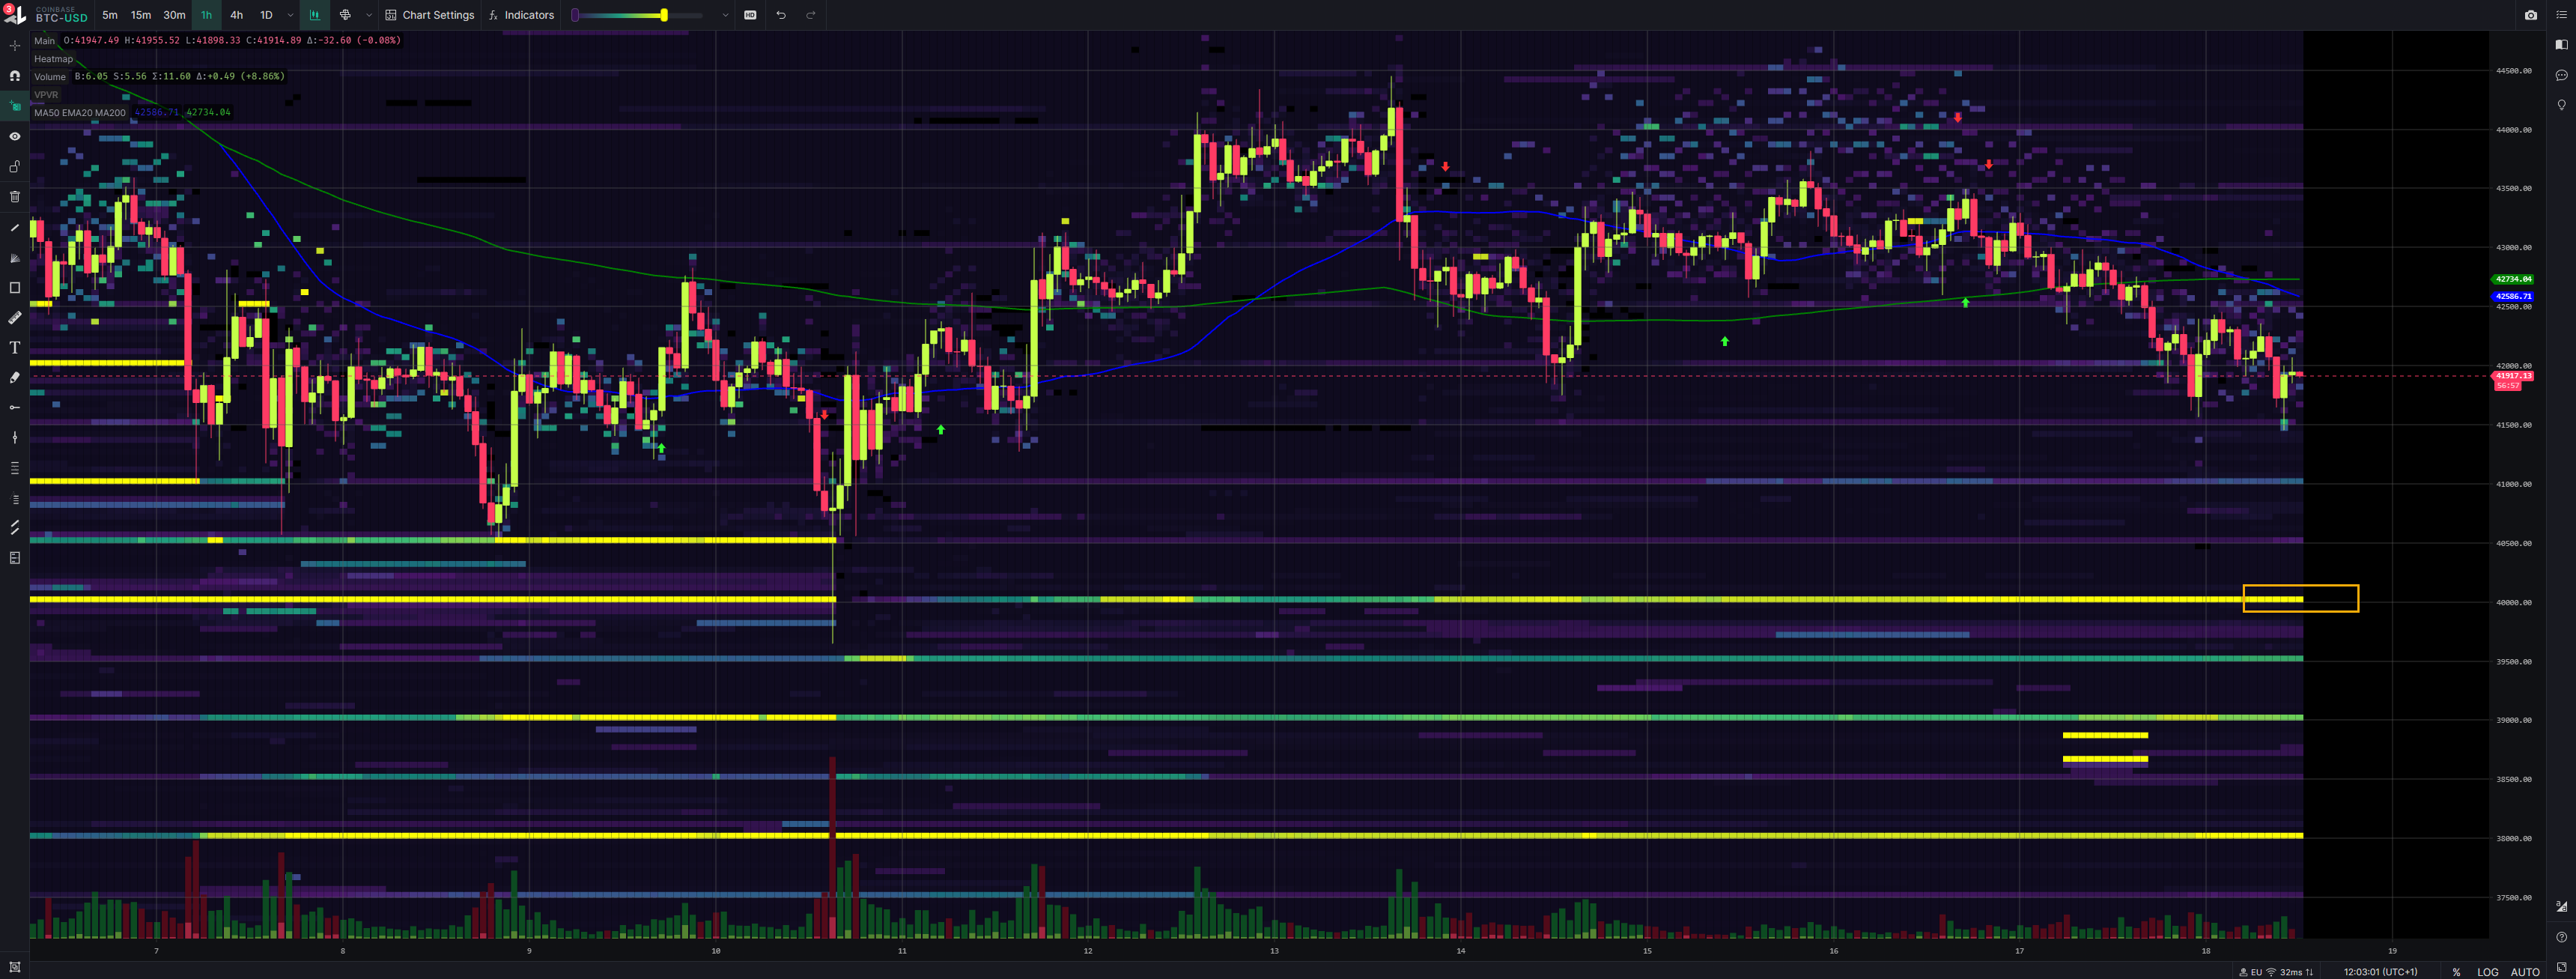
#2 - Coinbase | Walls: Lower wall at 40k
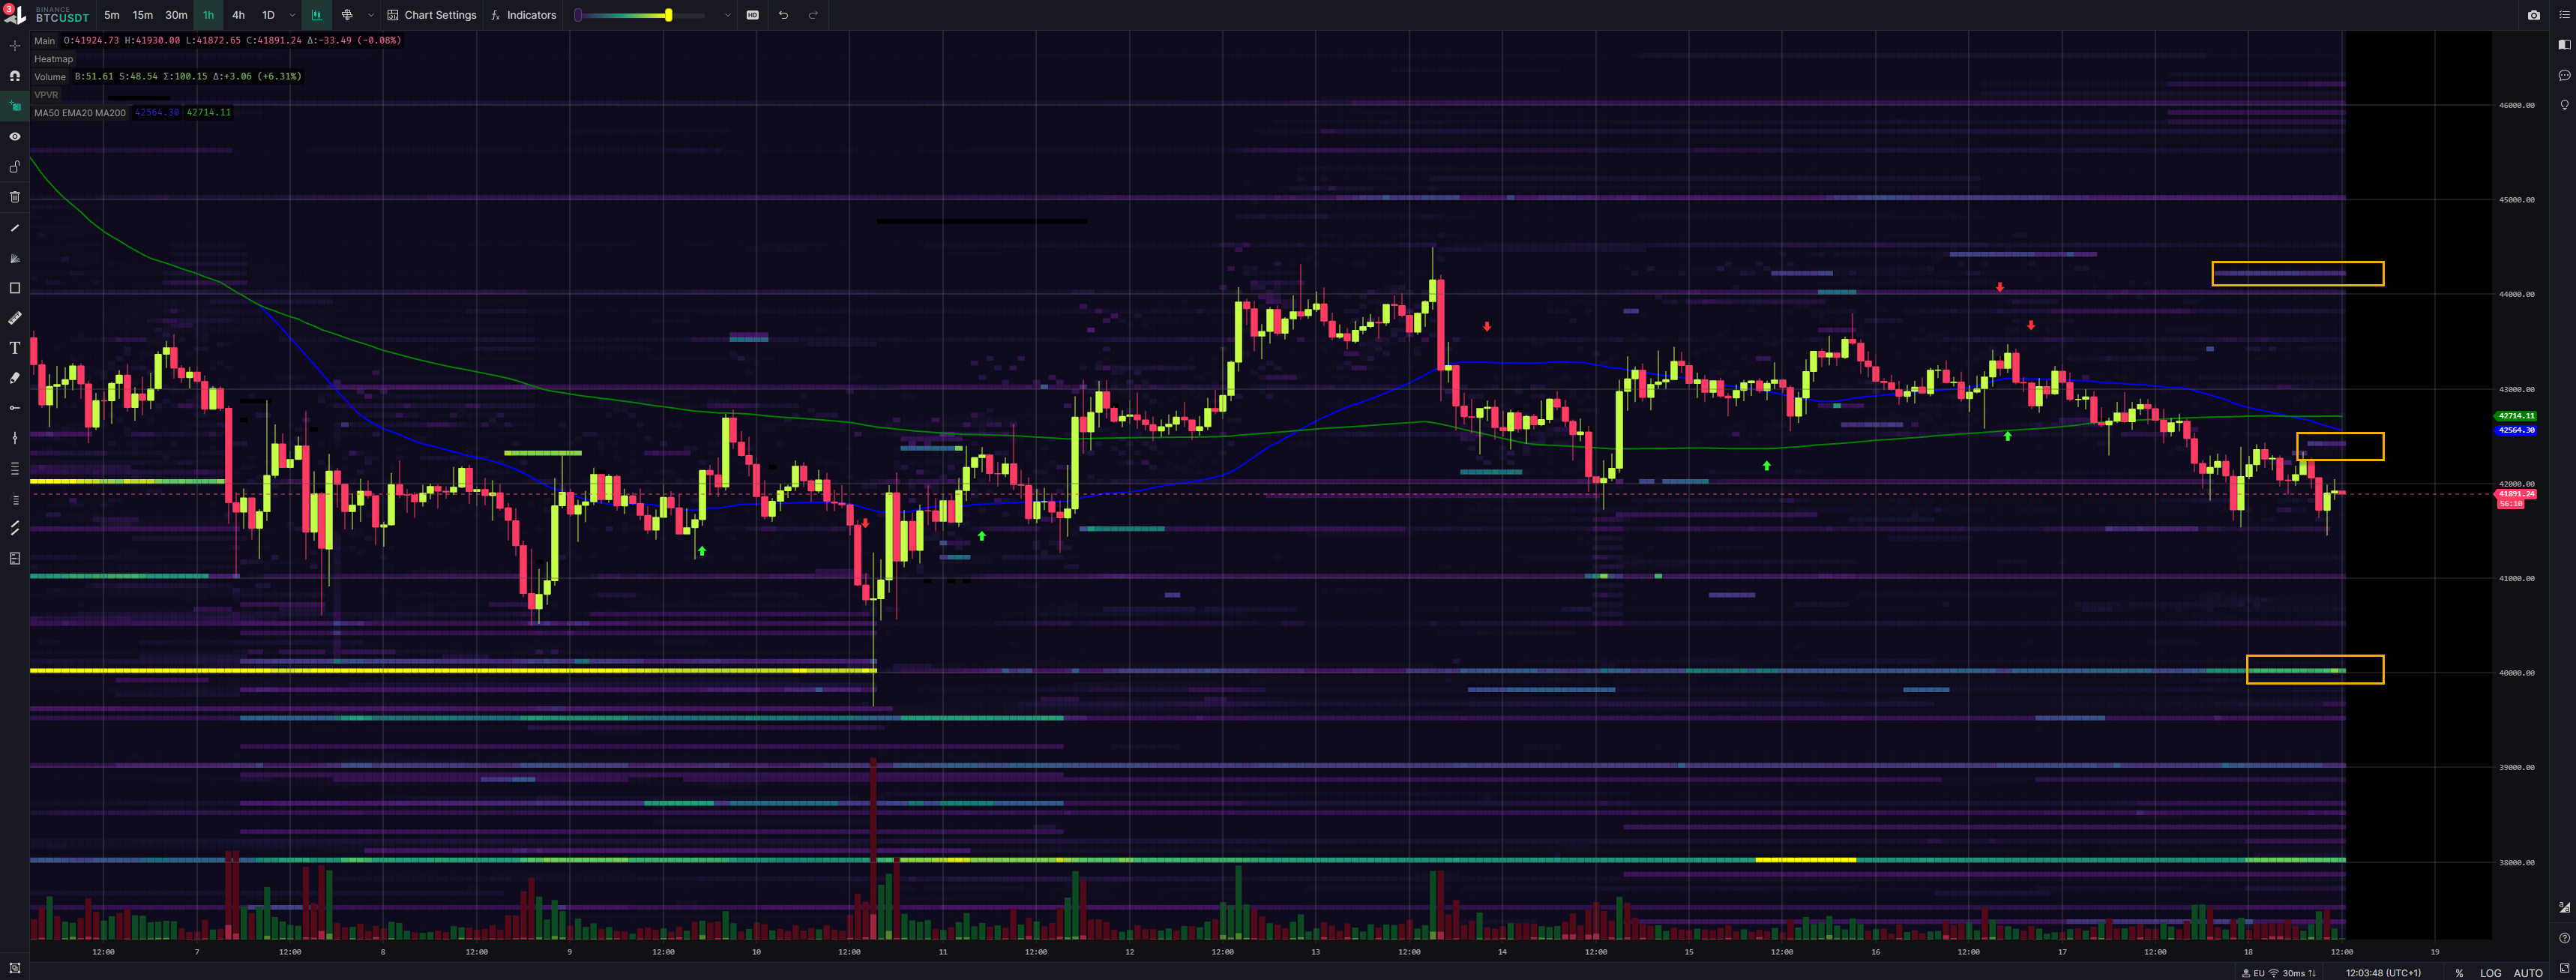
#3 - Binance | Walls: Upper at 42.4k, Lower at 40k
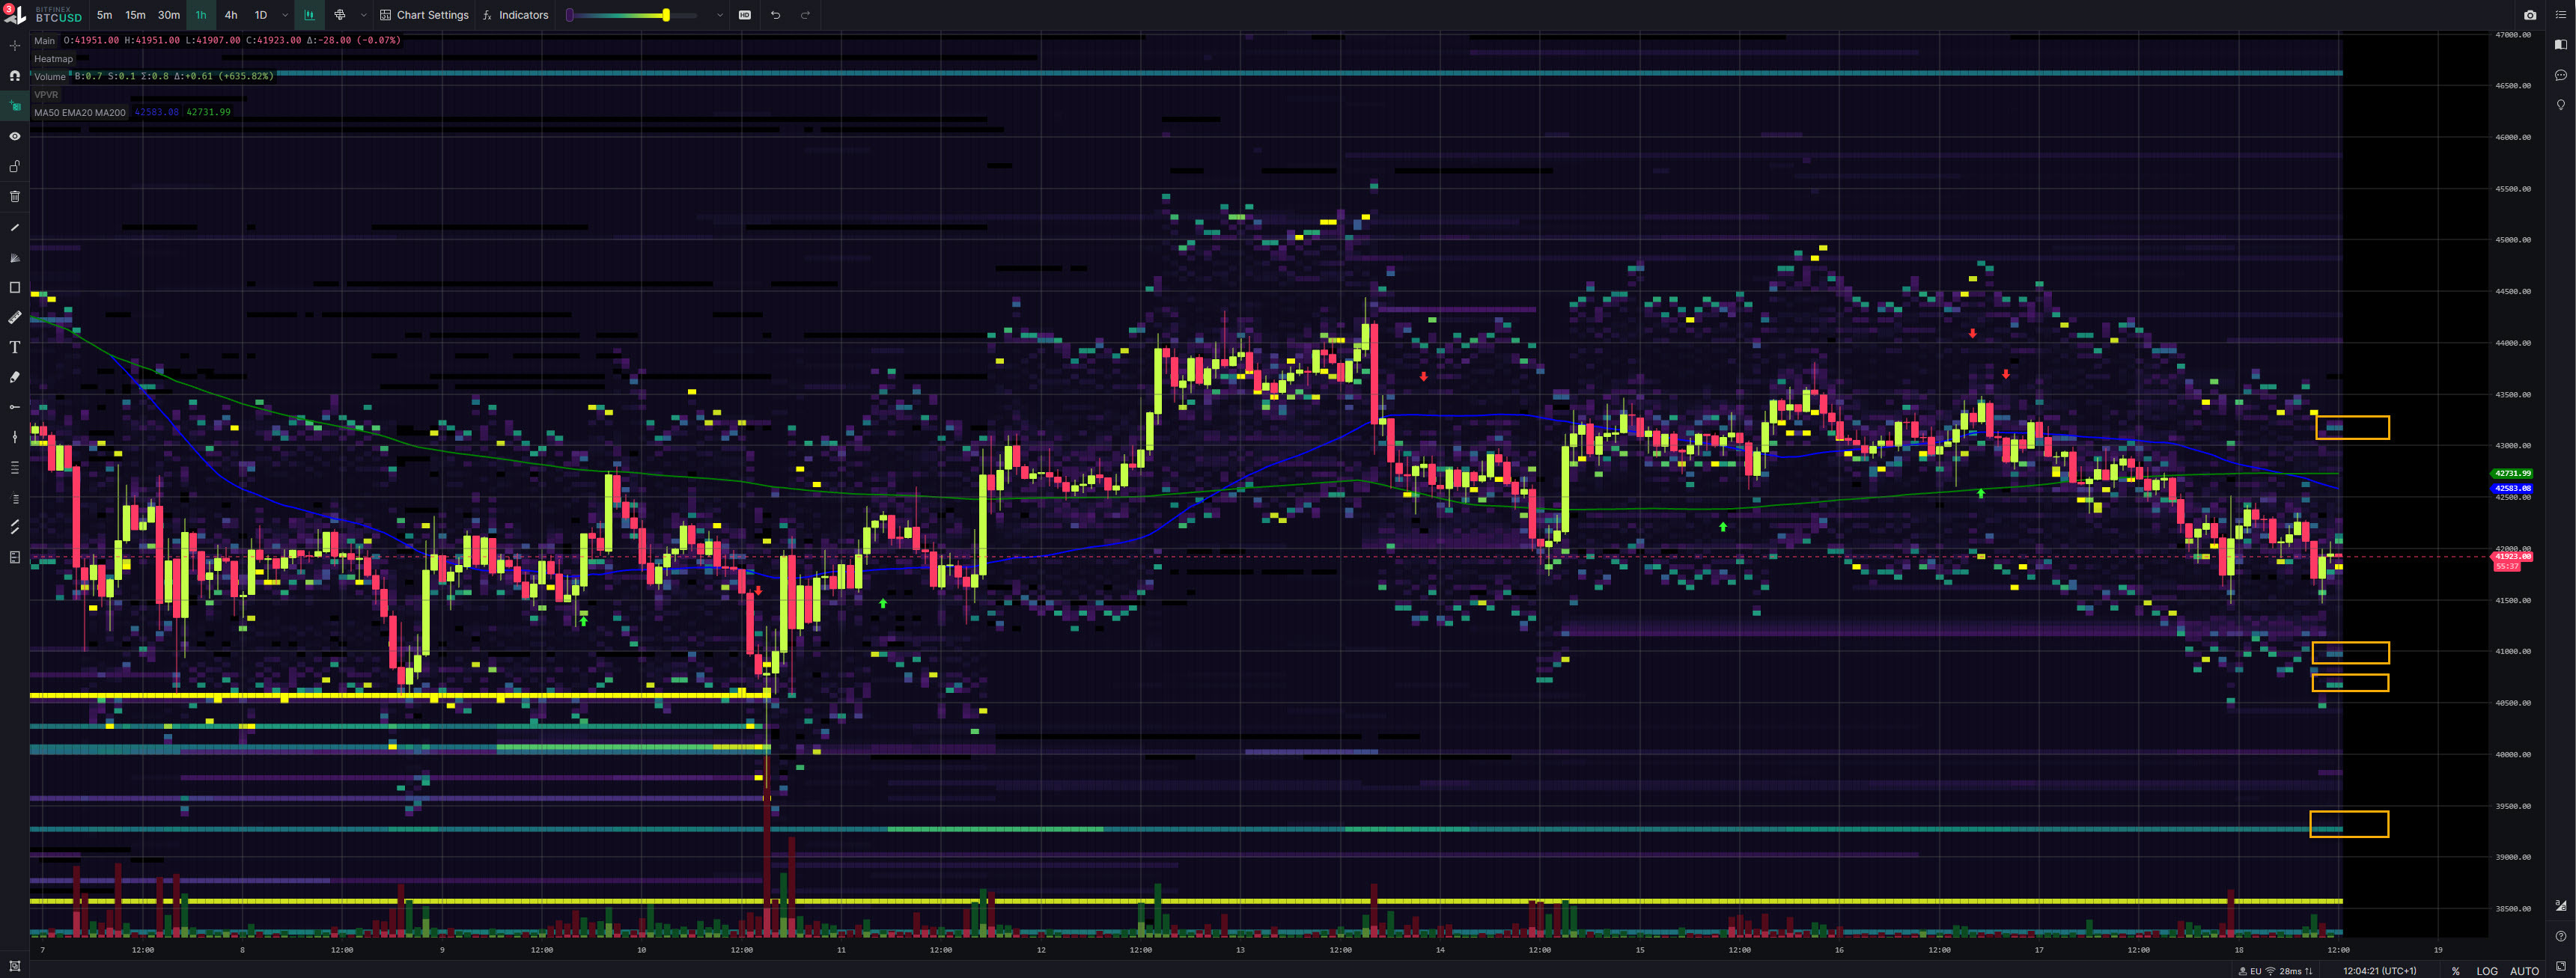
#4 - Bitfinex | Walls: Upper at 43.2k, Lower at 40.6k - 41k
#5 - Kraken | Walls: Upper at 44.8k, Lower at 38k
Inspos Conclusion and personal trade strategy
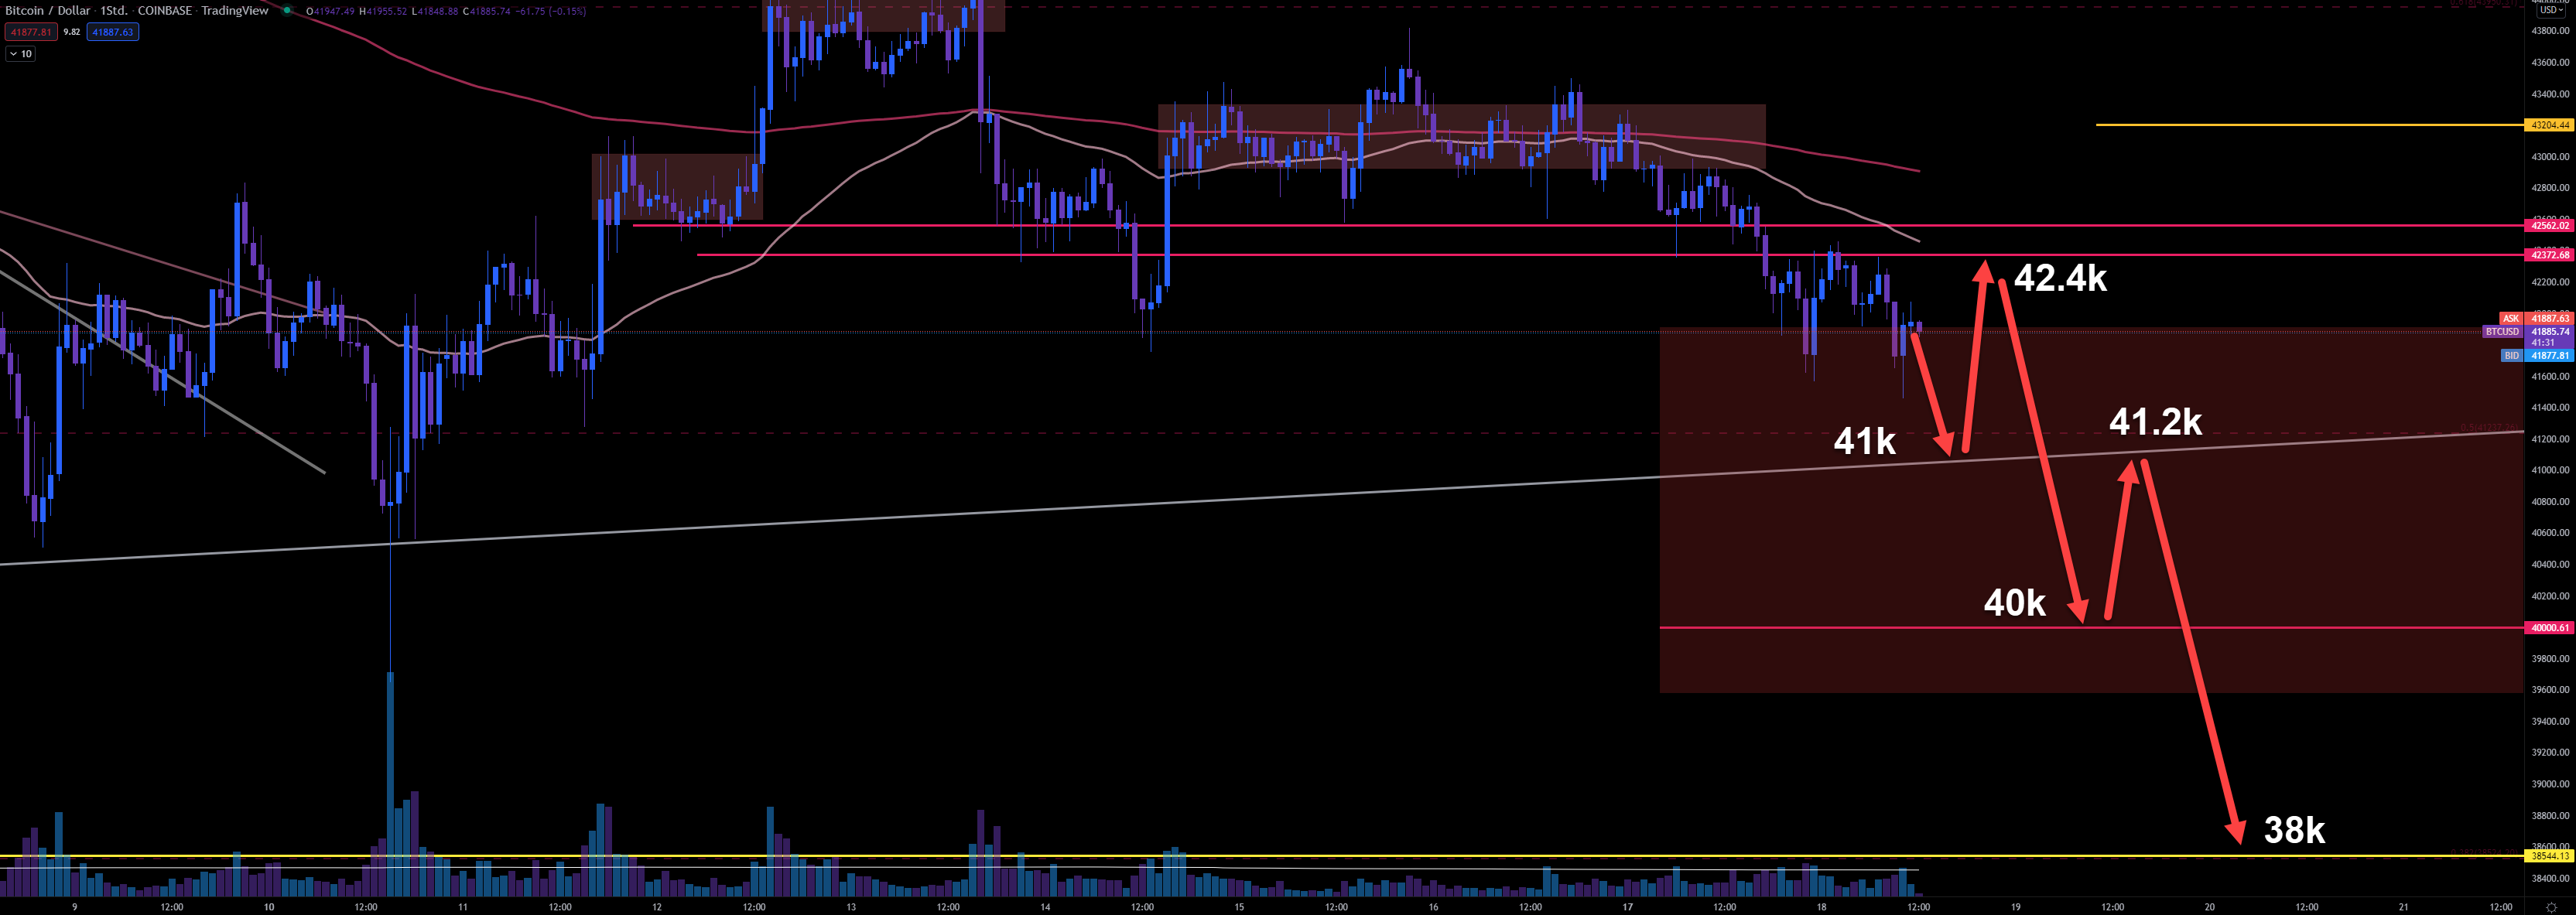
Based on my analysis I’m going to trade between 40k - 42.4k today, but 38k - 42.4k for the next few days if nothing big changes in the data. Since 42k shorting now and expecting 41k as our next level. That’s out long-term trendline. So, expecting here to retrace and rekt some high leverage shorts. Lift up heading Binance wall at 42.4k and bounce there to dump heading 40k to liquidate high leverage longs. Be careful rising volatility as soon we breakout the long-term trendline expected! Retrace at 40k and lifting up to our trendline (now resistance), now at 41.2k and finally, our dump (or flash crash) heading 38k. Is 38k our bottom? I cannot confirm that yet. However, I still think, even if we dump to 38k, we will retrace quick and maintain a level above 40k. I will try to long there with low leverage (max 5 with ETH or max 10 with BTC) if we really dump to 38k. Price action can flip quick. We are trading with low volume. So, please! Use these informations to make your own conclusions and to create an own trade strategy! I’m not here to provide you a trade strategy!




I am wondering, if price go down to 38K this week, only one week left to lift the price up to 48K(28JAN Max Pain)?Wow, tight schedule...
Great work again, thank you so much.