Bitcoin Market Analysis: Navigating Resistance at $61,500 Amidst Mixed Sentiments and Volatility
Options Data
1. Implied Volatility (IV)
Today's Data Analysis:
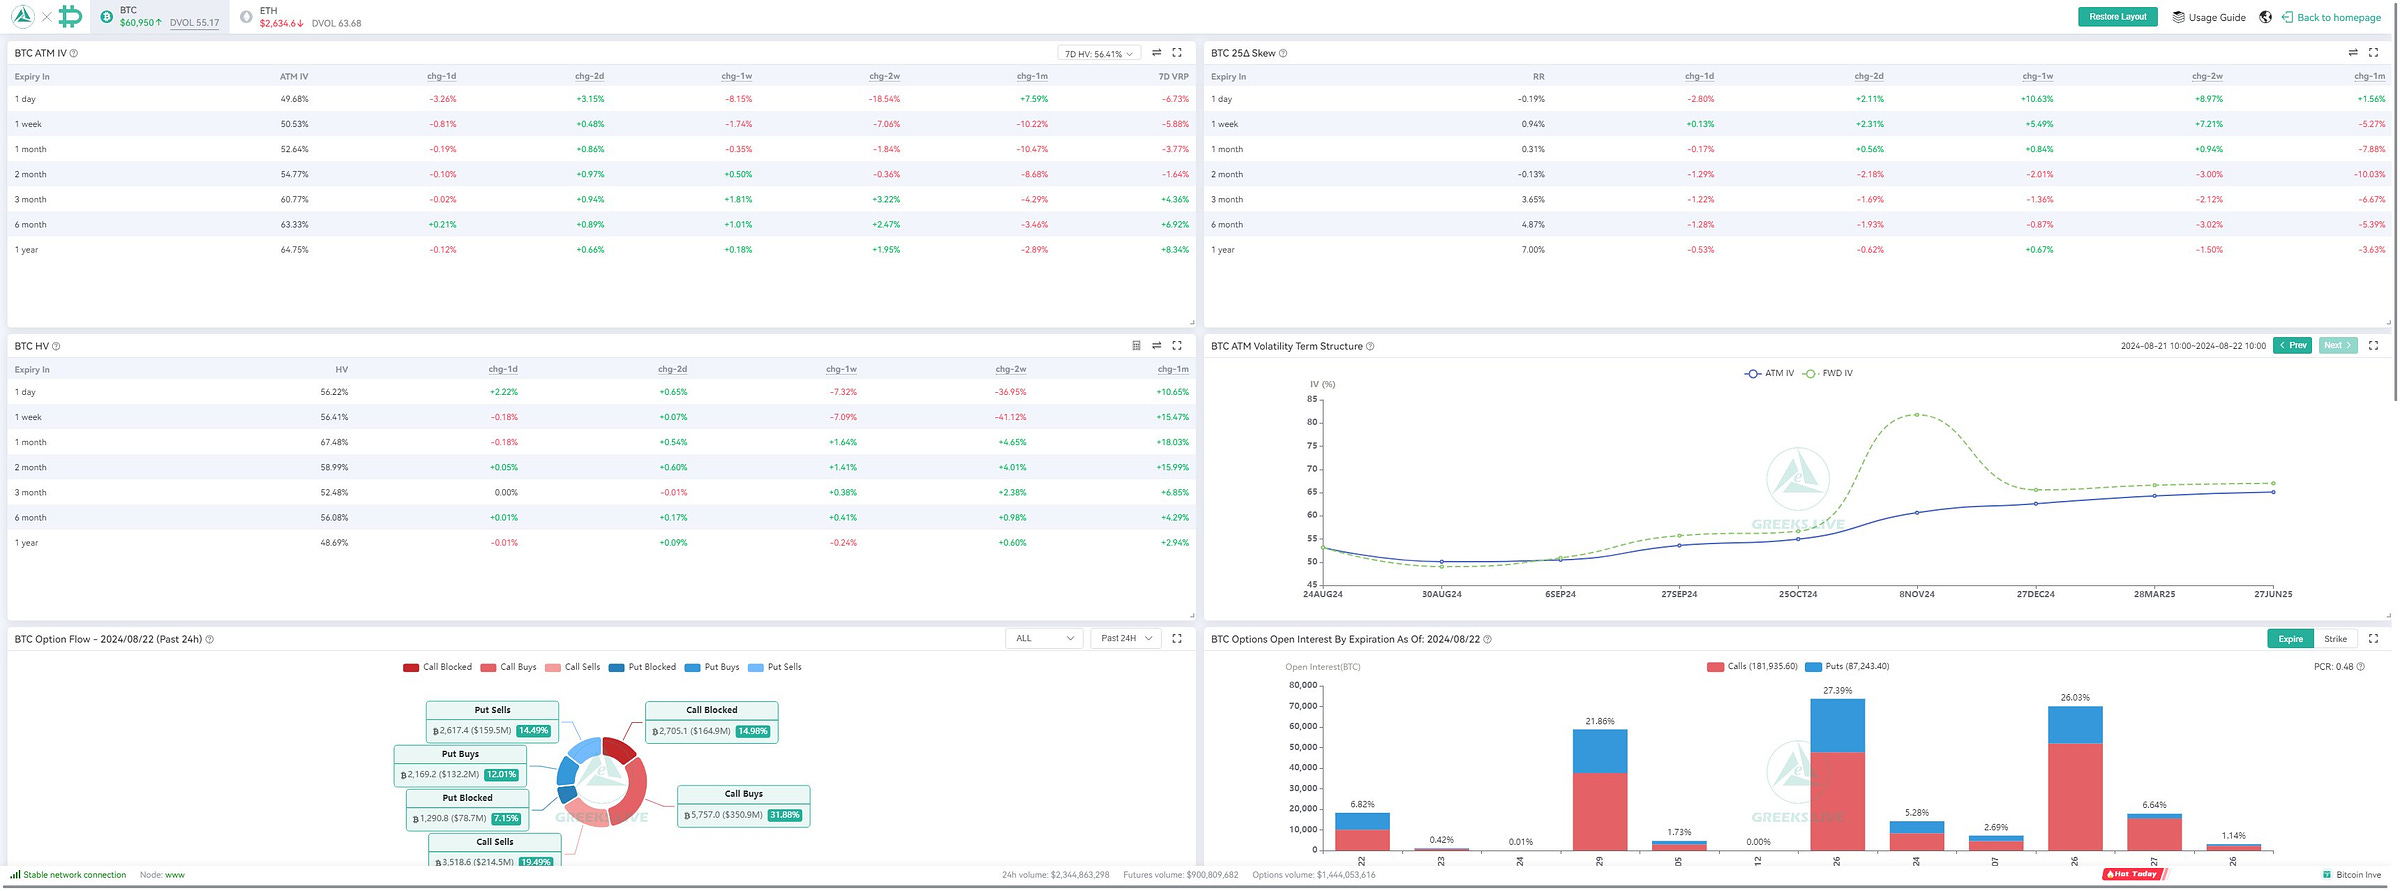
Implied volatility across various expirations shows a slight uptick, especially for short-term contracts. This indicates that the market anticipates increased price movements in the near term.
Conclusion:
Rising IV suggests that traders are preparing for higher volatility, possibly due to upcoming economic events or market uncertainty.
2. 25 Delta Skew
Today's Data Analysis:
The 25 Delta Skew is showing a slight preference for puts, indicating that traders are positioning for potential downside risks.
Conclusion:
The market sentiment appears cautious, with a slight bias towards downside protection.
3. Historical Volatility (HV)
Today's Data Analysis:
Historical volatility remains relatively stable, showing no significant changes compared to previous days.
Conclusion:
The market has experienced a period of stability, but this could change given the increase in implied volatility.
4. Volatility Risk Premium (VRP)
Today's Data Analysis:
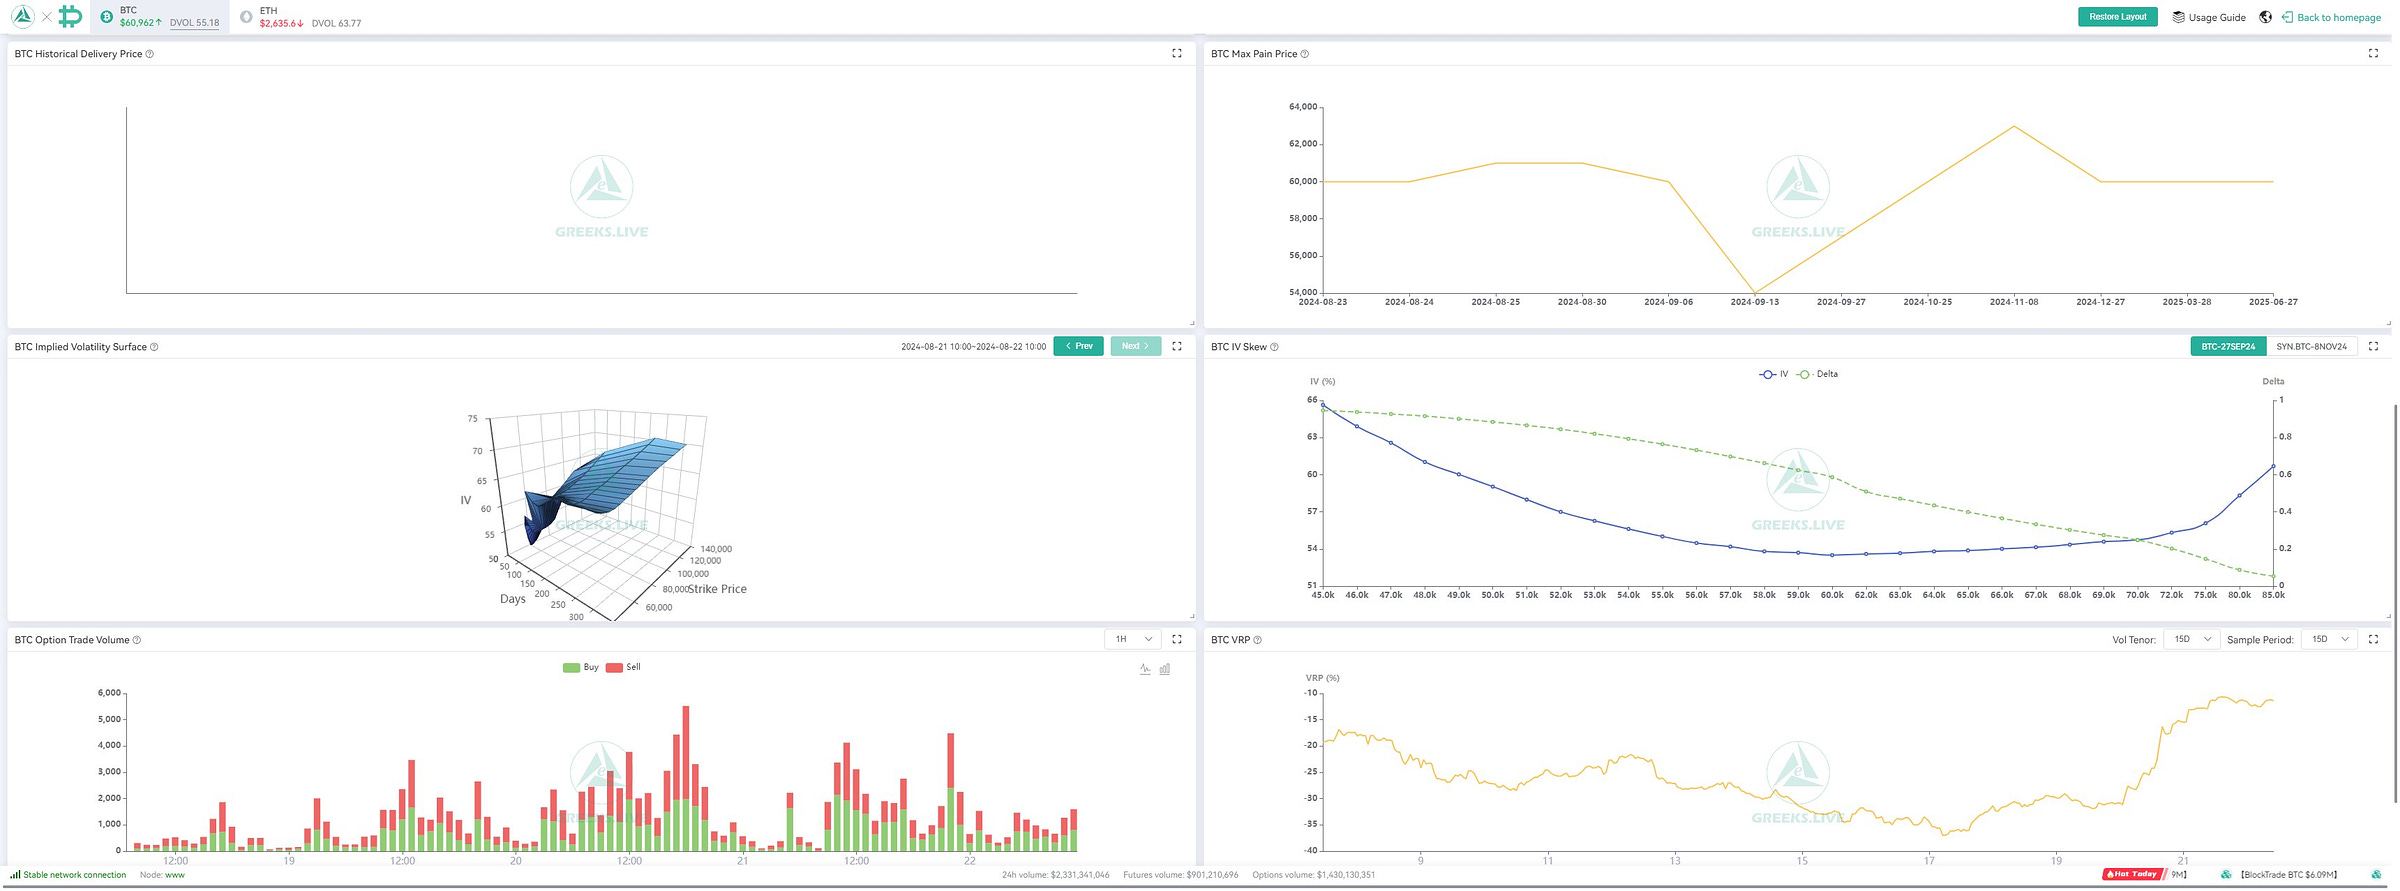
The VRP remains positive, indicating that implied volatility is higher than historical volatility.
Conclusion:
A positive VRP suggests that traders expect future volatility to increase, which is consistent with the observed rise in implied volatility.
5. Option Flow
Today's Data Analysis:
The option flow data indicates a balanced activity between calls and puts, with a slight preference for calls. This suggests some bullish sentiment.
Conclusion:
The mixed option flow indicates uncertainty in the market, with traders hedging against both potential upside and downside risks.
6. Strategy Flows
Today's Data Analysis:
Strategy flows show an increase in protective puts and call spreads, reflecting cautious optimism.
Conclusion:
Traders are hedging against downside risks while also positioning for potential gains, indicating a balanced but cautious market sentiment.
7. Greeks
Today's Data Analysis:
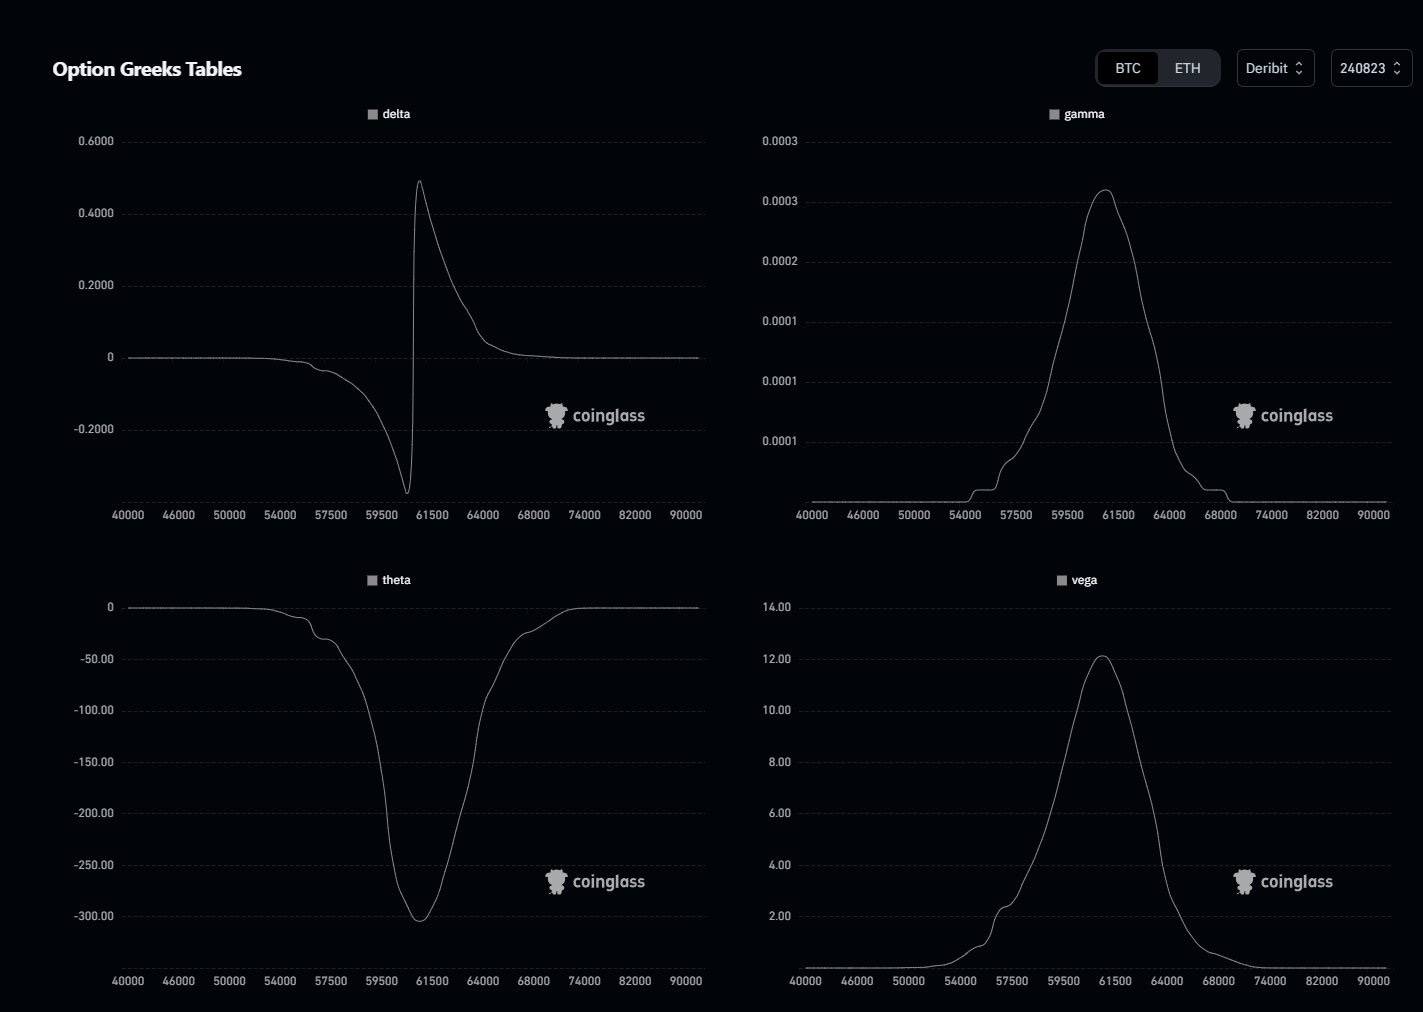
The Greeks show a concentrated activity around the $59,000 to $61,000 range, with significant delta and gamma levels. This indicates a critical price range where large movements could occur.
Conclusion:
The Greeks suggest that any price movement near this range could lead to increased volatility due to the high gamma levels.
Today's Options Data Summary
The data presents a market that is preparing for volatility, with traders showing a slight preference for downside protection. The rise in implied volatility and positive VRP suggests that traders expect significant price movements, particularly in the short term.
Possible Impact on the Market in the Next 24 Hours
Given the rise in implied volatility and cautious sentiment reflected in the skew and option flows, the market may experience increased volatility. The next 24 hours could see significant price fluctuations, particularly in response to economic events.
Possible Impact on the Market by the End of the Week (25.08.2024)
The end of the week could see further volatility, especially with key economic events like the Jackson Hole Symposium. The market's current positioning suggests a cautious outlook, with potential for both upward and downward movements depending on the outcomes of these events.
Sentiment Evaluation
Bullish/Bearish Rating: 4/10
0 (extreme bearish) - 10 (extreme bullish)
The sentiment is slightly bearish, reflecting caution and preparation for potential downside risks, especially in the short term.
Futures Market Analysis
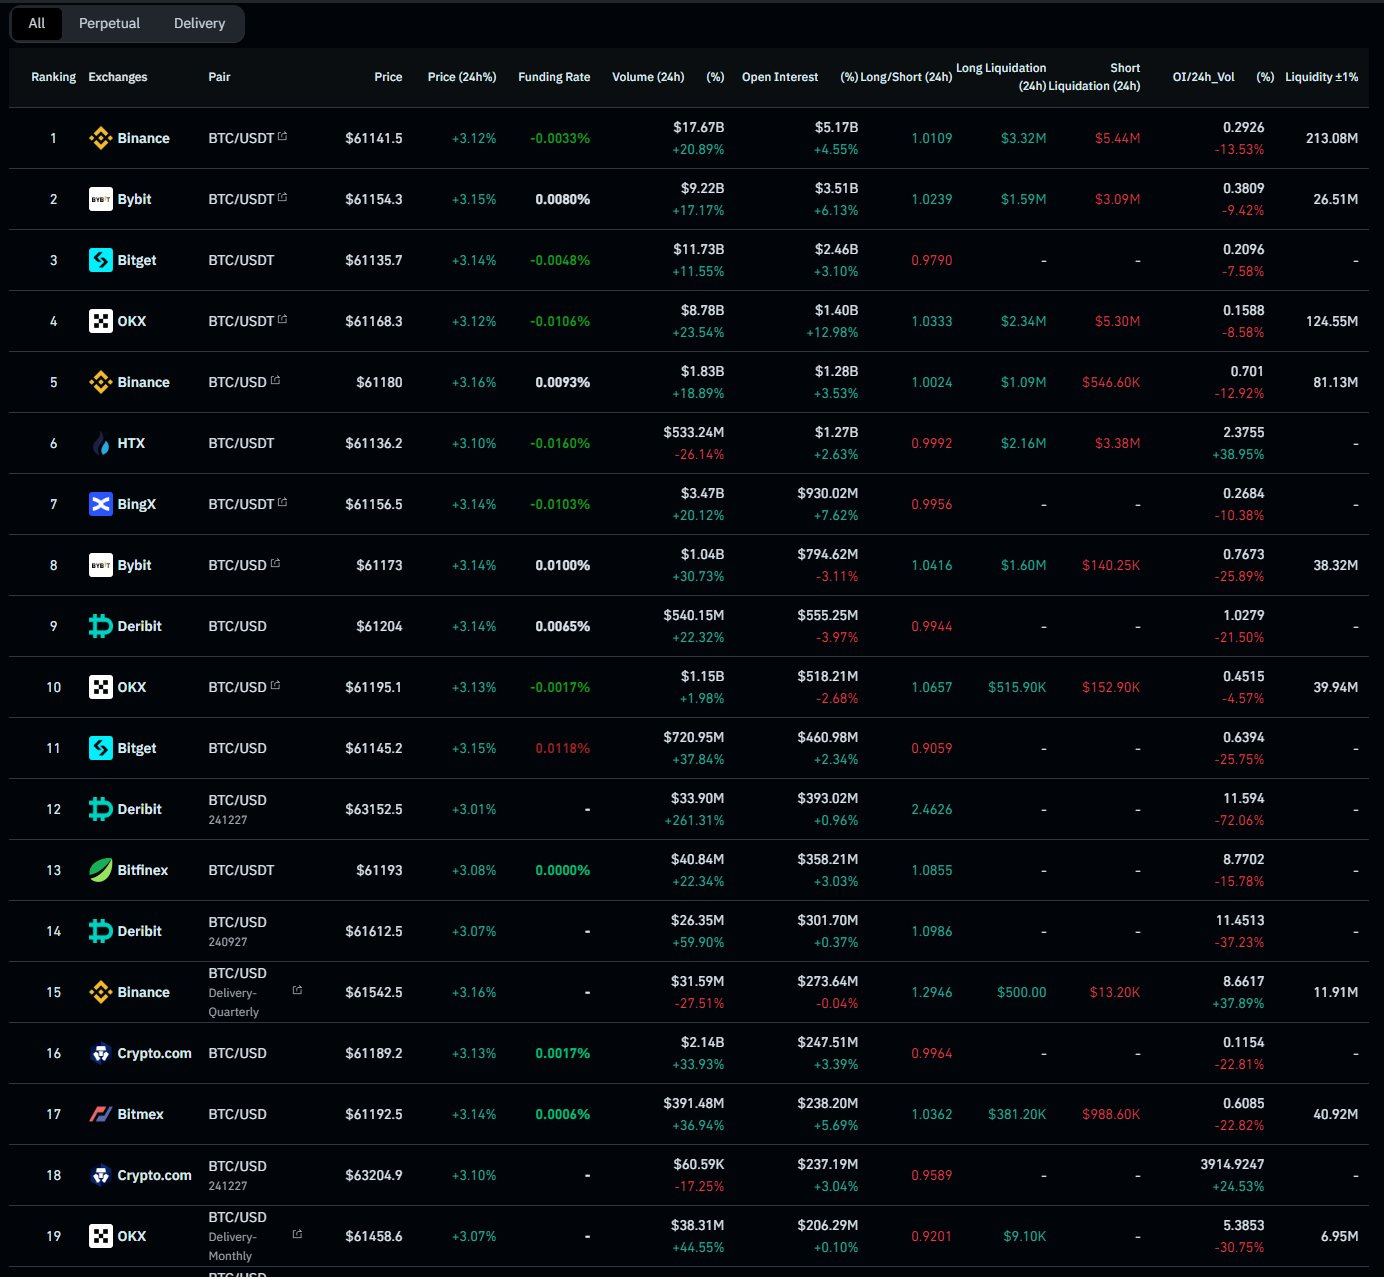
1. Price Movement and Volume:
Today's Data Analysis:
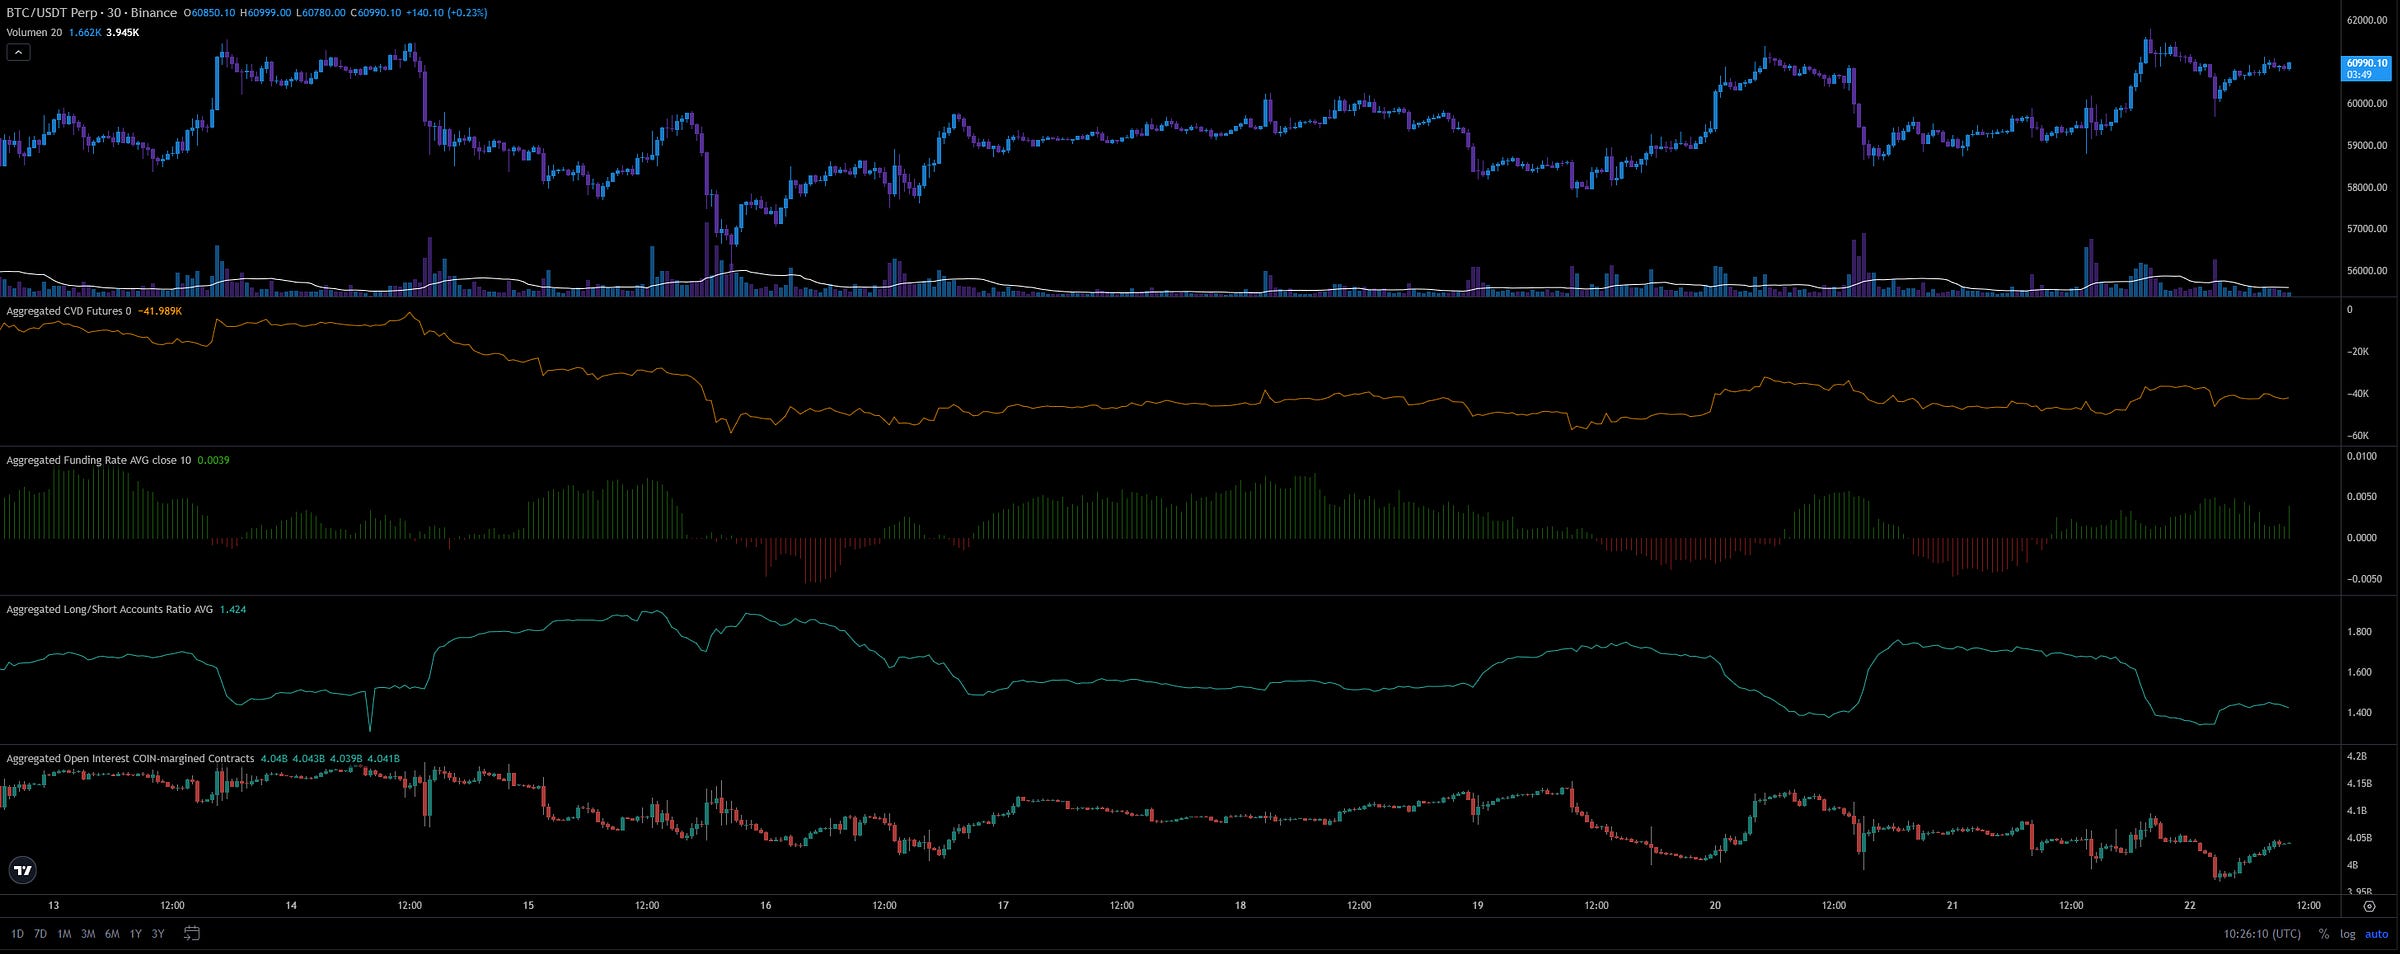
The market shows a steady increase in price with a corresponding rise in volume across major exchanges, indicating strong buying interest.
Conclusion:
The increased volume suggests strong momentum behind the price increase, potentially signaling continued upward movement if this trend persists.
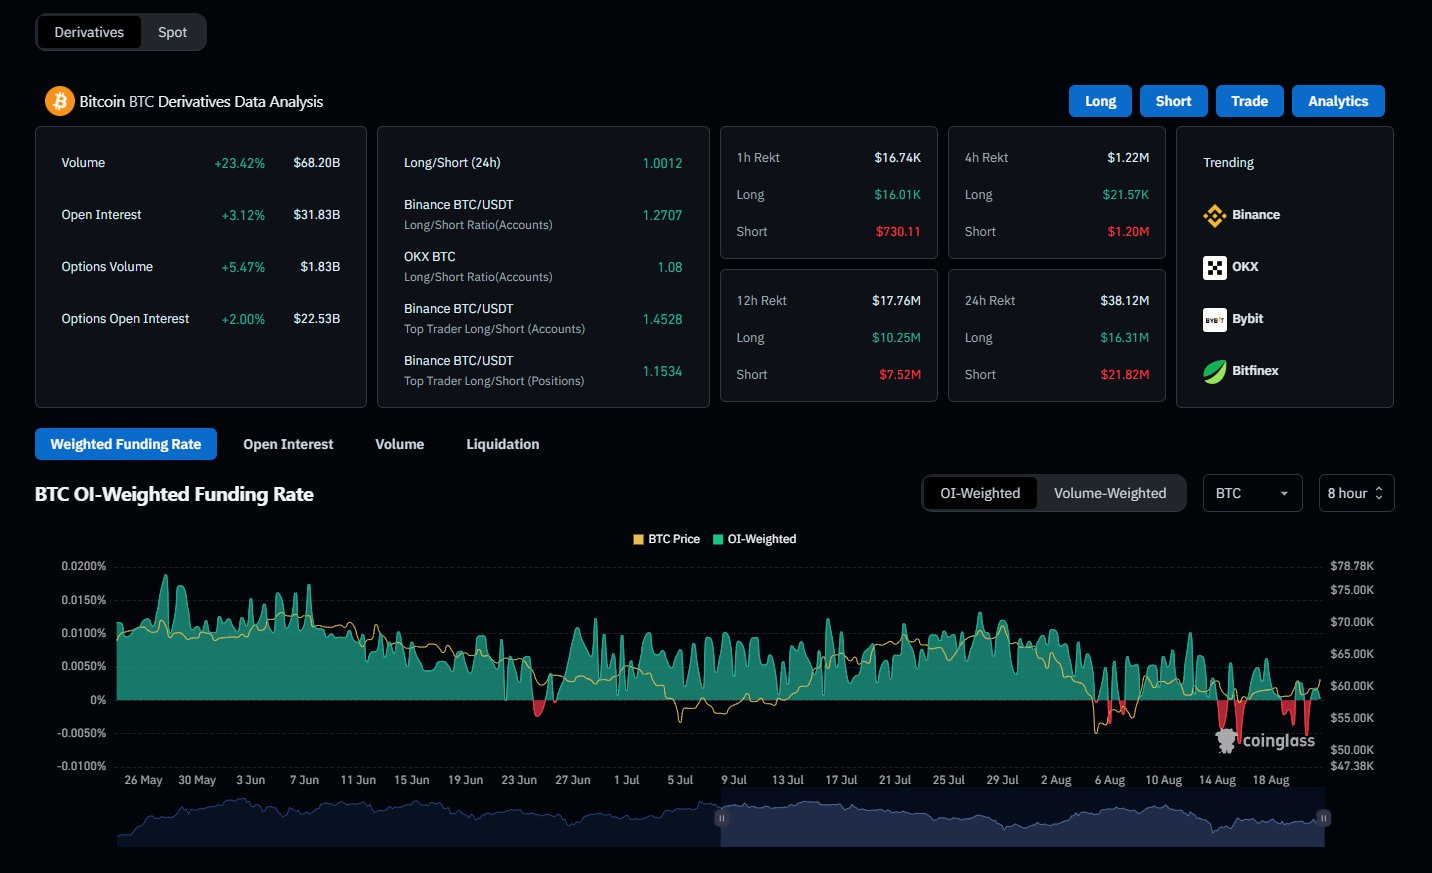
2. Funding Rate
Today's Data Analysis: The funding rates are mixed, with some exchanges showing slightly positive rates while others are neutral or slightly negative.
Conclusion: The neutral funding rates indicate a balanced market, with no clear bias toward either longs or shorts. This suggests that the market is in a wait-and-see mode, with participants positioning cautiously.
3. Cumulative Volume Delta (CVD) and Open Interest
Today's Data Analysis:
The CVD indicates that buyers have been more aggressive, while open interest continues to rise, signaling that new positions are being opened.
Conclusion:
The aggressive buying pressure, coupled with rising open interest, suggests that bulls are gaining control. This could lead to further price increases if the buying pressure continues.
4. Long/Short Ratio
Today's Data Analysis:
The long/short ratio shows a slight preference for long positions, particularly on major exchanges like Binance and Bybit.
Conclusion:
The market is slightly bullish, with more traders expecting the price to rise. However, the ratio is not extreme, indicating that there is still room for a reversal if market conditions change.
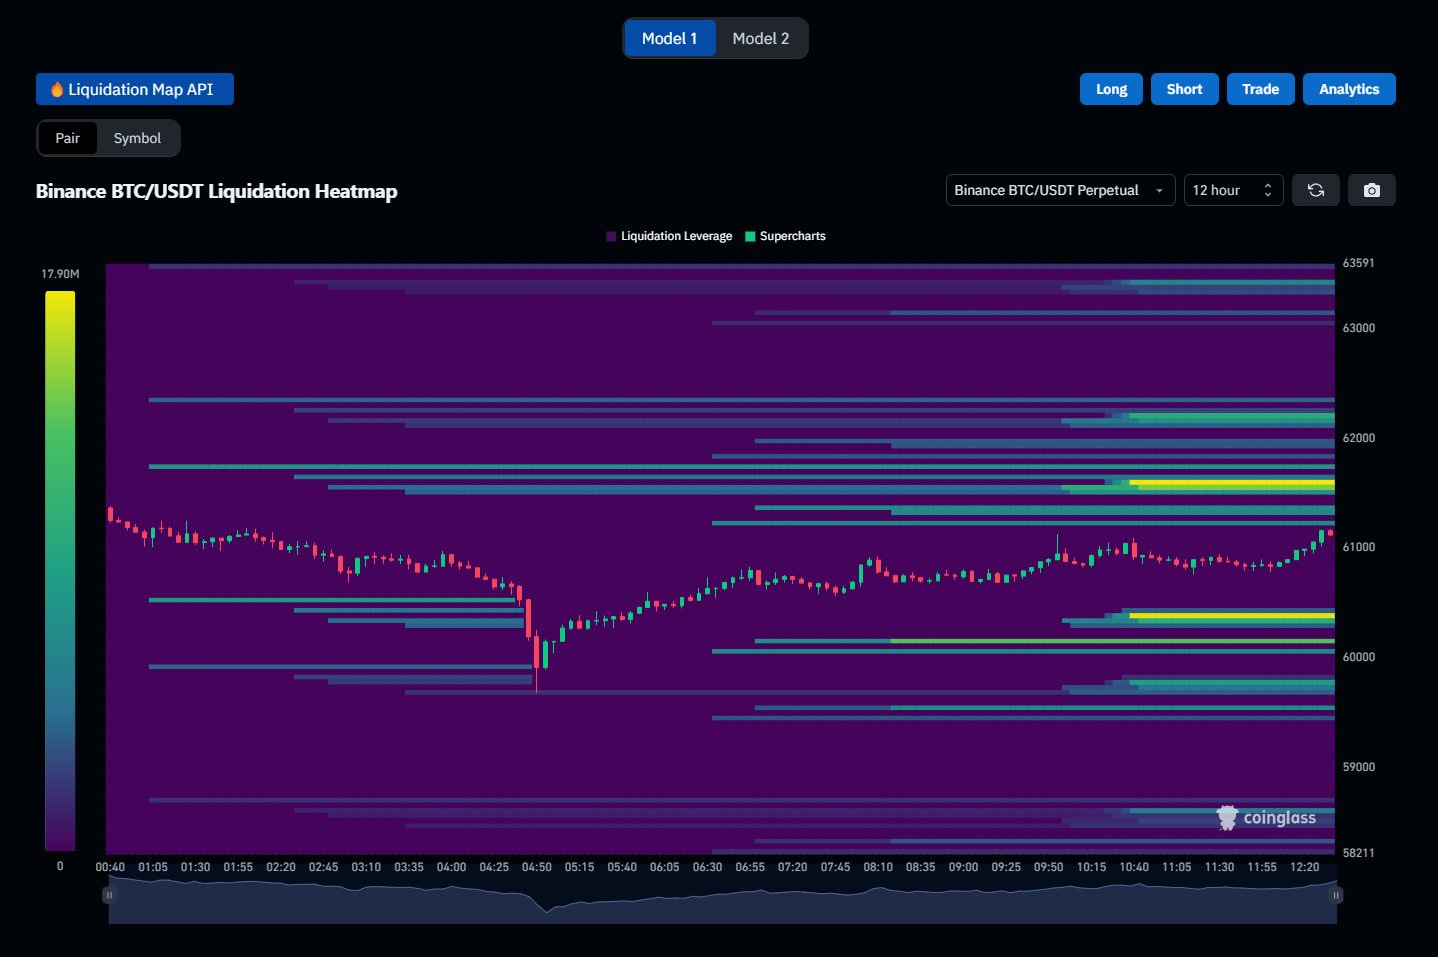
5. Binance BTC/USDT Liquidation Heatmap
Today's Data Analysis:
The liquidation heatmap shows significant potential for short liquidations if the price moves above $62,000, with clusters of liquidations visible at higher levels.
Conclusion:
The presence of large liquidation clusters above the current price could trigger a short squeeze, pushing the price higher rapidly if these levels are breached.
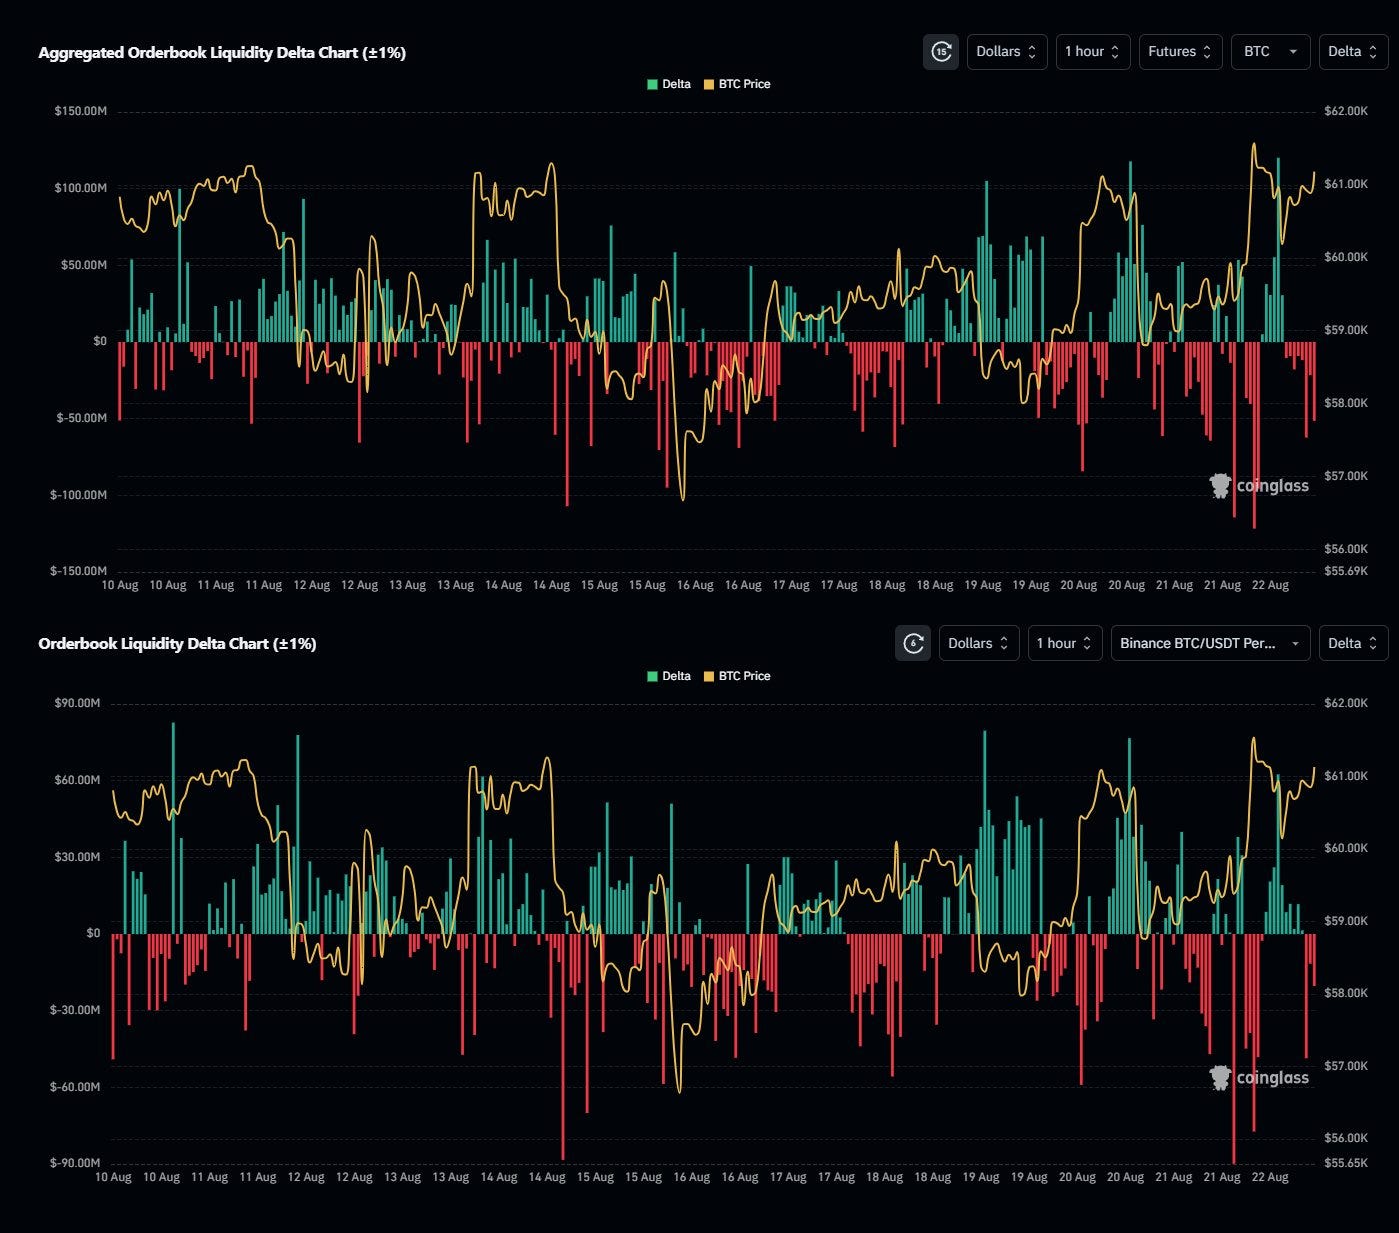
6. Futures Orderbook Liquidity Delta
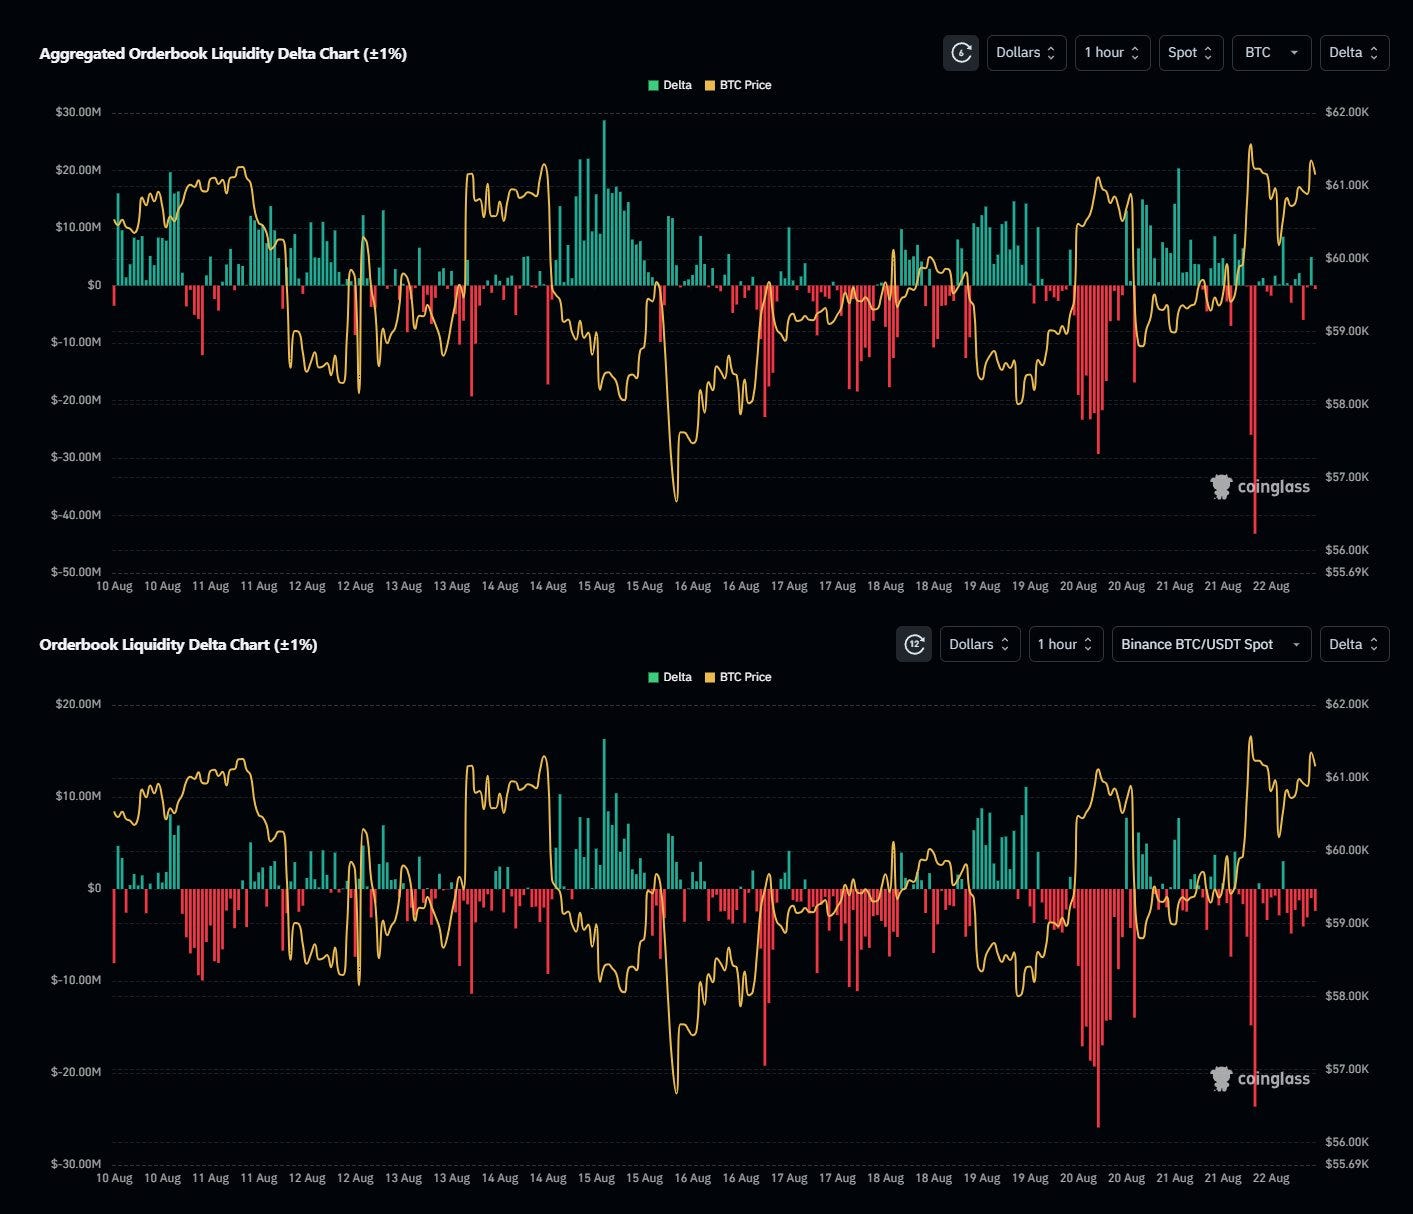
Aggregated Orderbook Liquidity Delta Chart (±1%)
Today's Data Analysis:
The aggregated liquidity delta shows more significant buy-side liquidity, with large bids absorbing sell pressure around the $58,000 to $60,000 range.
Conclusion:
The buy-side liquidity suggests strong support in the $58,000 to $60,000 range, making it a key level to watch for potential bounce or breakdown.
Orderbook Liquidity Delta Chart (±1%) (Binance BTC/USDT Perpetual)
Today's Data Analysis:
Similar to the aggregated data, the Binance-specific order book shows strong buy-side liquidity, with bids outweighing asks in the $58,000 to $60,000 range.
Conclusion:
Binance's order book reinforces the notion of strong support around $58,000 to $60,000, with the potential for a bounce if these levels hold.
Today's Futures Data Summary
The market is showing signs of bullish momentum with increased volume, rising open interest, and a slight long bias.
The mixed funding rates suggest caution among traders, but the presence of significant buy-side liquidity indicates strong support levels.
The liquidation heatmap highlights the risk of a short squeeze if the price continues to rise.
Potential Impact on the Market in the Next 24 Hours
If the price breaks above $62,000, a short squeeze could push the price toward $65,000 rapidly.
However, if support at $58,000 fails, we might see a quick drop to $55,000 or lower.
Potential Impact on the Market Until the End of the Week
The market is likely to remain volatile, with key levels at $58,000 and $62,000 acting as crucial support and resistance.
Economic events could add further volatility, leading to sharp moves in either direction.
Sentiment Evaluation
Bullish/Bearish Rating: 6/10
0 (extreme bearish) - 10 (extreme bullish)
The market leans slightly bullish with potential for further gains, but caution is advised due to the presence of significant resistance and external economic factors that could trigger volatility.
Comprehensive Spot Market Analysis
1. Price Movement and Volume
Today's Data Analysis:
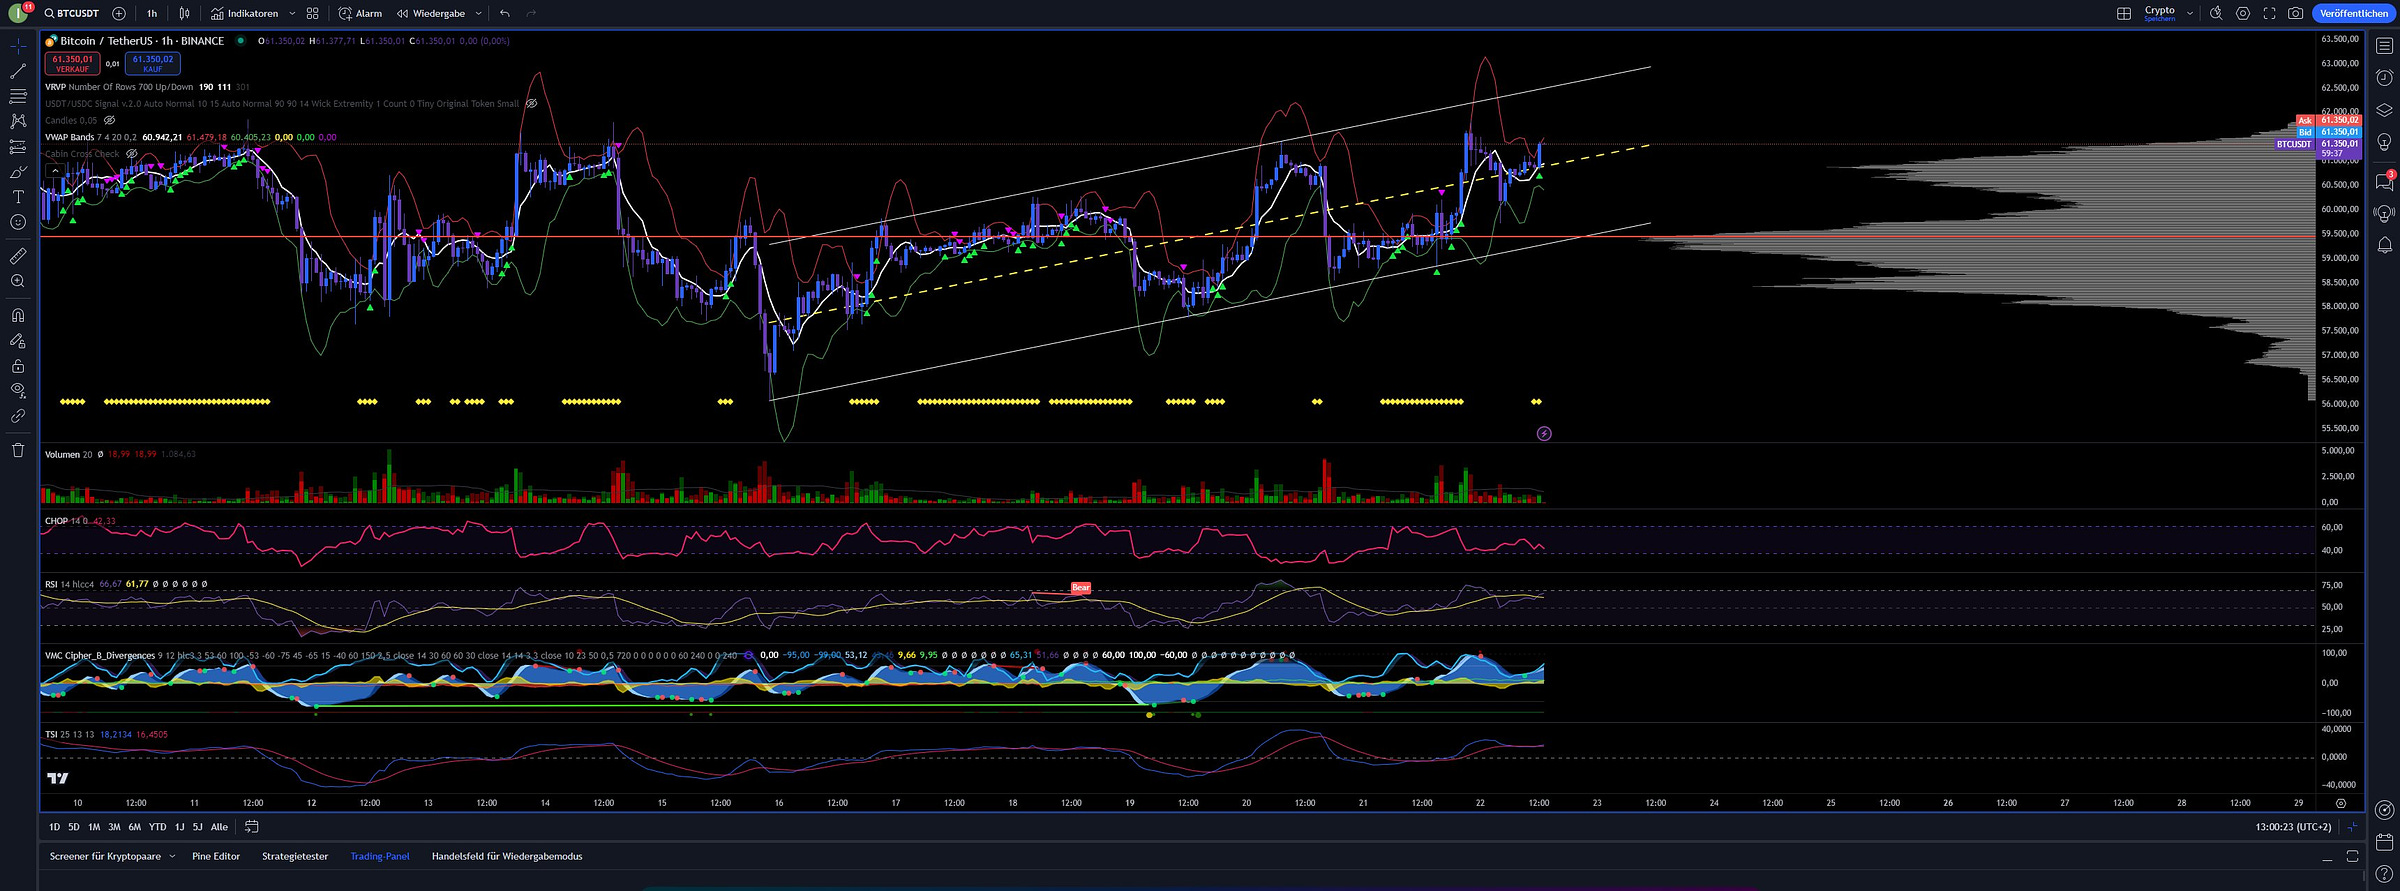
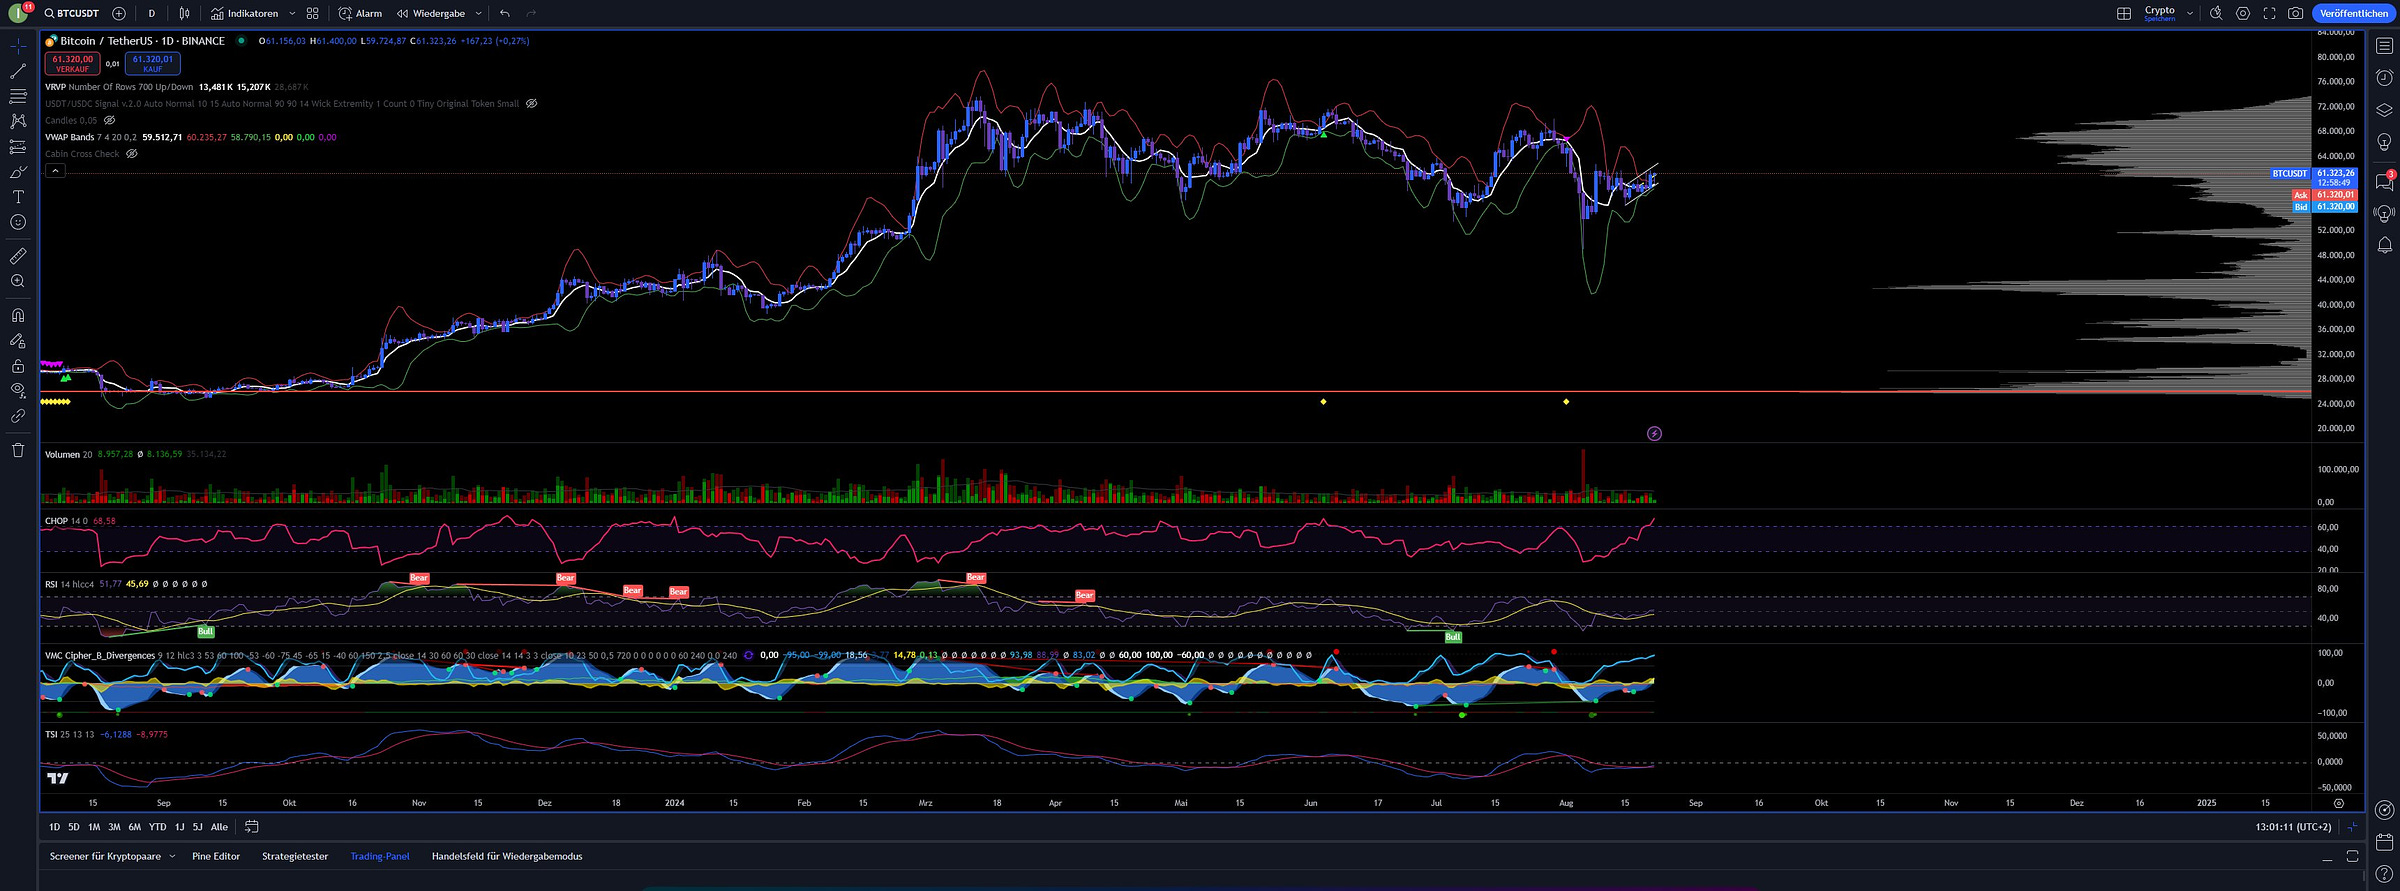
The 1H TF shows Bitcoin trading within an ascending channel, with a recent attempt to break resistance at $61,300. Volume spikes have correlated with attempts to break this resistance, but overall, the volume remains relatively low, especially on the 1D TF.
Conclusion:
The price shows short-term bullishness with higher lows, but the low volume could hinder a sustained breakout above $61,300.
2. Spot Orderbook Liquidity Delta
Aggregated Orderbook Liquidity Delta Chart (±1%)
Today's Data Analysis:
The aggregated liquidity delta shows significant sell-side liquidity on August 21-22, indicating strong resistance as Bitcoin approaches the $61,300 level.
Conclusion:
The sell-side liquidity may act as a barrier to further price increases in the short term.
Orderbook Liquidity Delta Chart (±1%) (Binance BTC/USDT)
Today's Data Analysis:
The Binance-specific liquidity delta mirrors the aggregated data, with substantial sell orders creating resistance at key levels.
Conclusion:
Similar to the aggregated data, Binance's orderbook suggests resistance around $61,300, which could limit short-term upward movement.
3. Technical Analysis
Today's Data Analysis:
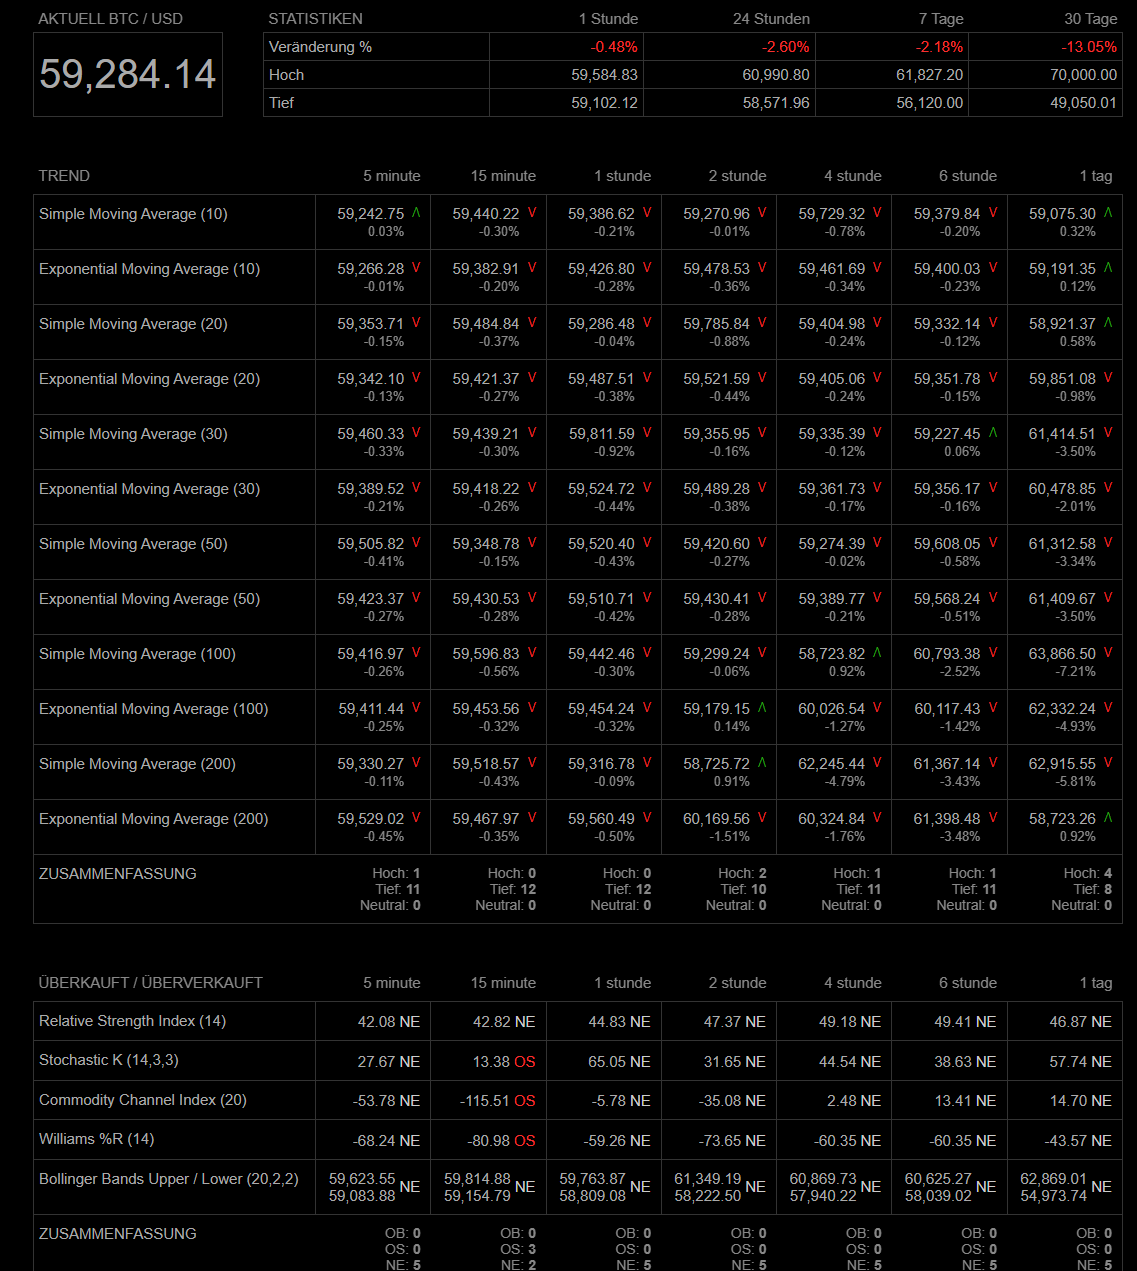
The 1H chart shows mixed signals. Short-term moving averages indicate bullish momentum, but the RSI and other oscillators are showing bearish divergences. On the 1D chart, the price is attempting to recover, but the volume is low, and longer-term indicators are mixed.
Conclusion:
Technical indicators point to short-term bullish momentum, but with warning signs of potential bearish reversals if the resistance holds.
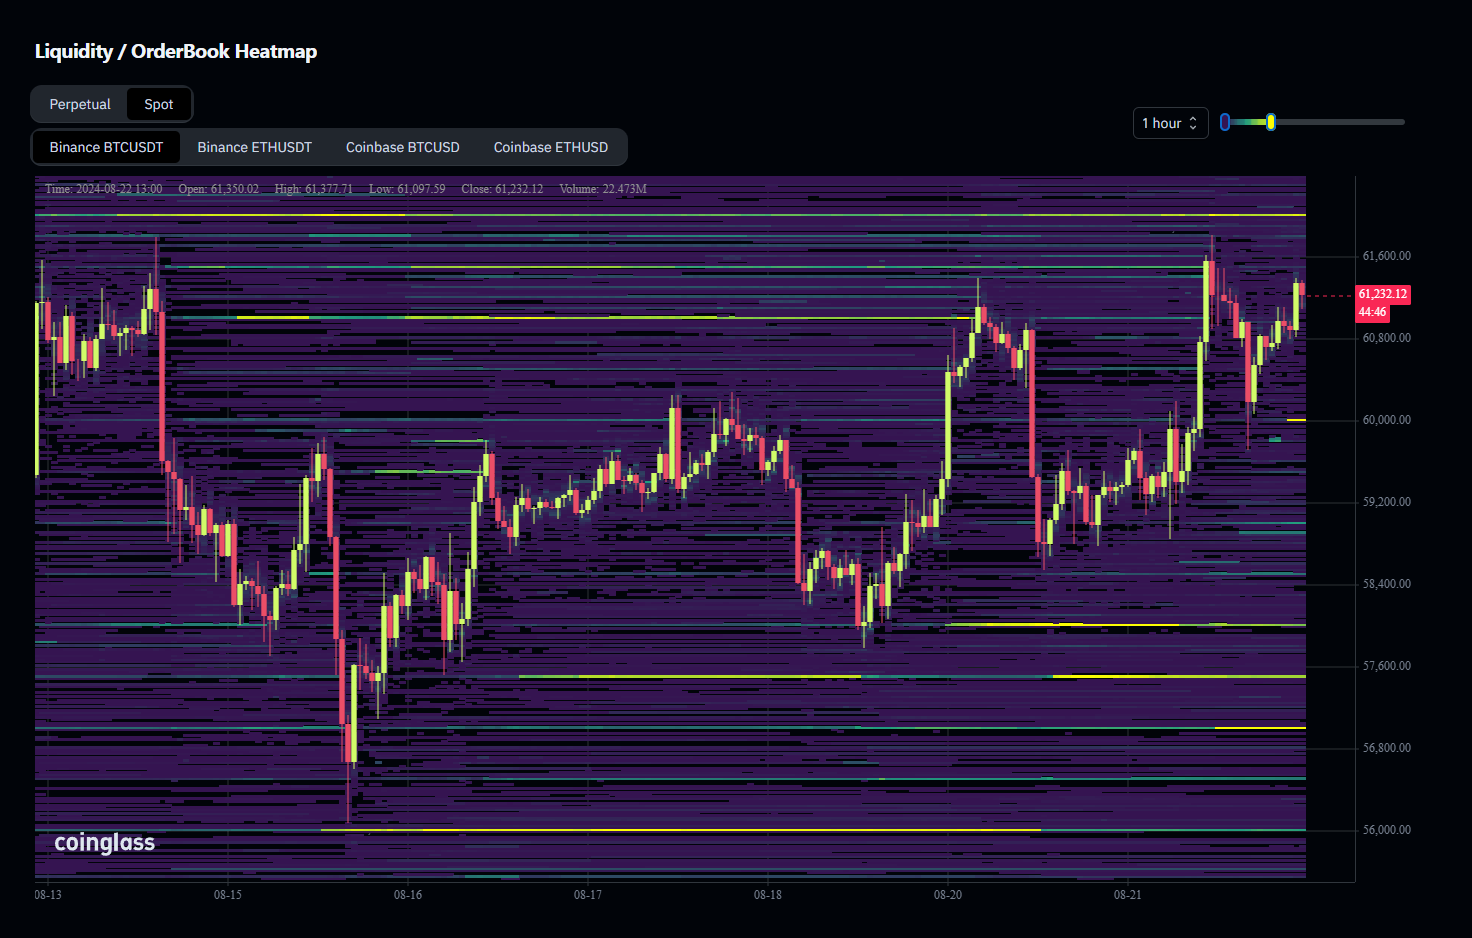
4. Spot Liquidity / OrderBook Heatmap (Binance BTC/USDT)
Today's Data Analysis:
The heatmap shows significant liquidity around the $61,300-$61,500 level, with the strongest sell orders clustered around these prices. This indicates a potential ceiling for price increases in the near term.
Conclusion:
The liquidity heatmap suggests strong resistance between $61,300 and $61,500, which could prevent further price gains.
5. BTC Spot Inflow/Outflow
Today's Data Analysis:
Recent data shows positive netflows into exchanges, which typically indicates potential selling pressure as more BTC is available on exchanges.
Conclusion:
The positive netflows suggest that there may be increased selling pressure, which could cap price increases or lead to a short-term pullback.
Today's Spot Data Summary
The Spot market indicates short-term bullish momentum with significant resistance at the $61,300-$61,500 level. The mixed technical signals and orderbook data suggest that this resistance could hold unless volume increases significantly.
Possible Impact on the Market in the Next 24 Hours
Bitcoin may struggle to break through the $61,300-$61,500 resistance due to sell-side liquidity and potential selling pressure from positive netflows. A consolidation or minor pullback to support levels around $60,000 is possible.
Possible Impact on the Market by the End of the Week (25.08.2024)
If the resistance holds, Bitcoin could enter a consolidation phase or see a gradual decline toward $59,500. A breakout above $61,500 would require a significant increase in buying volume and could lead to a move toward $62,500 or higher.
Sentiment Evaluation
Bullish/Bearish Sentiment: 6/10 (Slightly Bullish)
0 (extreme bearish) - 10 (extreme bullish)
Final Market Evaluation
Summary of Today's Analyses
Options Market:
The data reflects a mixed outlook with slight bullish tendencies, but the 25-Delta Skew indicates uncertainty, particularly with the upcoming Initial Jobless Claims data influencing trader caution.
Futures Market:
The data shows short-term bullish momentum but with increased volatility. The rising Open Interest suggests more market participation, but the liquidation heatmap highlights risks of sudden price swings.
Spot Market/Technical Analysis:
The spot market shows bullish momentum but faces strong resistance at $61,300 to $61,500. Volume is insufficient for a significant breakout, and order book data reveals substantial sell-side pressure at these levels.
Average Trader Sentiment
Sentiment Rating: 5.5/10 (Neutral to slightly bullish)
Traders are cautiously optimistic, but there are clear signs of uncertainty and potential volatility.
Price Forecast for the Next 24 Hours
Based on today's analysis, Bitcoin may continue attempting to break the $61,300 to $61,500 resistance. However, a genuine breakout seems unlikely without a substantial volume increase. A pullback toward $60,000 or even $59,500 is possible if resistance holds.
Price Forecast for the Rest of the Week
If Bitcoin breaks through the $61,500 level with increasing volume, a move toward $62,500 to $63,000 could follow. Otherwise, consolidation between $59,500 and $61,000 is likely, especially if market volume remains low and selling pressure persists.
Key Support and Resistance
Key Support: $59,500
Key Resistance: $61,500
Factors to Watch for a Genuine Breakout
Volume:
A genuine breakout requires strong volume to absorb the selling pressure above $61,500.
Order Book Data:
Monitor the order book to see if large sell orders dissipate or if new sell orders accumulate at higher levels.
Funding Rate and Liquidations:
Positive funding rates and minimal liquidations would support a sustained breakout.


