Hello everyone,
It's been a while since my last post, but I haven't forgotten about you. I'll be sharing with you here what I also share with the 5 subscribers on X. I'll continue this over the next few weeks until I've reviewed all the subscribers from last year.
I'll be restarting the daily analysis, but I can no longer maintain the intensity of last year. It wasn't good for me or my health.
The daily analysis will focus exclusively on Bitcoin, but from time to time, I'll also share my trades in commodities, stocks, ETFs, and crypto. Always with the reminder that these are not trade recommendations; the information is solely for entertainment purposes.
Enjoy the latest edition of the Bitcoin analysis.
#Bitcoin Options Data Analysis (Weekend)
1. Implied and Historical Volatility (IV and HV)
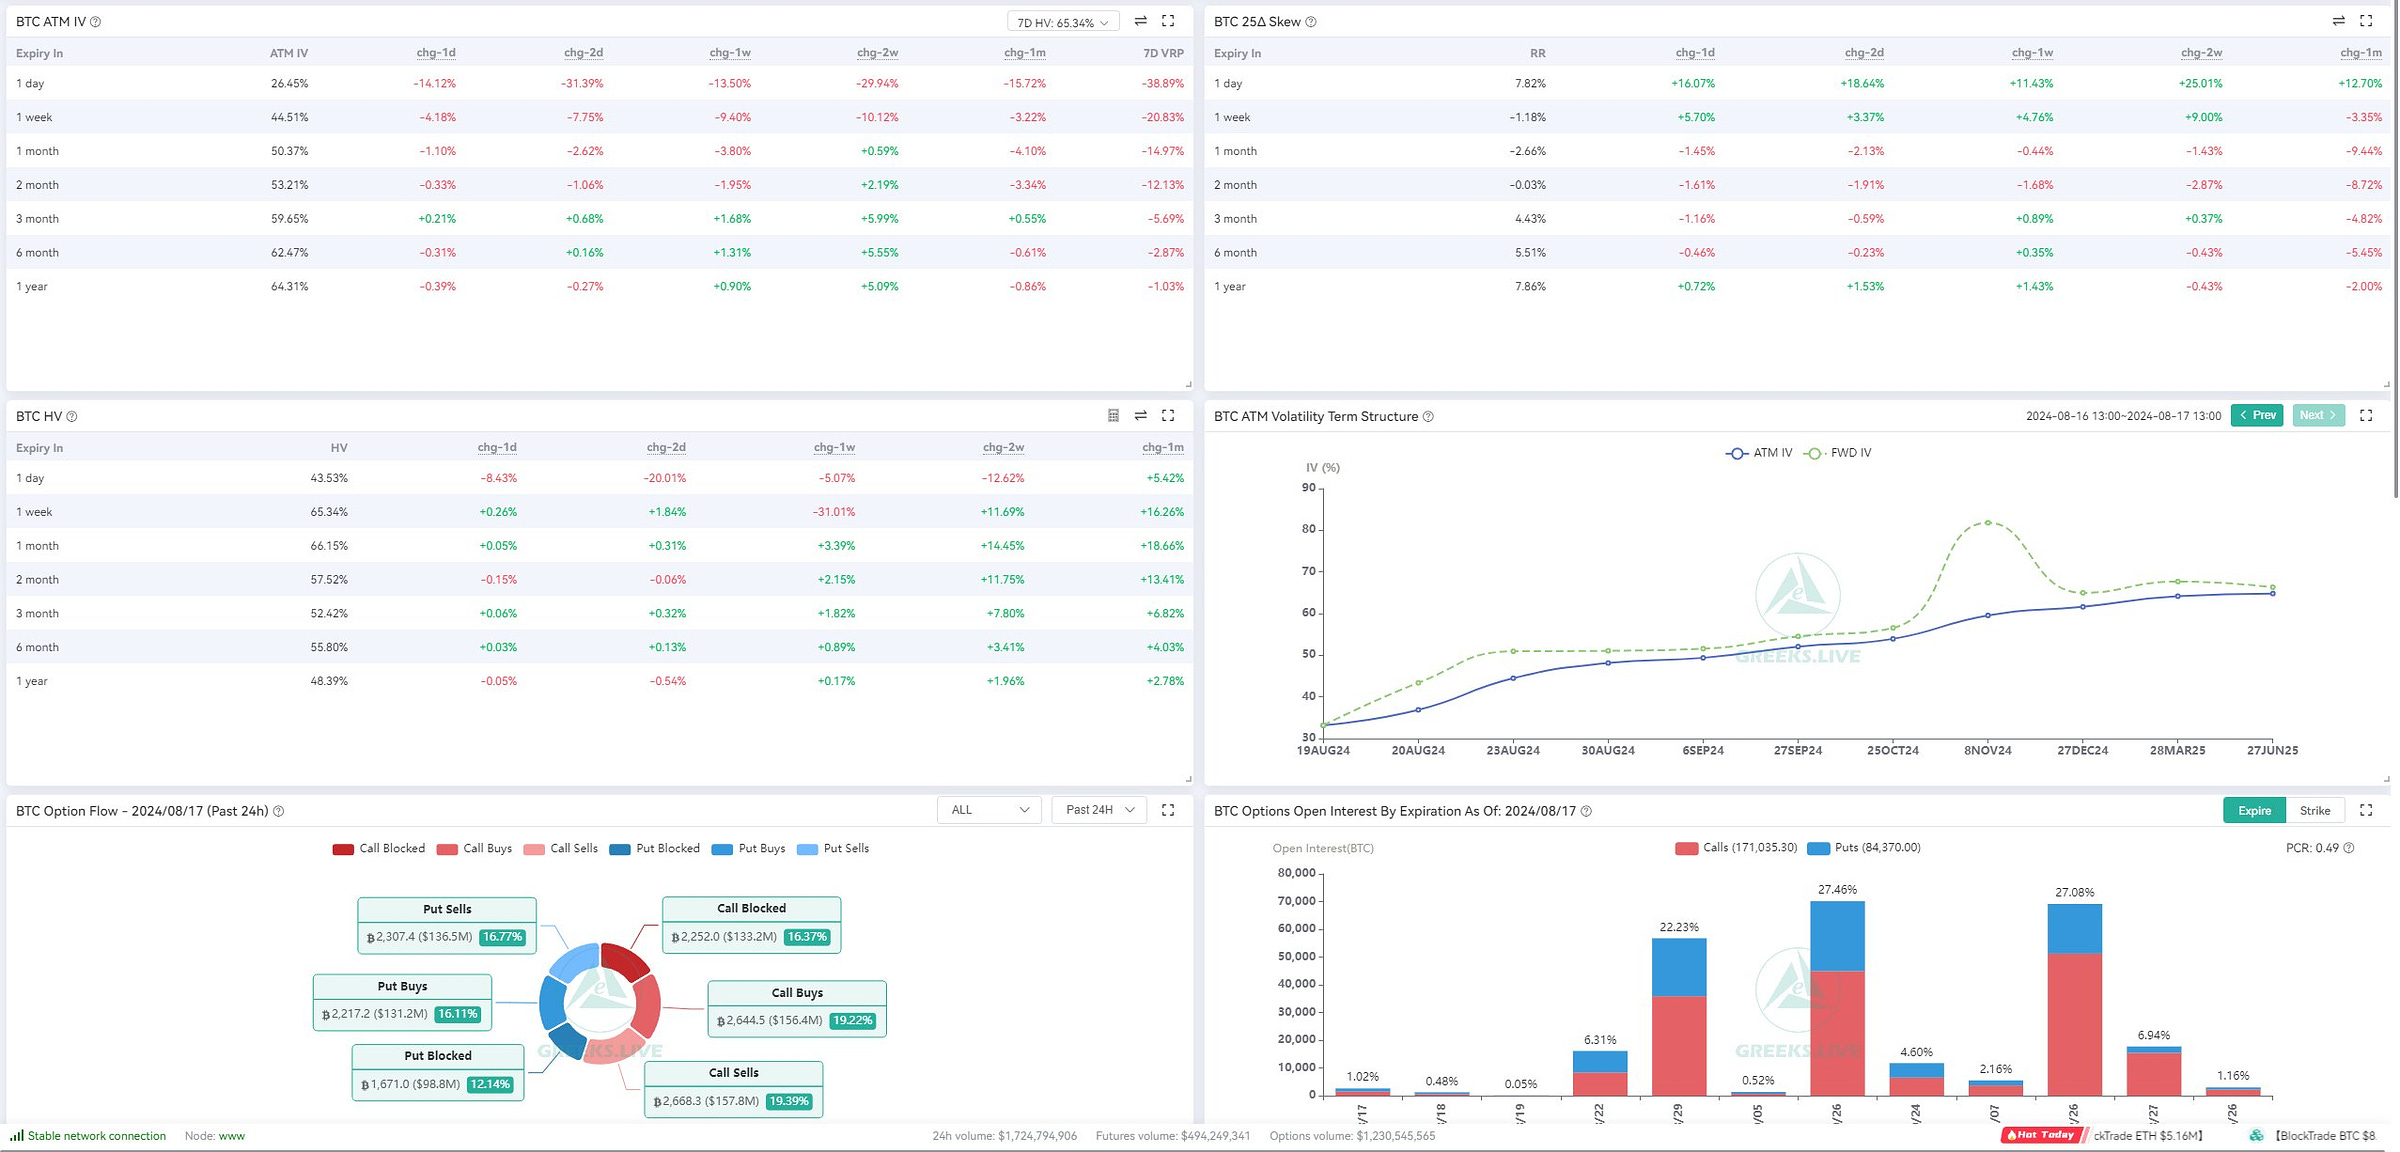
The implied volatility (IV) indicates heightened uncertainty in the short term (1 day to 1 week). However, the historical volatility (HV) is decreasing, particularly for short-term options, suggesting that actual price swings have been less severe than anticipated.
2. Max Pain and Options Flows
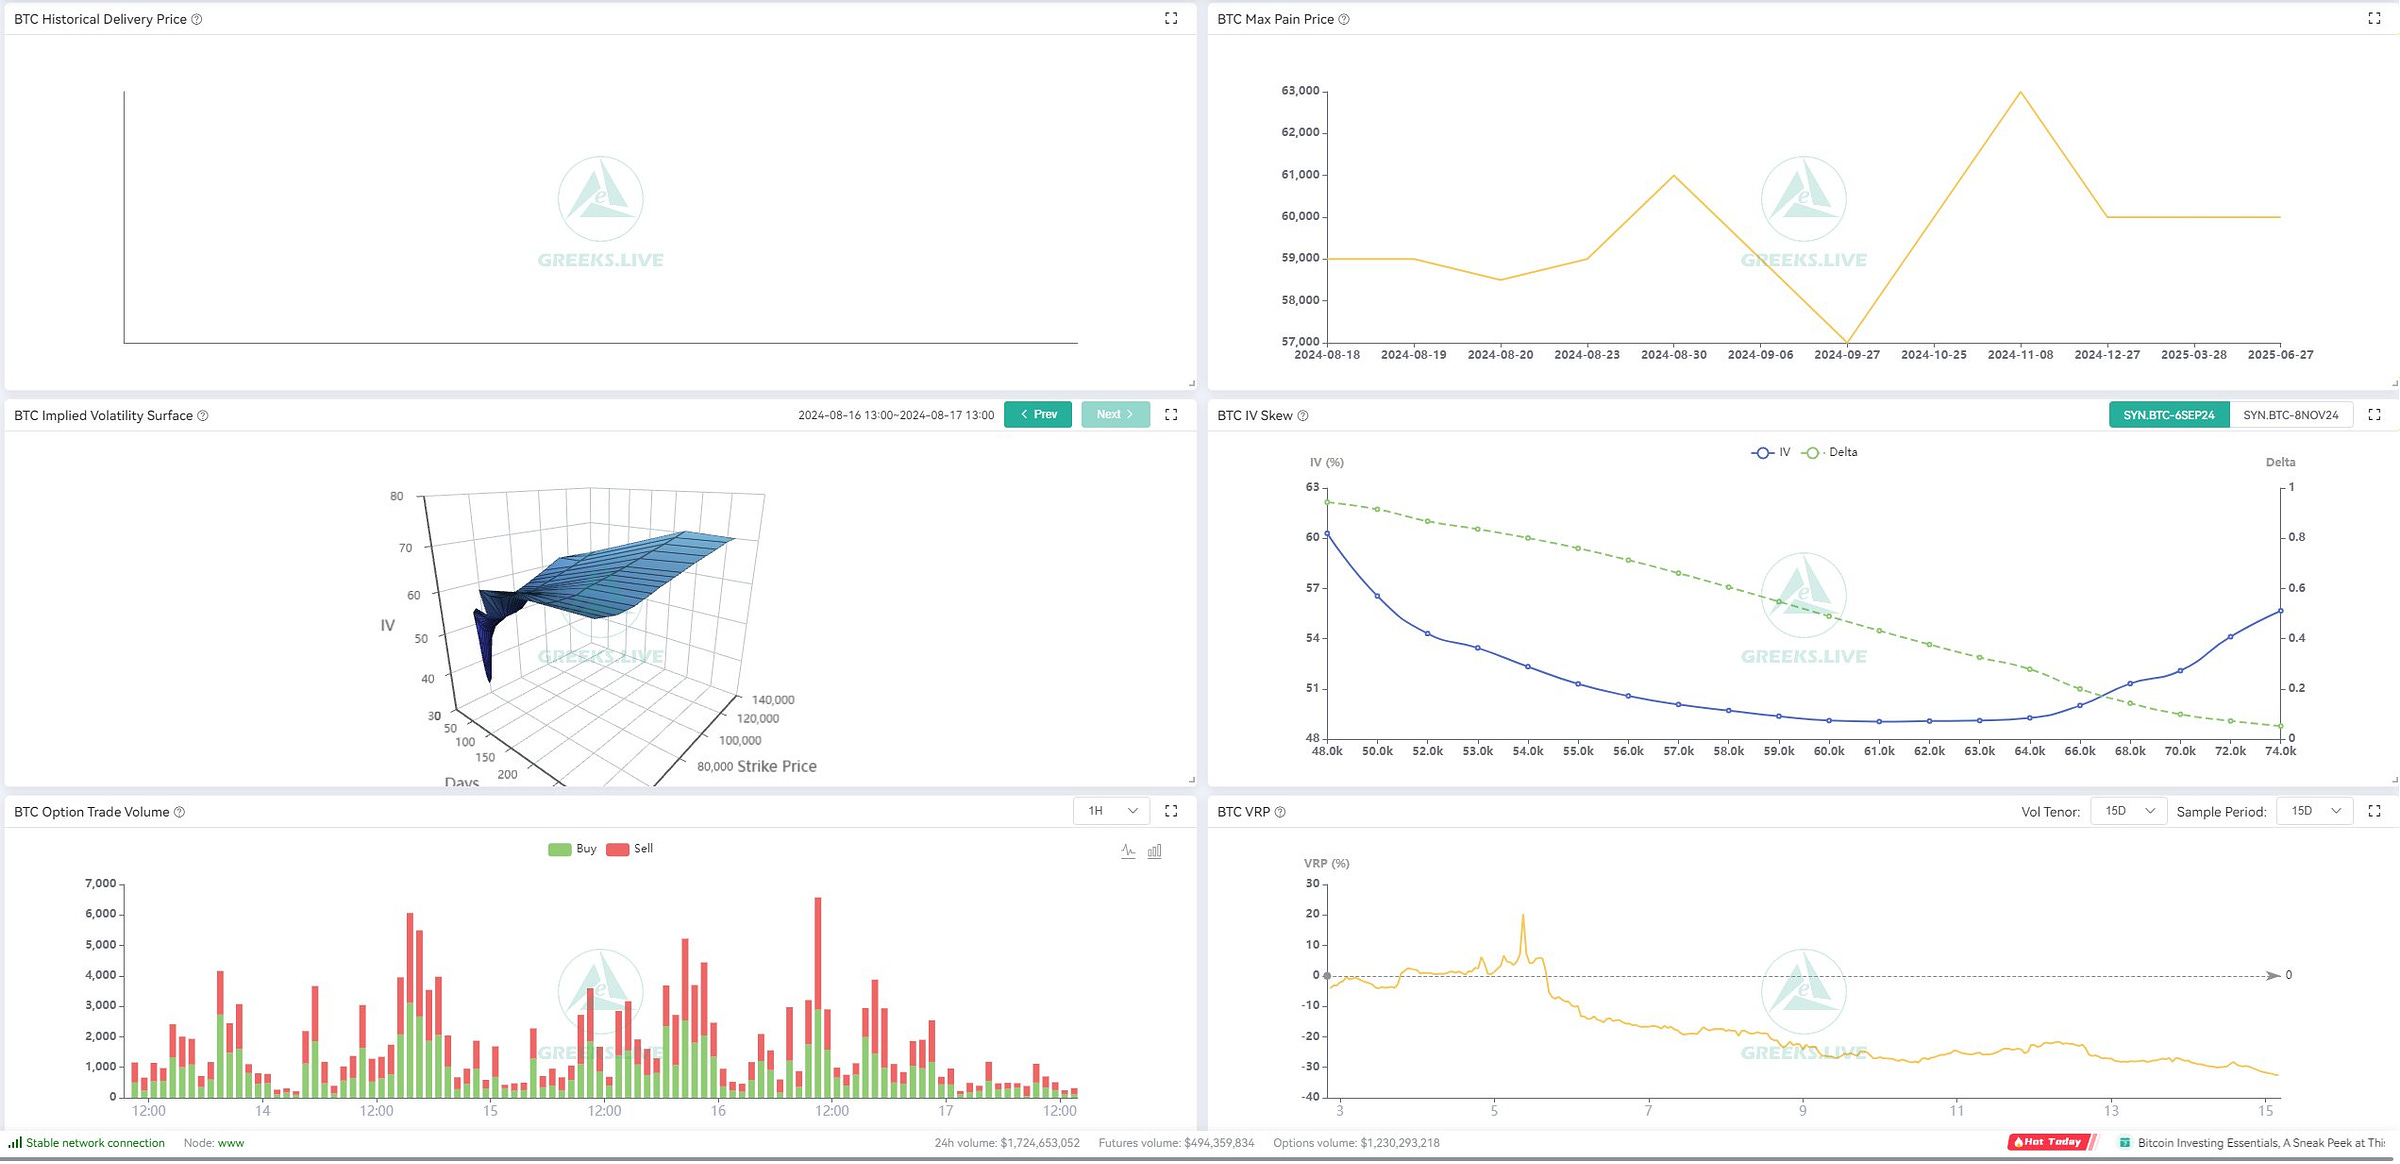
The "Max Pain" price range of $58,000 to $63,000 suggests that the price might stabilize within this range, as most options would expire worthless there. Options flows show a balanced activity between call and put options, signaling a neutral to slightly bullish sentiment.
3. Volatility Skew and Volatility Surface
The volatility skew indicates higher implied volatility at higher strike prices, typically a bullish sign, as it shows traders expect upward price movements. The volatility surface suggests that options with longer expirations have higher implied volatility, indicating greater uncertainty about long-term price action.
4. VRP (Volatility Risk Premium) T
he negative VRP indicates that the market expects lower future volatility or that implied volatility is currently higher than expected future volatility. Price Forecast for the Weekend Based on the data: The Bitcoin price is likely to range between $58,000 and $63,000 this weekend, supported by the Max Pain price. There is a slightly bullish sentiment, which could push the price toward $65,000 if it breaks the $63,000 level. However, given the current market uncertainty and negative VRP, a dip to $57,000 is also possible if the market consolidates further.
Conclusion
This weekend might see Bitcoin trading in the $57,000 to $63,000 range, with a higher probability of sideways movement or a slight upward recovery. Traders should be prepared for increased volatility, especially toward the end of the weekend, when trading volume typically decreases, making sudden price swings more likely.
#Bitcoin Futures Data Analysis (Weekend)
Incorporating Futures Data and Liquidation Heatmap Bearish
Pressure
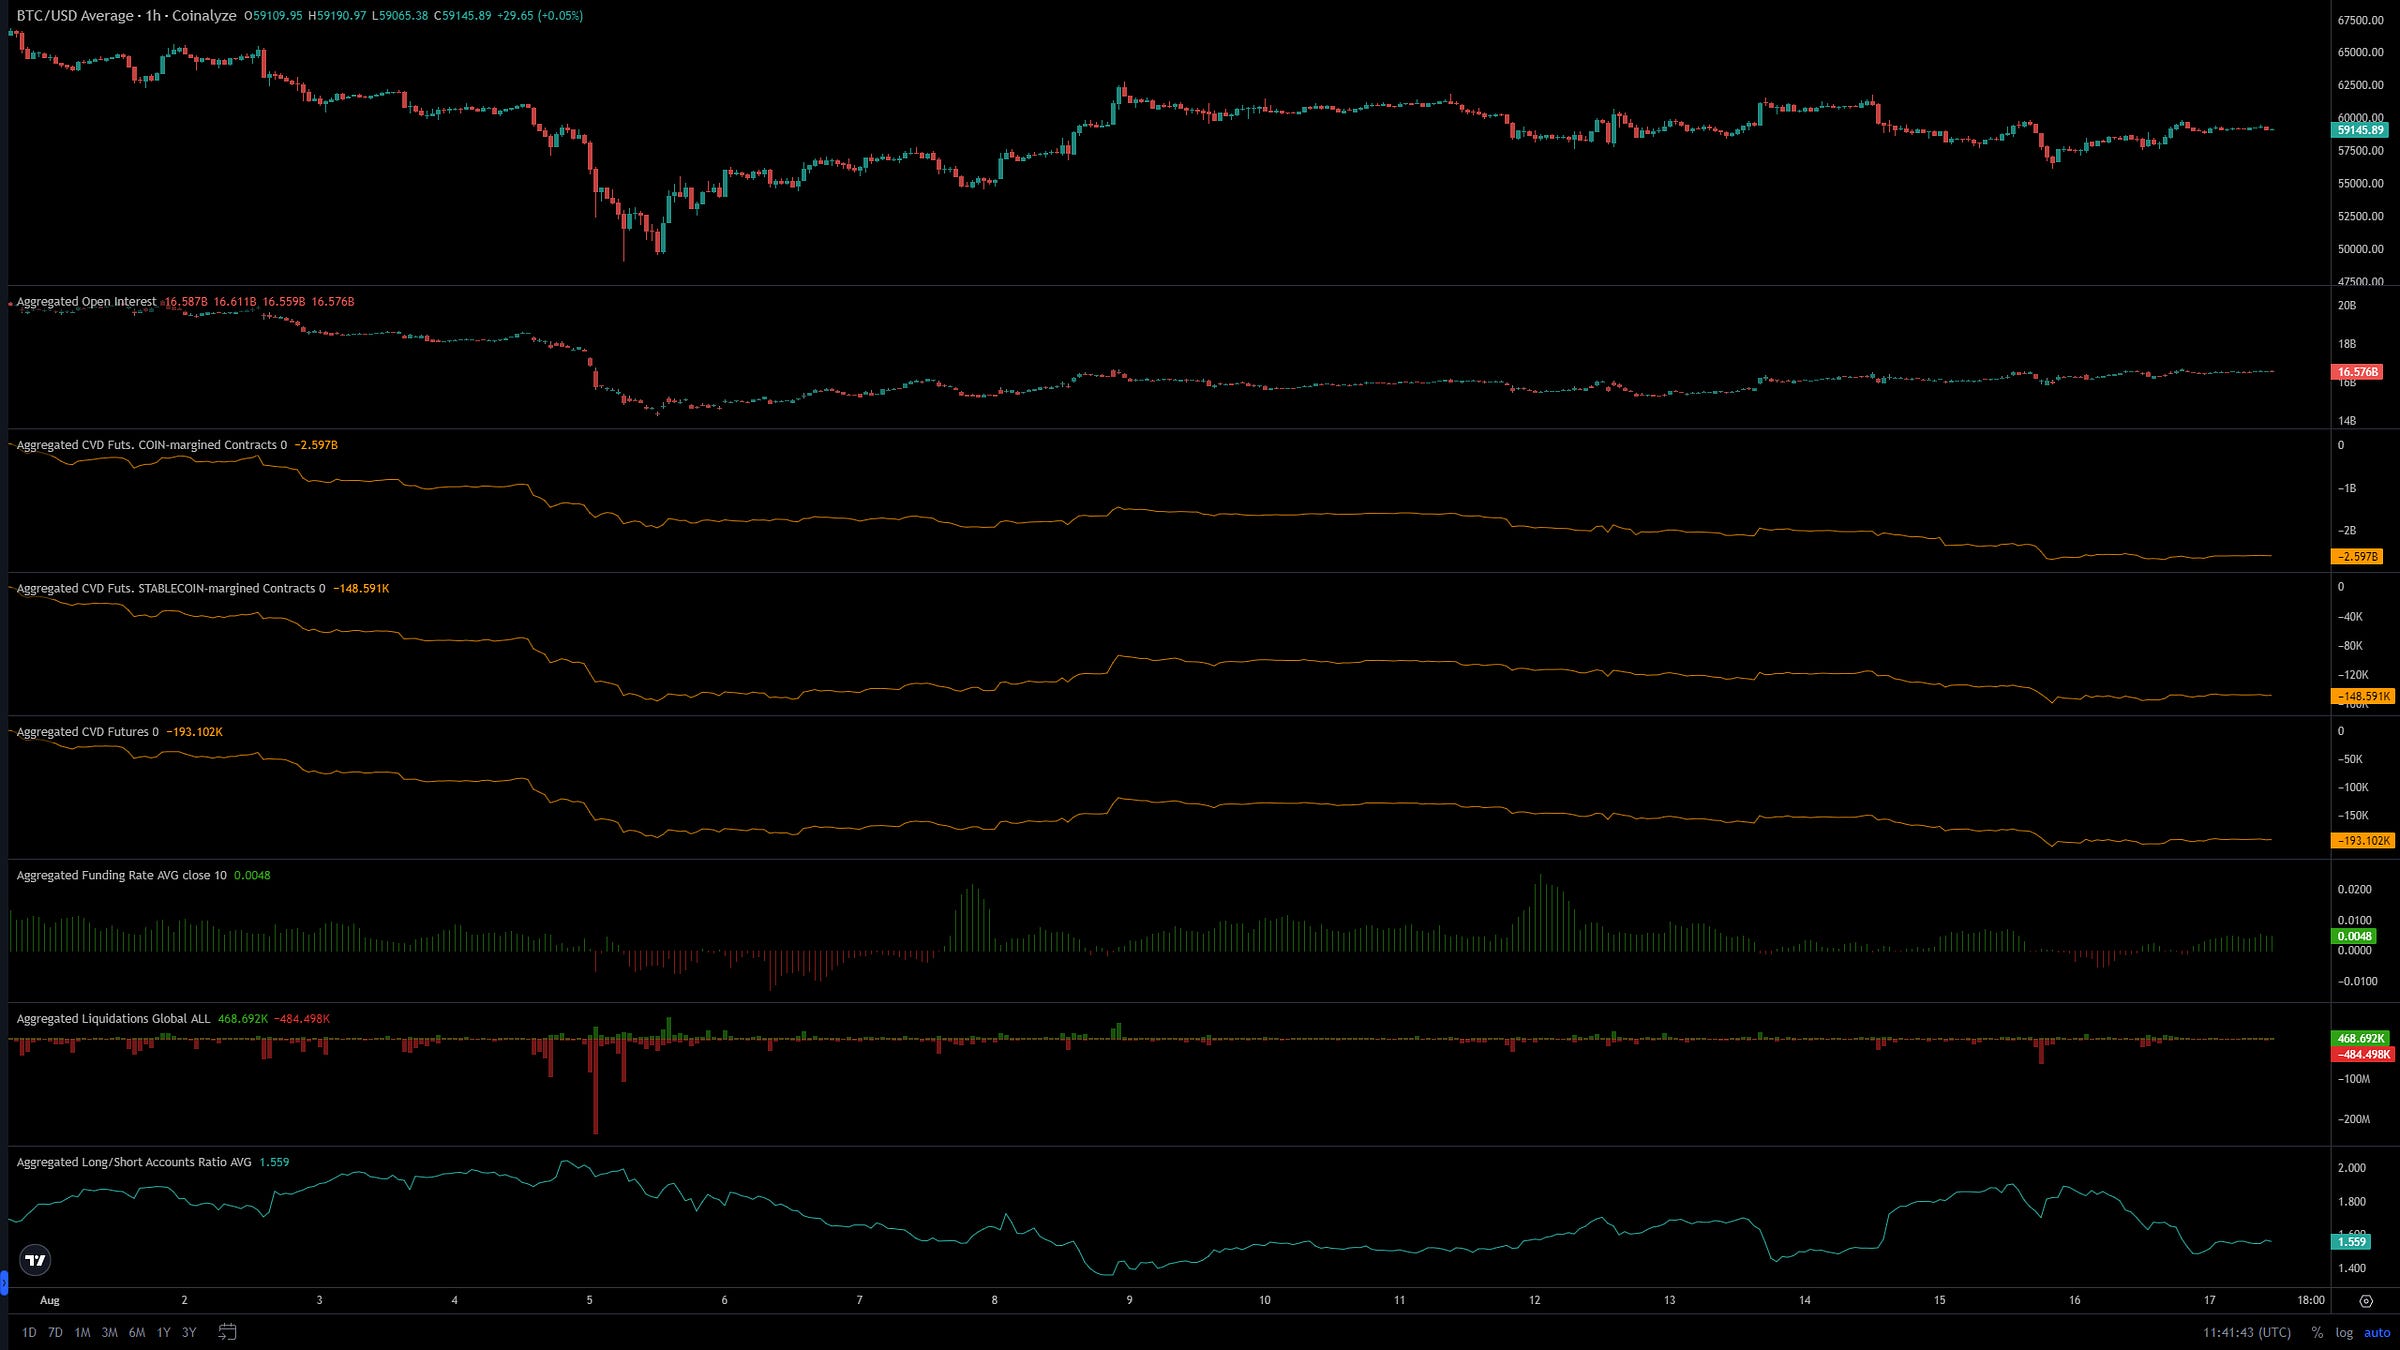
The futures data indicates continued selling pressure, especially in coin-margined and stablecoin-margined contracts.
Liquidation Levels
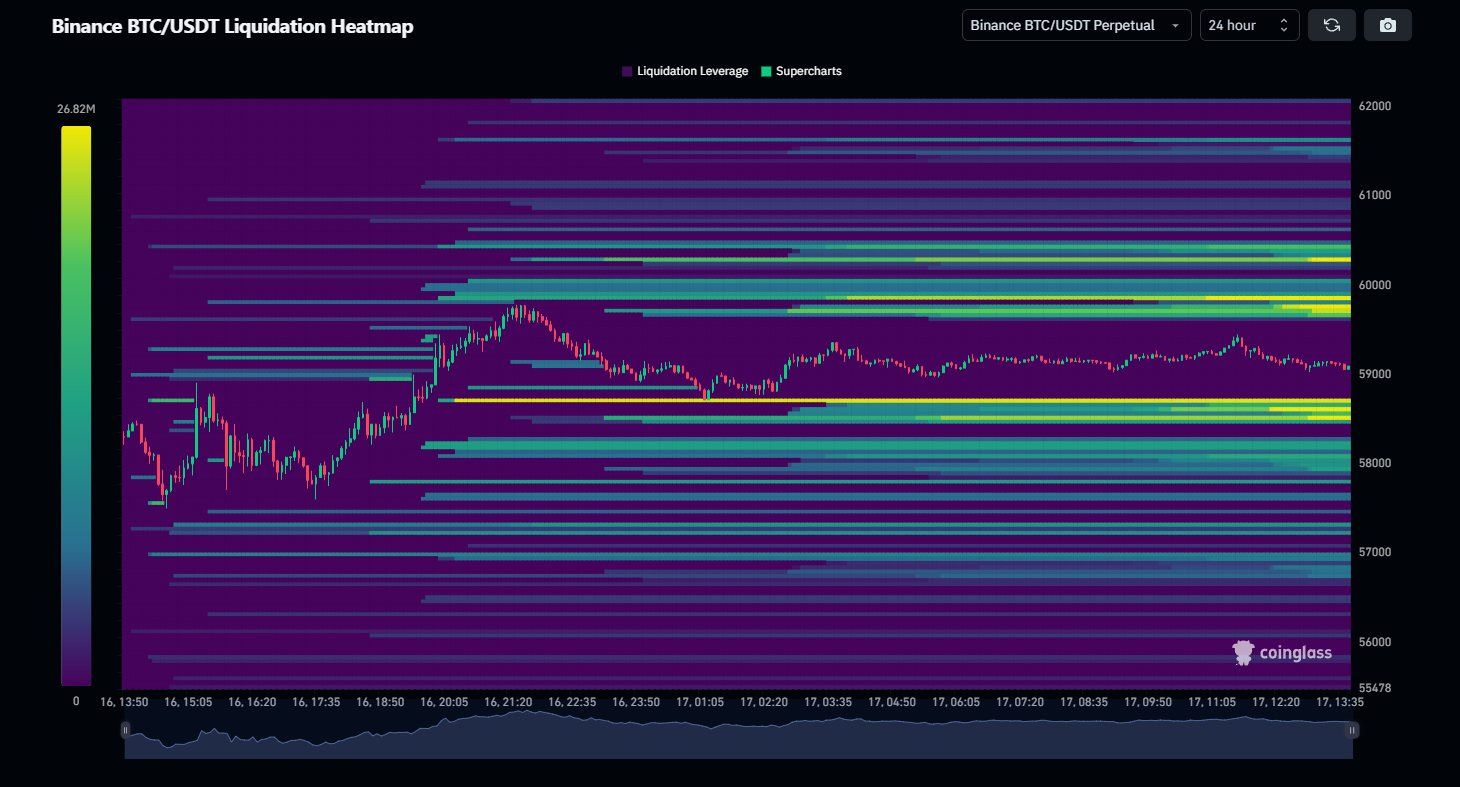
The heatmap shows significant liquidation clusters around the $58,000 and $60,000 levels. This suggests that if Bitcoin's price approaches these levels, we might see increased volatility due to liquidations.
Price Levels
Support Strong support around $58,000, with heavy liquidations likely if this level breaks.
Resistance Resistance near $60,000, where liquidations could trigger a pullback if the price struggles to break higher.
Forecast
Bearish Scenario If the price dips toward $58,000, expect a potential cascade of liquidations, pushing the price further down.
Bullish Scenario If Bitcoin holds above $60,000, a short squeeze could drive the price toward $63,000. Overall, prepare for volatility within the $58,000 to $60,000 range, with the potential for significant price movements driven by liquidations.
Funding Rates Overview
Stablecoin Margined Most exchanges show positive funding rates (e.g., Binance +0.0042% to +0.0064%, BitMEX +0.0100%), indicating a slight bullish sentiment among traders holding long positions. Coin Margined Generally positive funding rates, except for Kraken, which shows negative rates (-0.0015%), suggesting bearish sentiment on that exchange.
Key Highlights
Short-Term Bullishness Positive funding rates across most platforms indicate that long positions are being favored, but the sentiment is relatively weak. Kraken Divergence Kraken's negative funding rates might indicate localized bearish pressure, contrasting with the overall market sentiment. Overall Sentiment The market shows mild bullishness in the short term, supported by positive funding rates, though caution is advised due to mixed signals from specific exchanges like Kraken.
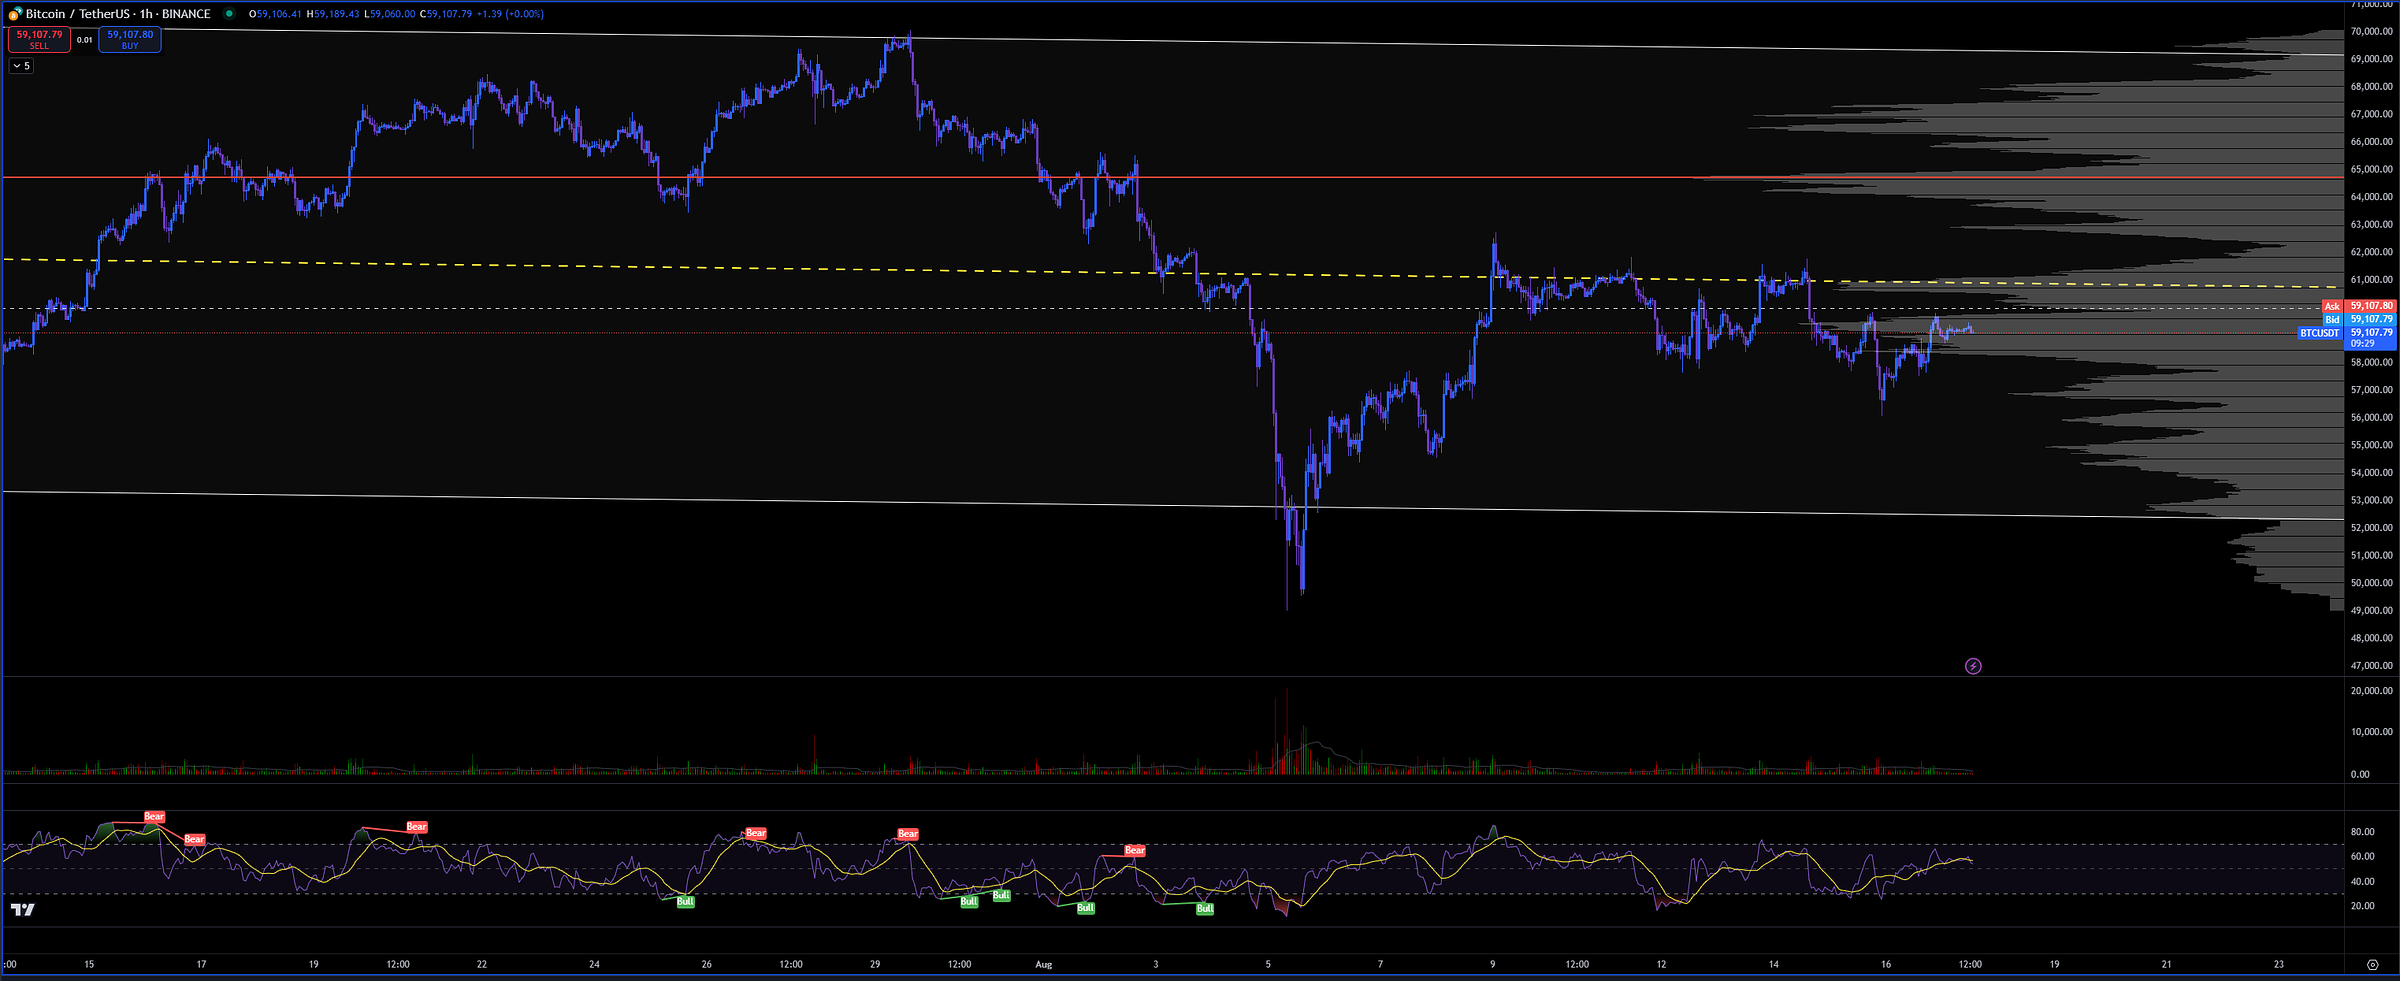
#Bitcoin TA, Price Action, RSI and Volume Profile (1H TF, Weekend)
Volume Profile
The volume profile shows significant trading activity around the $58,000 to $60,000 range, indicating strong support and resistance zones. The current price is hovering near the high-volume nodes, suggesting a consolidation phase.
RSI (Relative Strength Index)
The RSI is currently neutral, oscillating around the midline, which indicates neither overbought nor oversold conditions. However, previous RSI signals show alternating bullish and bearish divergences, suggesting a choppy market with no clear trend.
Price Action
Bitcoin has been in a sideways range after a previous sharp decline. The price action suggests indecision, with no clear breakout direction.
Options and Futures Data: The options market shows significant activity around $58,000 to $63,000, aligning with the volume profile's key levels. The futures data suggests bearish pressure, but with potential for a short squeeze if the price breaks above $60,000.
Liquidation Heatmap
The heatmap indicates potential liquidation triggers around $58,000 and $60,000, reinforcing these as critical levels to watch.
Weekend Forecast
Bearish Scenario:
If Bitcoin fails to hold above $58,000, expect a dip towards $57,000 or lower, driven by liquidations and bearish sentiment in futures.
Bullish Scenario: A break above $60,000 could trigger a short squeeze, pushing the price towards $63,000, although this is less likely given the current neutral RSI and indecisive price action.
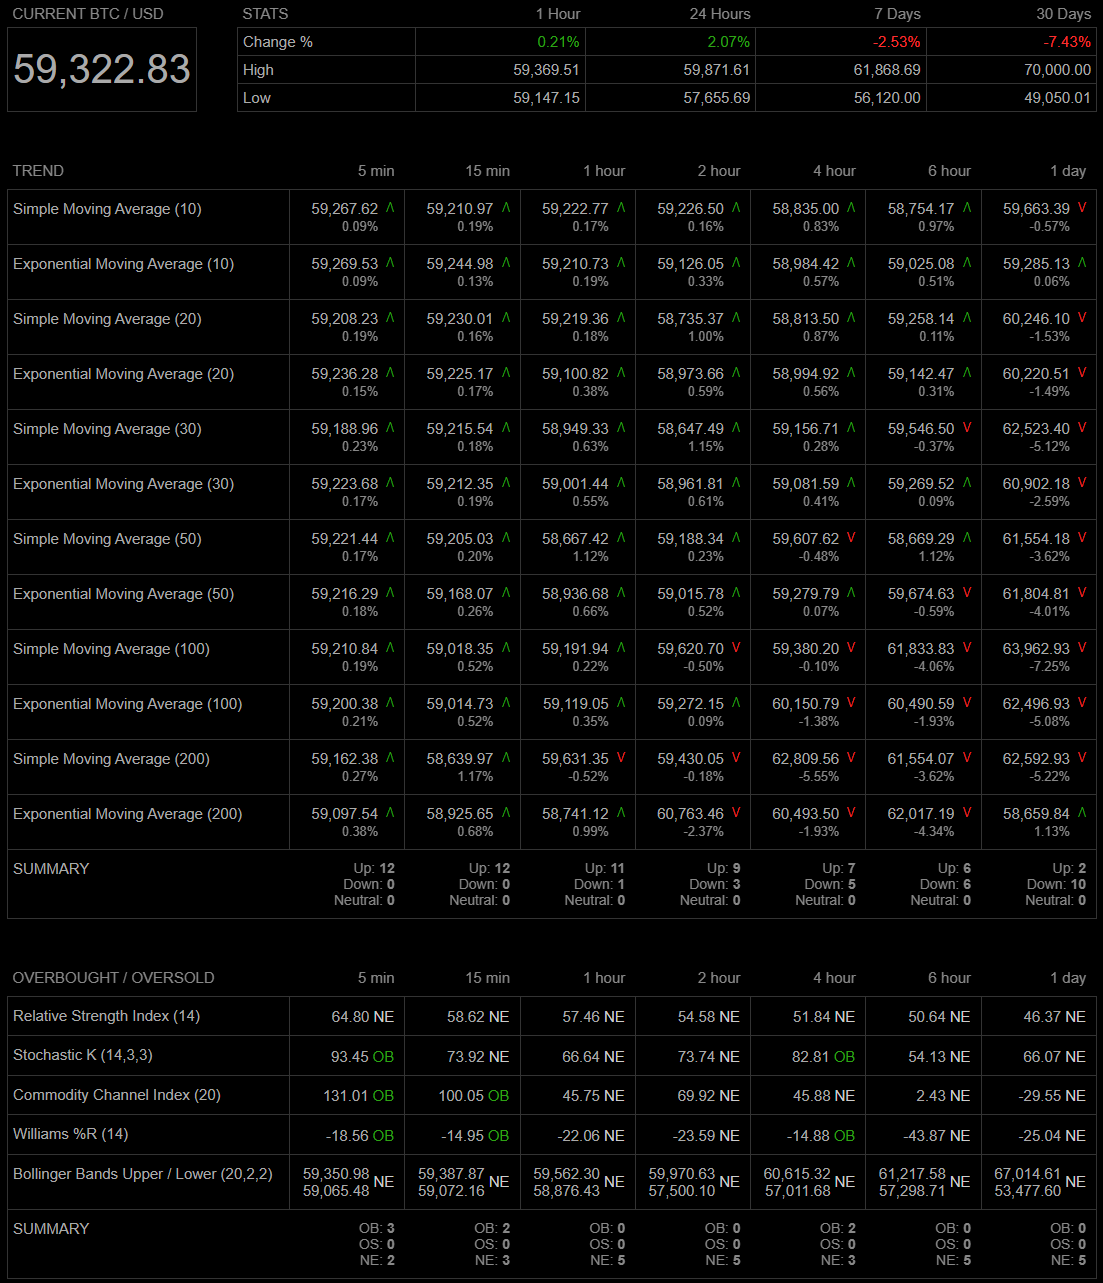
Bitcoin Trend Analysis
Moving Averages: Shorter time frames (5 min to 1 hour) are mostly bullish, with prices above key moving averages. Longer time frames (6 hours to 1 day) show bearish tendencies, with prices below key moving averages, indicating a potential downward trend.
Overbought/Oversold Indicators
Relative Strength Index (RSI): Neutral across most time frames, indicating no extreme overbought or oversold conditions.
Stochastic K: Overbought in short-term frames, which could indicate a pullback.
Williams %R: Mixed signals, with some short-term overbought conditions.
Highlights
Bullish in Short-Term Most moving averages in the short-term are showing upward trends. Potential Pullback Overbought indicators in the short-term suggest a possible pullback. Longer-Term Bearish Price is below key moving averages in the longer-term, indicating potential downward pressure.
Final Conclusion
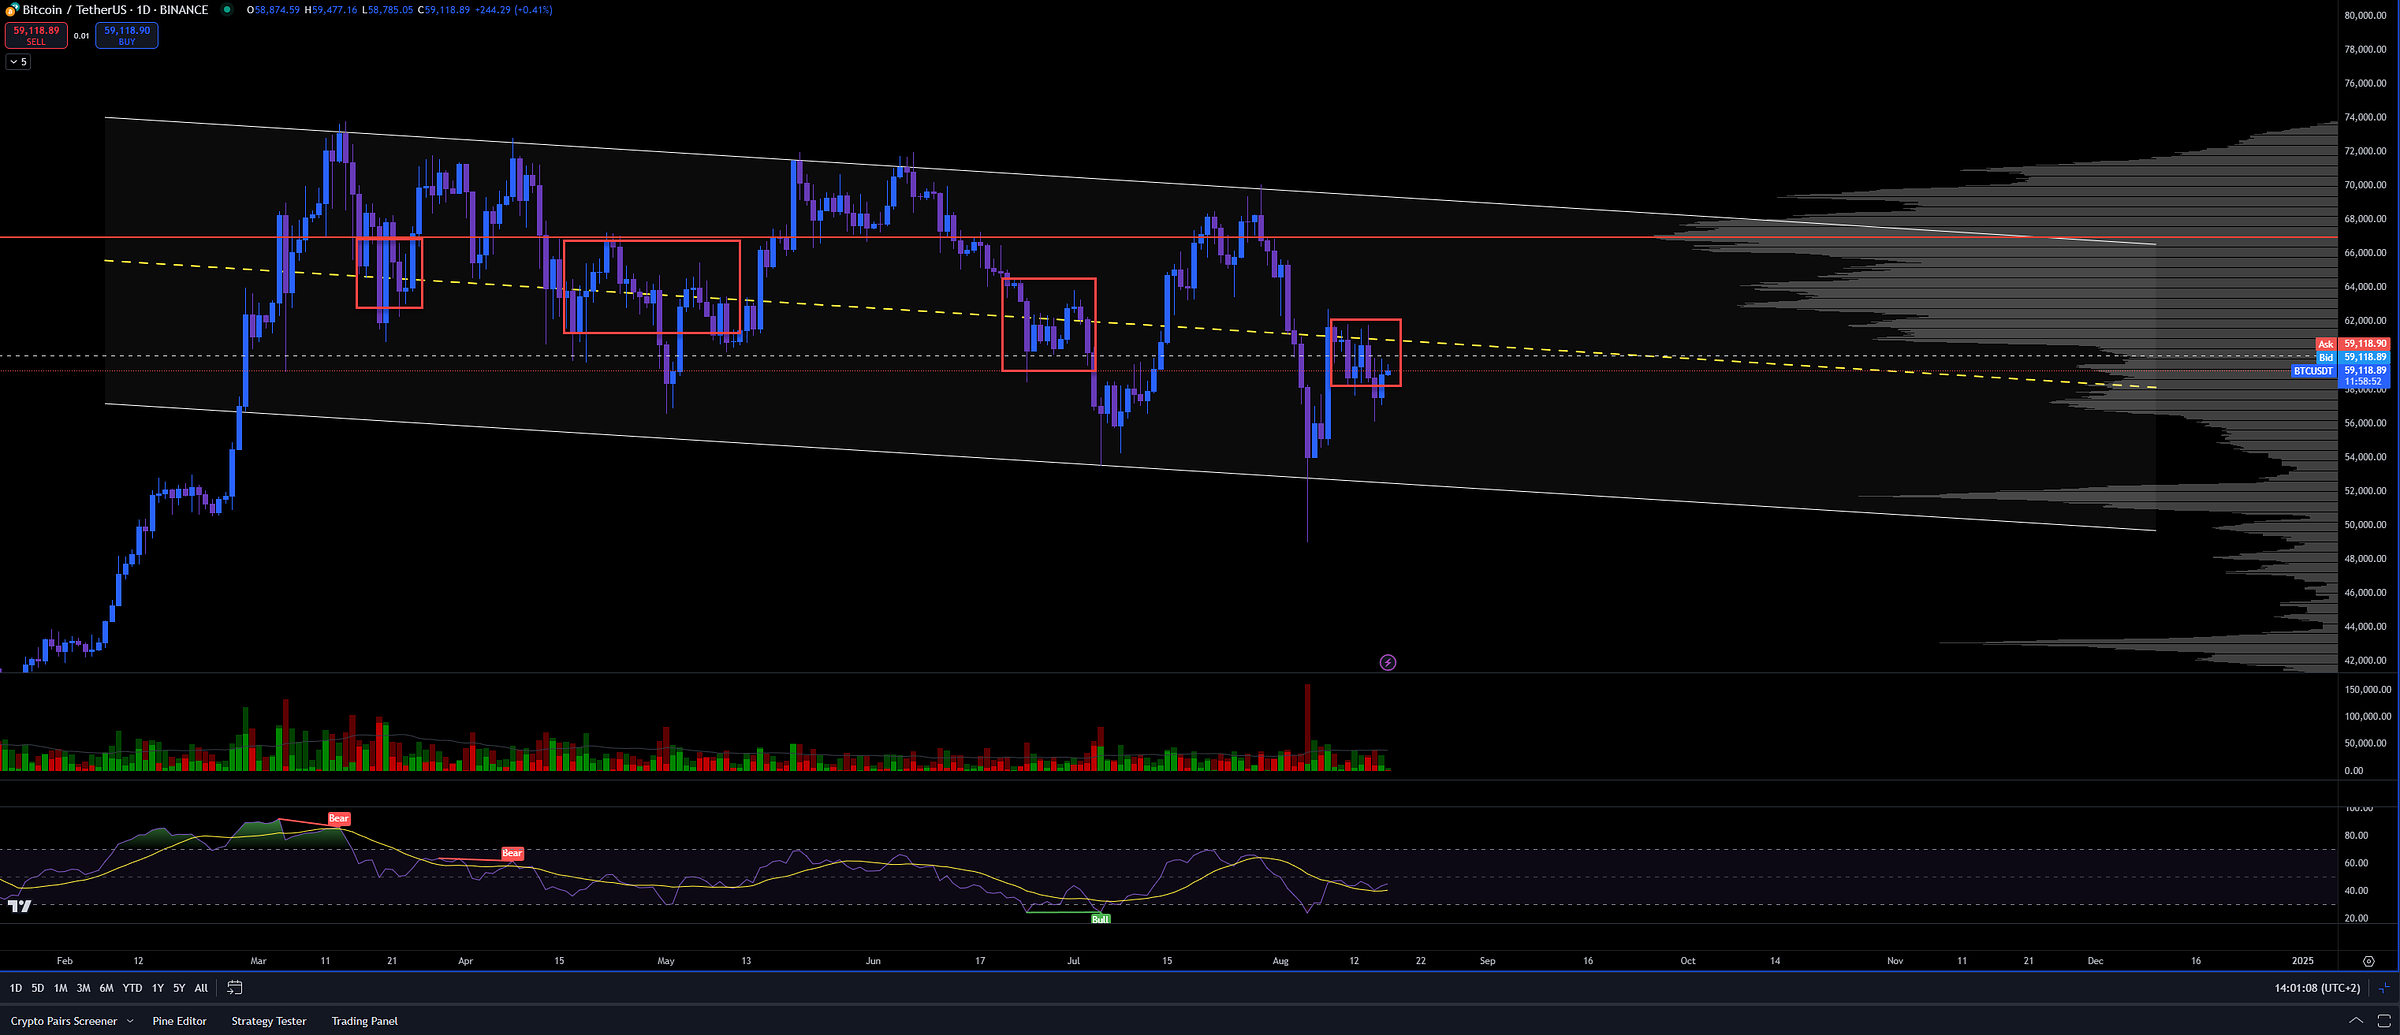
Expect Bitcoin to remain within the $58,000 to $60,000 range this weekend, with potential for volatility depending on how the price interacts with these key levels. Traders should watch for a breakout or breakdown, which could set the tone for the following week. Bitcoin remains near the center of the trend channel. Based on the data, I don't expect significant price movements this weekend. However, I've observed increased flows of USDT, FDUSD, and USDC over the past few days, totaling around $1.2 billion USD. These funds are typically used for both pumps and dumps, either to drive prices up or to buy the dip. Unfortunately, we need to be patient and wait for Bitcoin to indicate a clear direction again.


